
|
|||||
|
 | |
| |
| |
| |
| |
| |
|
Gene: NRK |
Gene summary for NRK |
| Gene information | Species | Human | Gene symbol | NRK | Gene ID | 203447 |
| Gene name | Nik related kinase | |
| Gene Alias | NESK | |
| Cytomap | Xq22.3 | |
| Gene Type | protein-coding | GO ID | GO:0000165 | UniProtAcc | Q7Z2Y5 |
Top |
Malignant transformation analysis |
| Identification of the aberrant gene expression in precancerous and cancerous lesions by comparing the gene expression of stem-like cells in diseased tissues with normal stem cells |
| Entrez ID | Symbol | Replicates | Species | Organ | Tissue | Adj P-value | Log2FC | Malignancy |
| 203447 | NRK | ATC13 | Human | Thyroid | ATC | 1.61e-39 | 7.98e-01 | 0.34 |
| 203447 | NRK | ATC5 | Human | Thyroid | ATC | 1.13e-41 | 8.40e-01 | 0.34 |
| Page: 1 |
| Tissue | Expression Dynamics | Abbreviation |
| Thyroid | 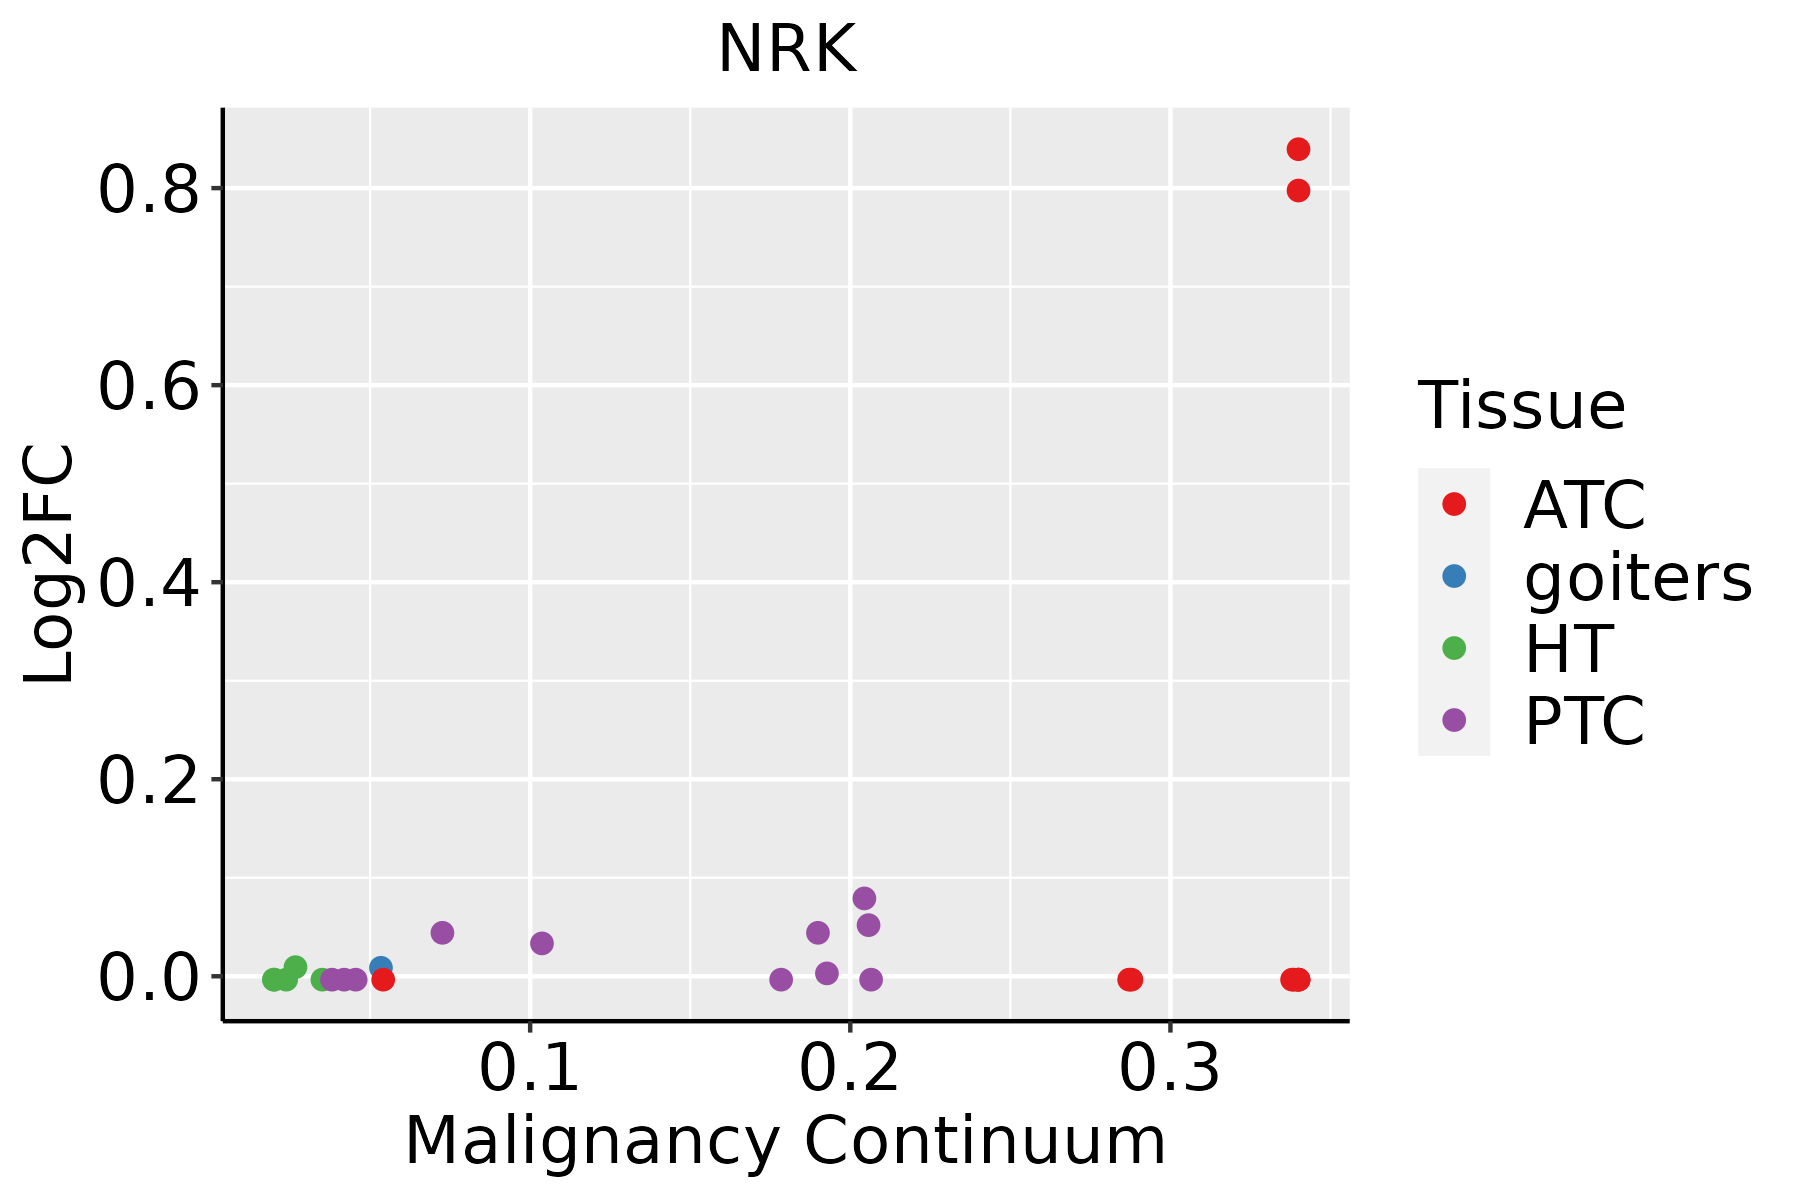 | ATC: Anaplastic thyroid cancer |
| HT: Hashimoto's thyroiditis | ||
| PTC: Papillary thyroid cancer |
| ∗log2FC in expression of this searched gene in stem-like cells from each diseased tissue sample relative to stem-like cells in normal samples in each tissue plotted against the malignancy continuum. Samples are colored based on if they are from different disease stage. |
Top |
Malignant transformation related pathway analysis |
| Find out the enriched GO biological processes and KEGG pathways involved in transition from healthy to precancer to cancer |
| Tissue | Disease Stage | Enriched GO biological Processes |
| Colorectum | AD |  |
| Colorectum | SER |  |
| Colorectum | MSS |  |
| Colorectum | MSI-H |  |
| Colorectum | FAP |  |
| ∗Top 15 enriched GO BP terms are showed in the bar plot of each disease state in each tissue. Each row represents a significant GO biological process which is colored according to the -log10(p.adjust). |
| Page: 1 2 3 4 5 6 7 8 9 |
| GO ID | Tissue | Disease Stage | Description | Gene Ratio | Bg Ratio | pvalue | p.adjust | Count |
| GO:003009912 | Liver | Cirrhotic | myeloid cell differentiation | 135/4634 | 381/18723 | 1.69e-06 | 3.22e-05 | 135 |
| GO:003009922 | Liver | HCC | myeloid cell differentiation | 200/7958 | 381/18723 | 4.64e-05 | 4.49e-04 | 200 |
| GO:003009928 | Skin | AK | myeloid cell differentiation | 72/1910 | 381/18723 | 1.76e-07 | 7.28e-06 | 72 |
| GO:0030099112 | Skin | SCCIS | myeloid cell differentiation | 41/919 | 381/18723 | 2.11e-06 | 1.09e-04 | 41 |
| GO:003009929 | Skin | cSCC | myeloid cell differentiation | 146/4864 | 381/18723 | 6.38e-08 | 1.61e-06 | 146 |
| GO:0031532111 | Thyroid | ATC | actin cytoskeleton reorganization | 62/6293 | 107/18723 | 2.01e-07 | 3.17e-06 | 62 |
| Page: 1 |
| Pathway ID | Tissue | Disease Stage | Description | Gene Ratio | Bg Ratio | pvalue | p.adjust | qvalue | Count |
| Page: 1 |
Top |
Cell-cell communication analysis |
| Identification of potential cell-cell interactions between two cell types and their ligand-receptor pairs for different disease states |
| Ligand | Receptor | LRpair | Pathway | Tissue | Disease Stage |
| Page: 1 |
Top |
Single-cell gene regulatory network inference analysis |
| Find out the significant the regulons (TFs) and the target genes of each regulon across cell types for different disease states |
| TF | Cell Type | Tissue | Disease Stage | Target Gene | RSS | Regulon Activity |
| ∗The dot plots of a searched regulon are shown for all cell subpopulations in each disease state of each tissue based on the regulon specific score inferred using pySCENIC and by calculating the average expression. |
| Page: 1 |
Top |
Somatic mutation of malignant transformation related genes |
| Annotation of somatic variants for genes involved in malignant transformation |
| Hugo Symbol | Variant Class | Variant Classification | dbSNP RS | HGVSc | HGVSp | HGVSp Short | SWISSPROT | BIOTYPE | SIFT | PolyPhen | Tumor Sample Barcode | Tissue | Histology | Sex | Age | Stage | Therapy Types | Drugs | Outcome |
| NRK | SNV | Missense_Mutation | novel | c.4473N>C | p.Lys1491Asn | p.K1491N | Q7Z2Y5 | protein_coding | deleterious(0) | probably_damaging(0.999) | TCGA-5L-AAT1-01 | Breast | breast invasive carcinoma | Female | <65 | III/IV | Hormone Therapy | letrozol | SD |
| NRK | SNV | Missense_Mutation | c.3950T>A | p.Phe1317Tyr | p.F1317Y | Q7Z2Y5 | protein_coding | tolerated(0.64) | benign(0.429) | TCGA-A2-A04R-01 | Breast | breast invasive carcinoma | Female | <65 | I/II | Chemotherapy | taxol | SD | |
| NRK | SNV | Missense_Mutation | novel | c.3951C>A | p.Phe1317Leu | p.F1317L | Q7Z2Y5 | protein_coding | deleterious(0) | possibly_damaging(0.892) | TCGA-A2-A04R-01 | Breast | breast invasive carcinoma | Female | <65 | I/II | Chemotherapy | taxol | SD |
| NRK | SNV | Missense_Mutation | rs41300163 | c.3281C>A | p.Pro1094His | p.P1094H | Q7Z2Y5 | protein_coding | tolerated(0.2) | benign(0) | TCGA-A2-A0YF-01 | Breast | breast invasive carcinoma | Female | >=65 | I/II | Unspecific | Arimidex | SD |
| NRK | SNV | Missense_Mutation | rs775671567 | c.365N>A | p.Arg122Gln | p.R122Q | Q7Z2Y5 | protein_coding | tolerated(0.14) | benign(0.035) | TCGA-A2-A1FX-01 | Breast | breast invasive carcinoma | Female | <65 | III/IV | Chemotherapy | taxotere | SD |
| NRK | SNV | Missense_Mutation | c.3280N>A | p.Pro1094Thr | p.P1094T | Q7Z2Y5 | protein_coding | deleterious(0.02) | benign(0.003) | TCGA-A2-A25B-01 | Breast | breast invasive carcinoma | Female | <65 | I/II | Chemotherapy | taxotere | PD | |
| NRK | SNV | Missense_Mutation | novel | c.3509G>T | p.Gly1170Val | p.G1170V | Q7Z2Y5 | protein_coding | deleterious(0) | possibly_damaging(0.799) | TCGA-A7-A4SC-01 | Breast | breast invasive carcinoma | Female | <65 | I/II | Hormone Therapy | tamoxiphen | SD |
| NRK | SNV | Missense_Mutation | c.517G>A | p.Val173Ile | p.V173I | Q7Z2Y5 | protein_coding | deleterious(0.01) | probably_damaging(0.997) | TCGA-A8-A093-01 | Breast | breast invasive carcinoma | Female | <65 | I/II | Hormone Therapy | tamoxiphen | SD | |
| NRK | SNV | Missense_Mutation | c.3437A>G | p.Asn1146Ser | p.N1146S | Q7Z2Y5 | protein_coding | tolerated(1) | benign(0) | TCGA-AO-A12H-01 | Breast | breast invasive carcinoma | Female | >=65 | I/II | Hormone Therapy | arimidex | SD | |
| NRK | SNV | Missense_Mutation | novel | c.2126C>T | p.Ser709Leu | p.S709L | Q7Z2Y5 | protein_coding | tolerated_low_confidence(0.23) | benign(0.001) | TCGA-B6-A2IU-01 | Breast | breast invasive carcinoma | Female | <65 | I/II | Unknown | Unknown | PD |
| Page: 1 2 3 4 5 6 7 8 9 10 11 12 13 14 15 16 17 18 19 20 21 22 23 24 25 26 |
Top |
Related drugs of malignant transformation related genes |
| Identification of chemicals and drugs interact with genes involved in malignant transfromation |
| (DGIdb 4.0) |
| Entrez ID | Symbol | Category | Interaction Types | Drug Claim Name | Drug Name | PMIDs |
| Page: 1 |

Copyright 2023-Present -The University of Texas Health Science Center at Houston |