
|
|||||
|
 | |
| |
| |
| |
| |
| |
|
Gene: NRIP1 |
Gene summary for NRIP1 |
| Gene information | Species | Human | Gene symbol | NRIP1 | Gene ID | 8204 |
| Gene name | nuclear receptor interacting protein 1 | |
| Gene Alias | CAKUT3 | |
| Cytomap | 21q11.2-q21.1 | |
| Gene Type | protein-coding | GO ID | GO:0000003 | UniProtAcc | A8K171 |
Top |
Malignant transformation analysis |
| Identification of the aberrant gene expression in precancerous and cancerous lesions by comparing the gene expression of stem-like cells in diseased tissues with normal stem cells |
| Entrez ID | Symbol | Replicates | Species | Organ | Tissue | Adj P-value | Log2FC | Malignancy |
| 8204 | NRIP1 | GSM4909297 | Human | Breast | IDC | 1.89e-05 | -9.76e-02 | 0.1517 |
| 8204 | NRIP1 | GSM4909311 | Human | Breast | IDC | 8.66e-05 | -9.03e-02 | 0.1534 |
| 8204 | NRIP1 | GSM4909312 | Human | Breast | IDC | 1.35e-02 | -1.05e-01 | 0.1552 |
| 8204 | NRIP1 | GSM4909315 | Human | Breast | IDC | 1.73e-03 | -1.33e-01 | 0.21 |
| 8204 | NRIP1 | GSM4909317 | Human | Breast | IDC | 1.68e-02 | 2.09e-01 | 0.1355 |
| 8204 | NRIP1 | GSM4909319 | Human | Breast | IDC | 1.78e-08 | -1.50e-01 | 0.1563 |
| 8204 | NRIP1 | NCCBC2 | Human | Breast | DCIS | 5.54e-05 | 6.90e-01 | 0.1554 |
| 8204 | NRIP1 | P1 | Human | Breast | IDC | 4.26e-03 | 2.22e-01 | 0.1527 |
| 8204 | NRIP1 | P3 | Human | Breast | IDC | 4.53e-03 | 6.08e-01 | 0.1542 |
| 8204 | NRIP1 | DCIS2 | Human | Breast | DCIS | 3.55e-47 | 1.64e-01 | 0.0085 |
| 8204 | NRIP1 | CA_HPV_1 | Human | Cervix | CC | 1.21e-02 | -1.33e-01 | 0.0264 |
| 8204 | NRIP1 | CCI_1 | Human | Cervix | CC | 4.97e-04 | 1.13e+00 | 0.528 |
| 8204 | NRIP1 | CCI_3 | Human | Cervix | CC | 1.92e-04 | 7.56e-01 | 0.516 |
| 8204 | NRIP1 | T3 | Human | Cervix | CC | 8.41e-04 | 2.37e-01 | 0.1389 |
| 8204 | NRIP1 | HTA11_3410_2000001011 | Human | Colorectum | AD | 5.30e-26 | -7.13e-01 | 0.0155 |
| 8204 | NRIP1 | HTA11_2487_2000001011 | Human | Colorectum | SER | 2.32e-15 | -6.79e-01 | -0.1808 |
| 8204 | NRIP1 | HTA11_2951_2000001011 | Human | Colorectum | AD | 7.02e-03 | -7.94e-01 | 0.0216 |
| 8204 | NRIP1 | HTA11_1938_2000001011 | Human | Colorectum | AD | 3.95e-07 | -6.05e-01 | -0.0811 |
| 8204 | NRIP1 | HTA11_78_2000001011 | Human | Colorectum | AD | 4.84e-02 | -4.54e-01 | -0.1088 |
| 8204 | NRIP1 | HTA11_3361_2000001011 | Human | Colorectum | AD | 1.25e-09 | -7.41e-01 | -0.1207 |
| Page: 1 2 3 4 5 6 7 8 9 10 11 |
| Tissue | Expression Dynamics | Abbreviation |
| Breast | 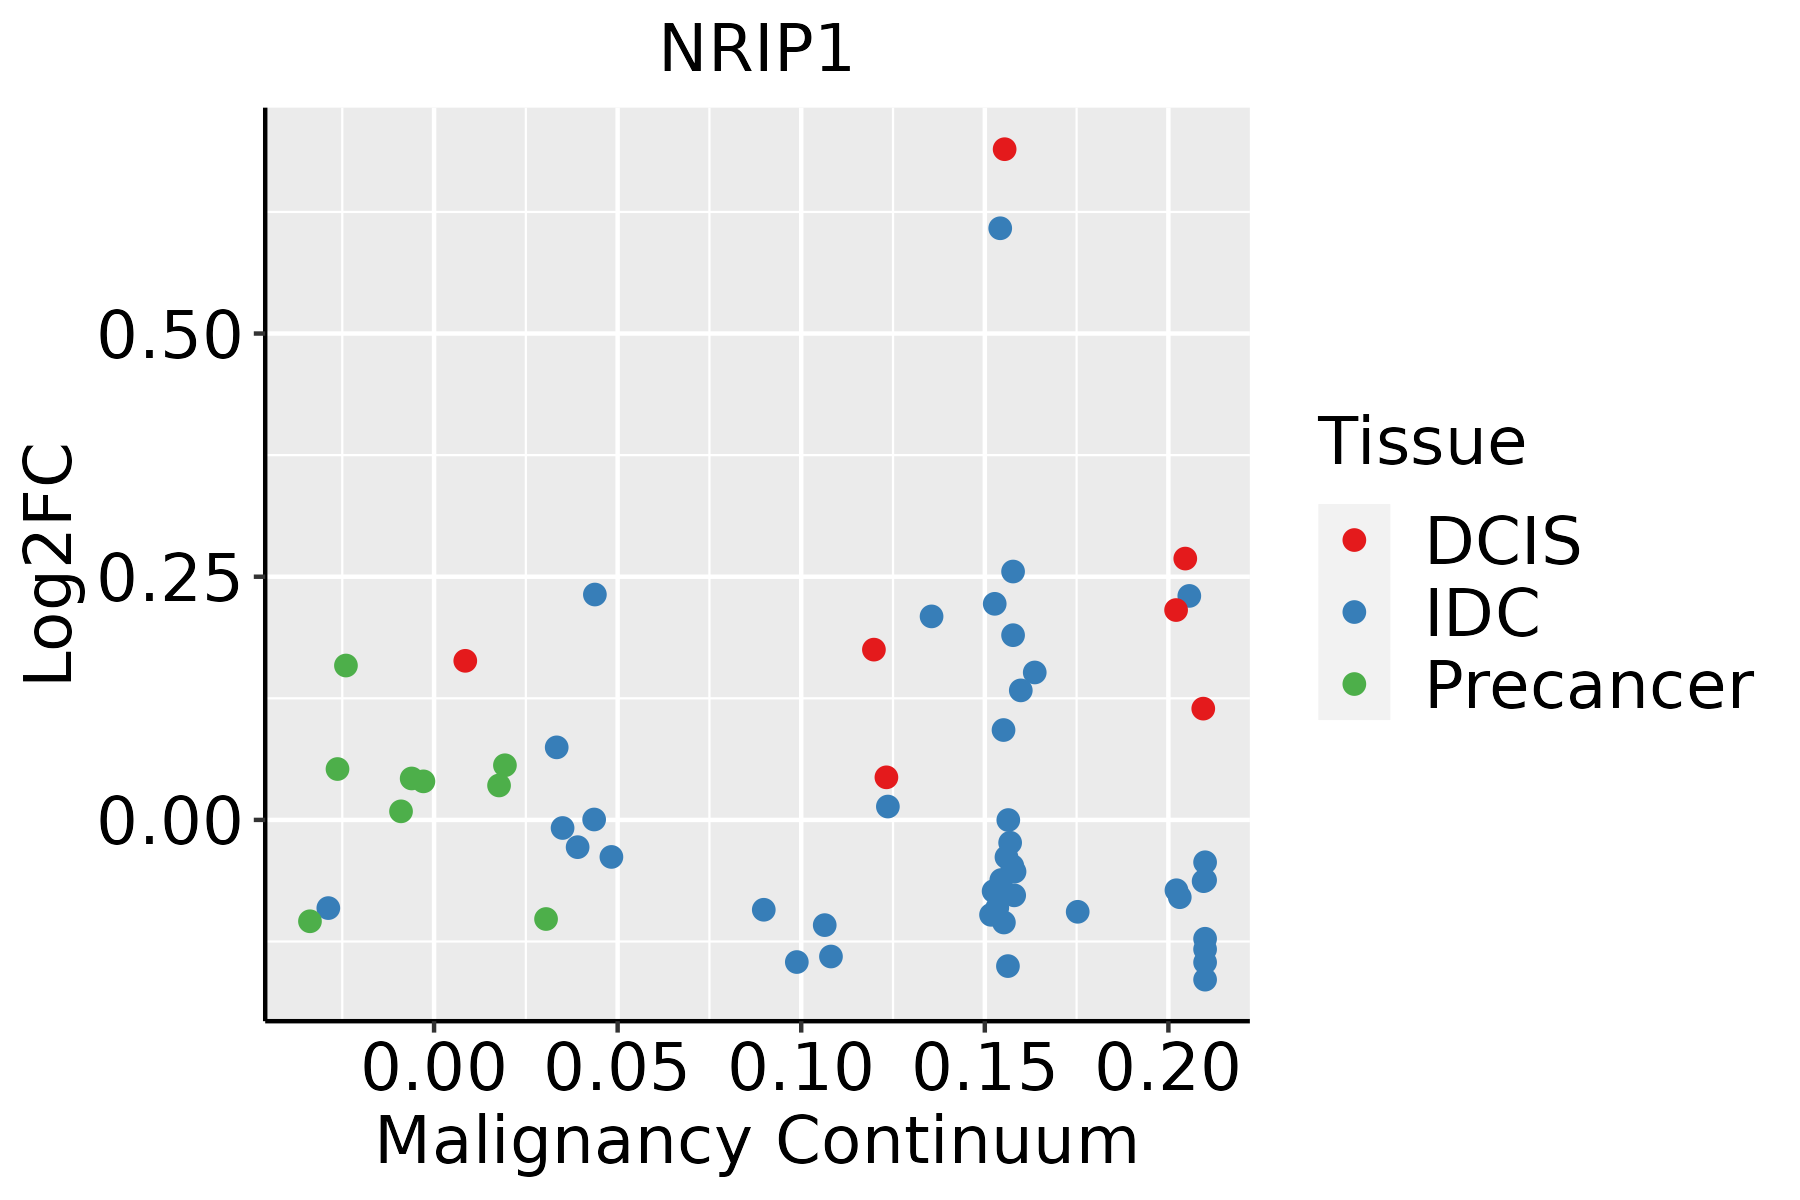 | IDC: Invasive ductal carcinoma |
| DCIS: Ductal carcinoma in situ | ||
| Precancer(BRCA1-mut): Precancerous lesion from BRCA1 mutation carriers | ||
| Cervix | 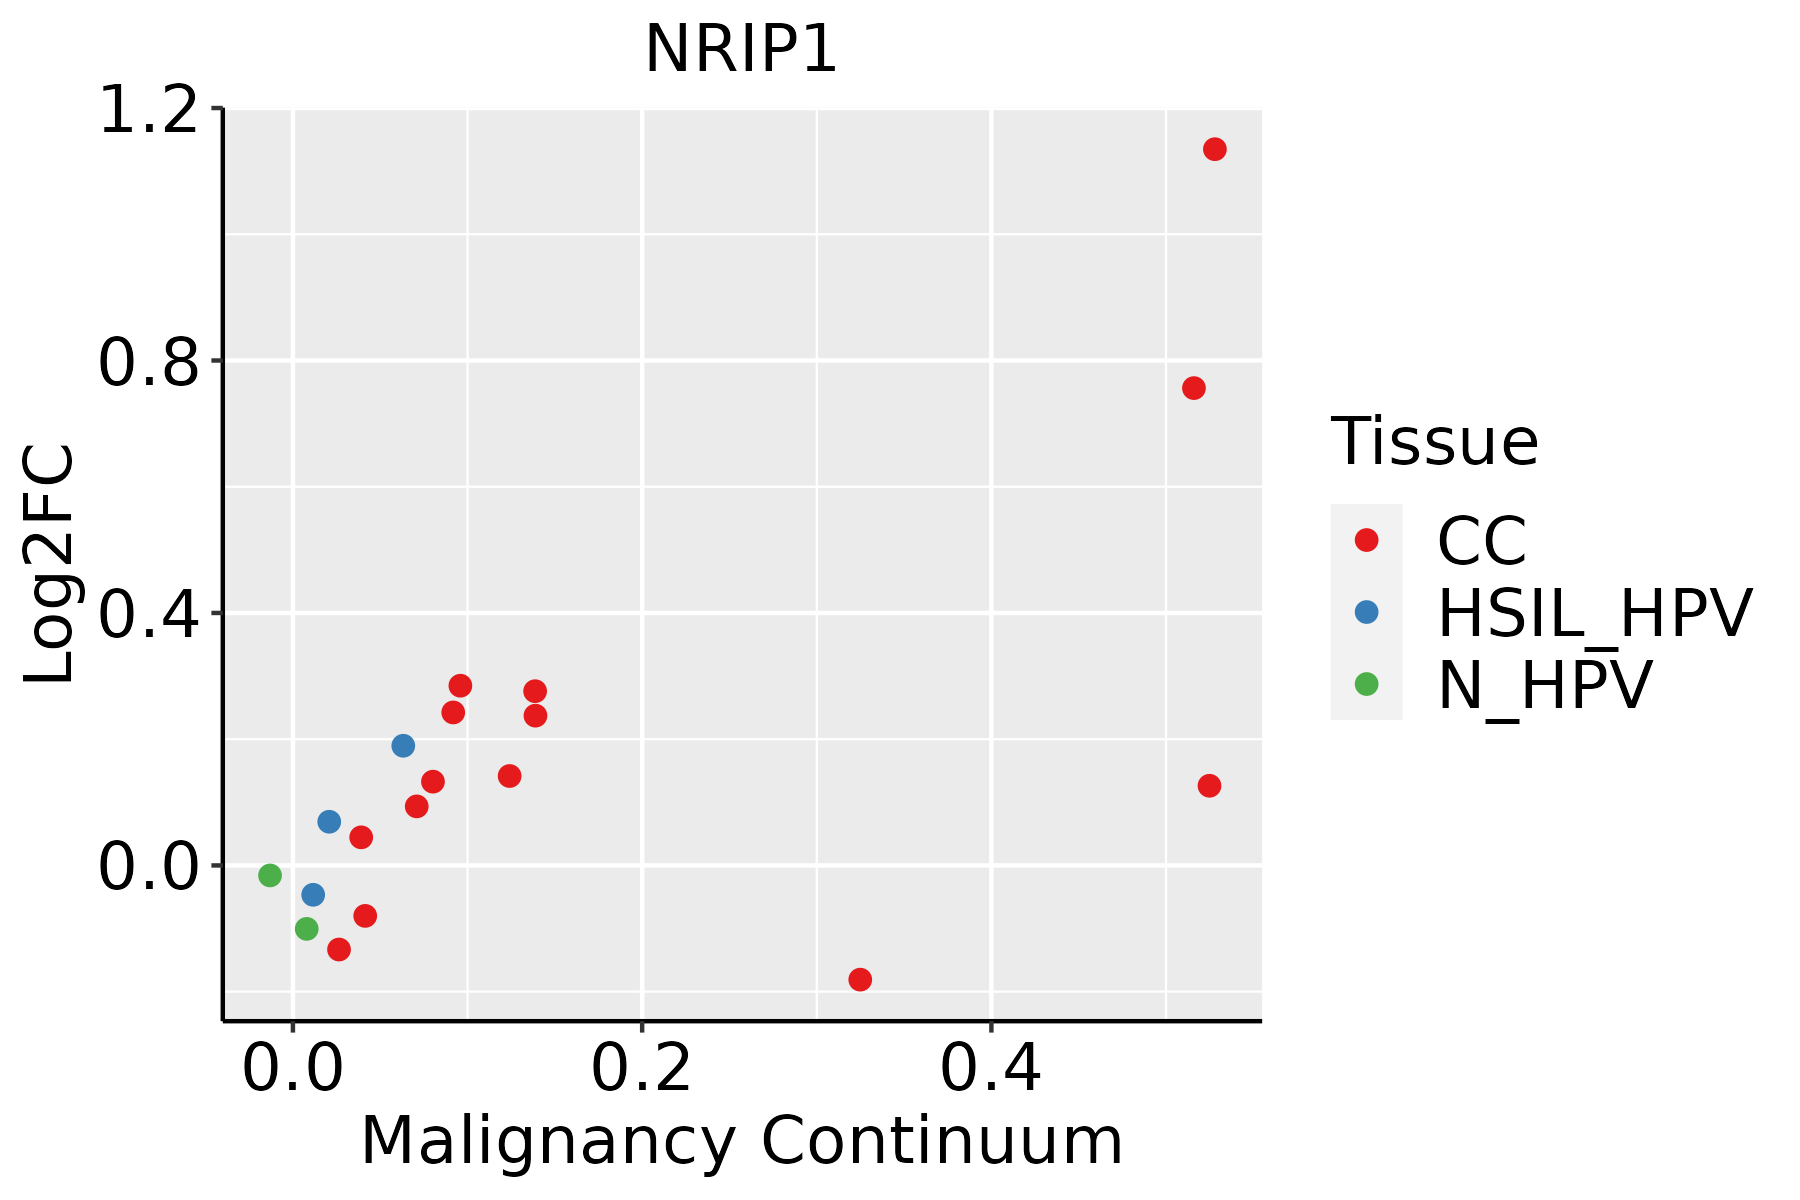 | CC: Cervix cancer |
| HSIL_HPV: HPV-infected high-grade squamous intraepithelial lesions | ||
| N_HPV: HPV-infected normal cervix | ||
| Colorectum (GSE201348) |  | FAP: Familial adenomatous polyposis |
| CRC: Colorectal cancer | ||
| Colorectum (HTA11) |  | AD: Adenomas |
| SER: Sessile serrated lesions | ||
| MSI-H: Microsatellite-high colorectal cancer | ||
| MSS: Microsatellite stable colorectal cancer | ||
| Endometrium | 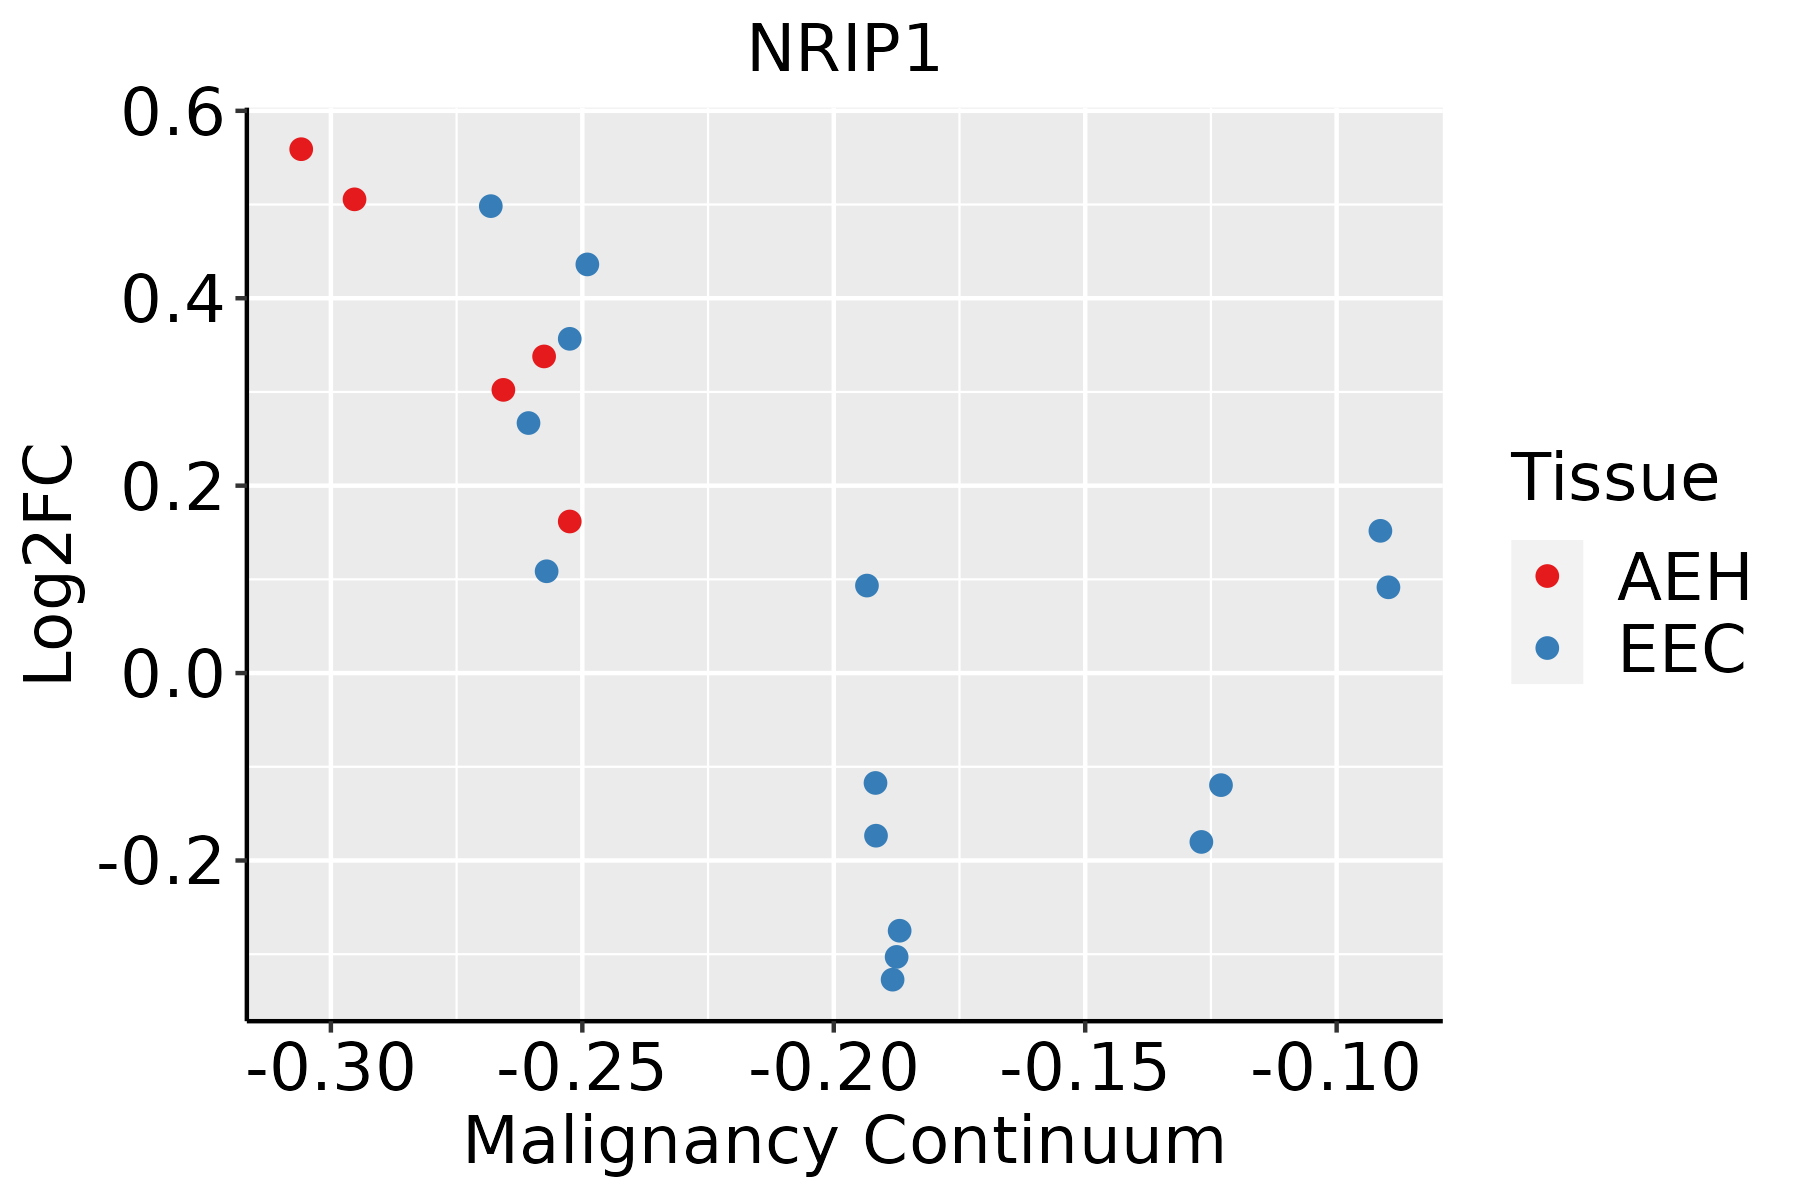 | AEH: Atypical endometrial hyperplasia |
| EEC: Endometrioid Cancer | ||
| Esophagus | 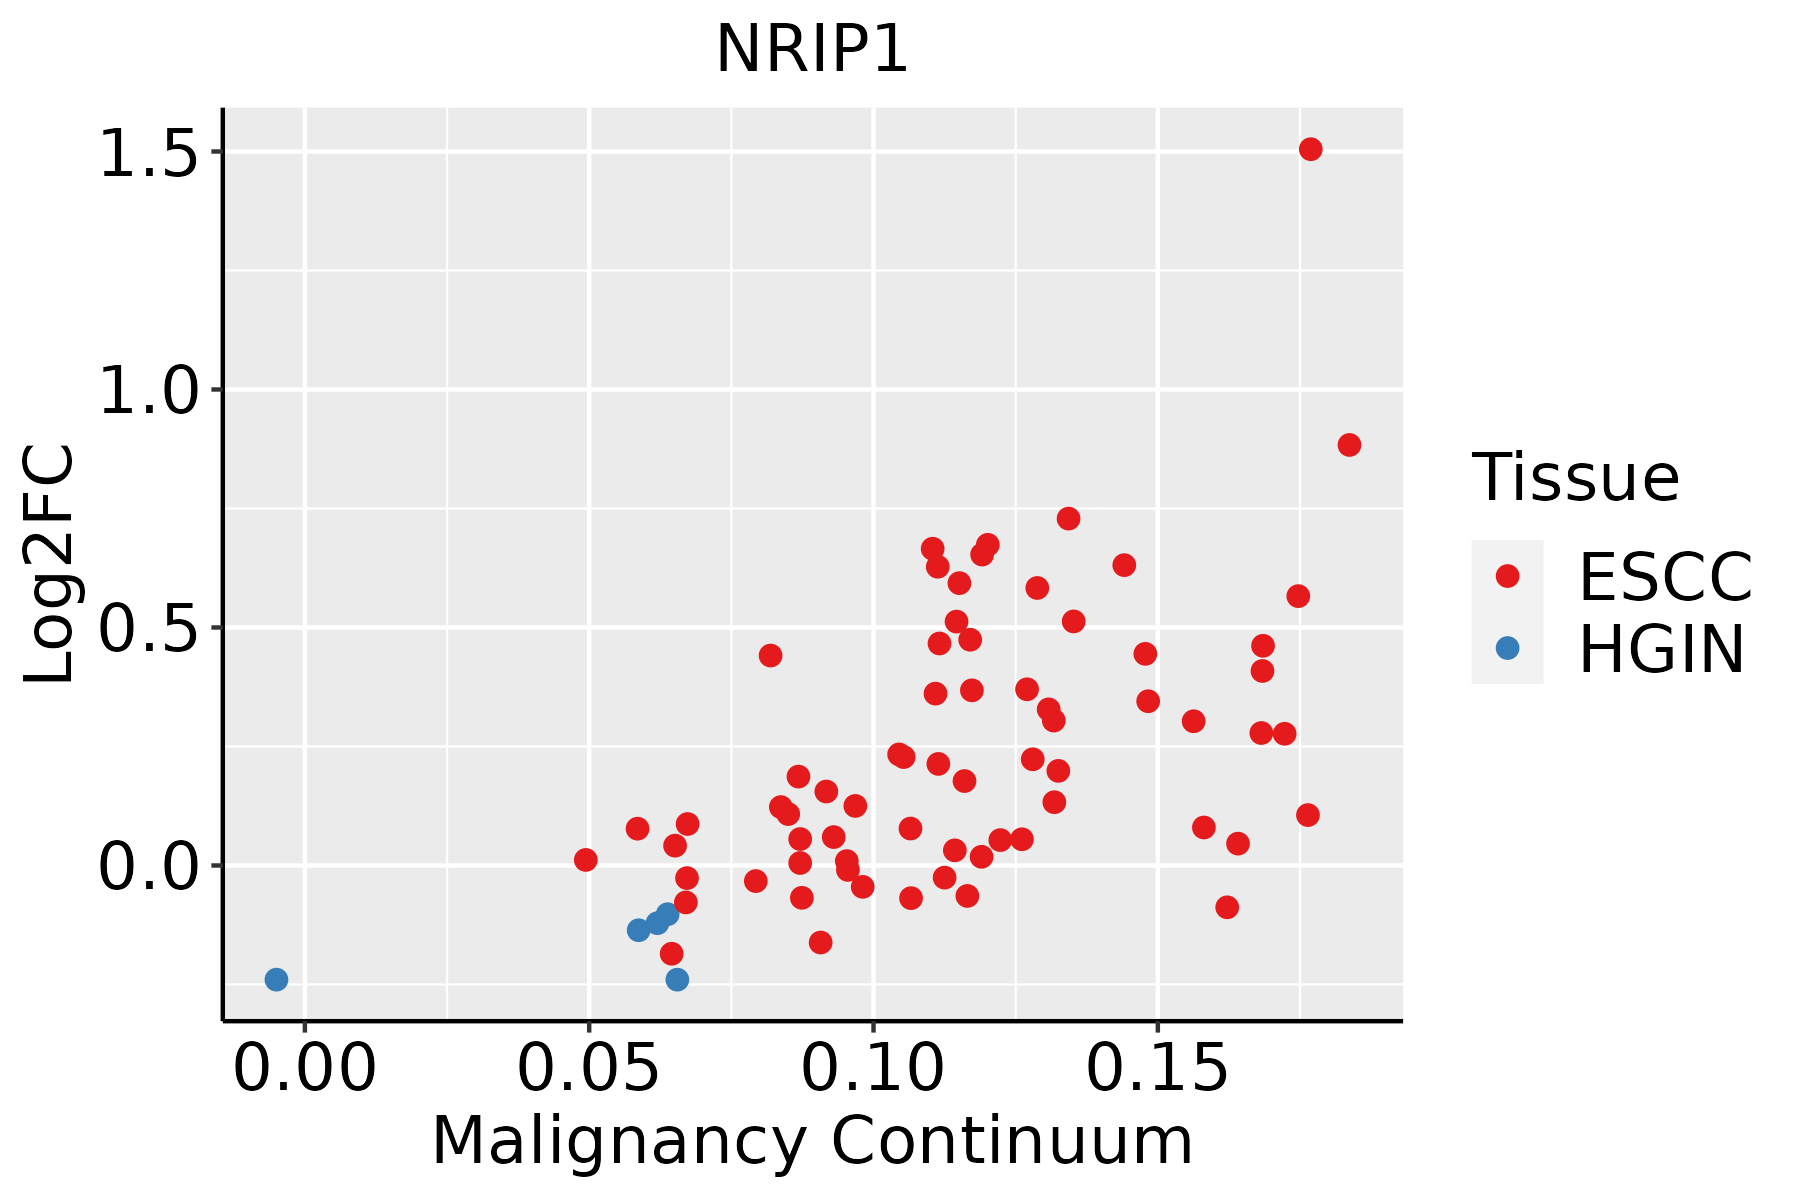 | ESCC: Esophageal squamous cell carcinoma |
| HGIN: High-grade intraepithelial neoplasias | ||
| LGIN: Low-grade intraepithelial neoplasias | ||
| Liver |  | HCC: Hepatocellular carcinoma |
| NAFLD: Non-alcoholic fatty liver disease | ||
| Lung | 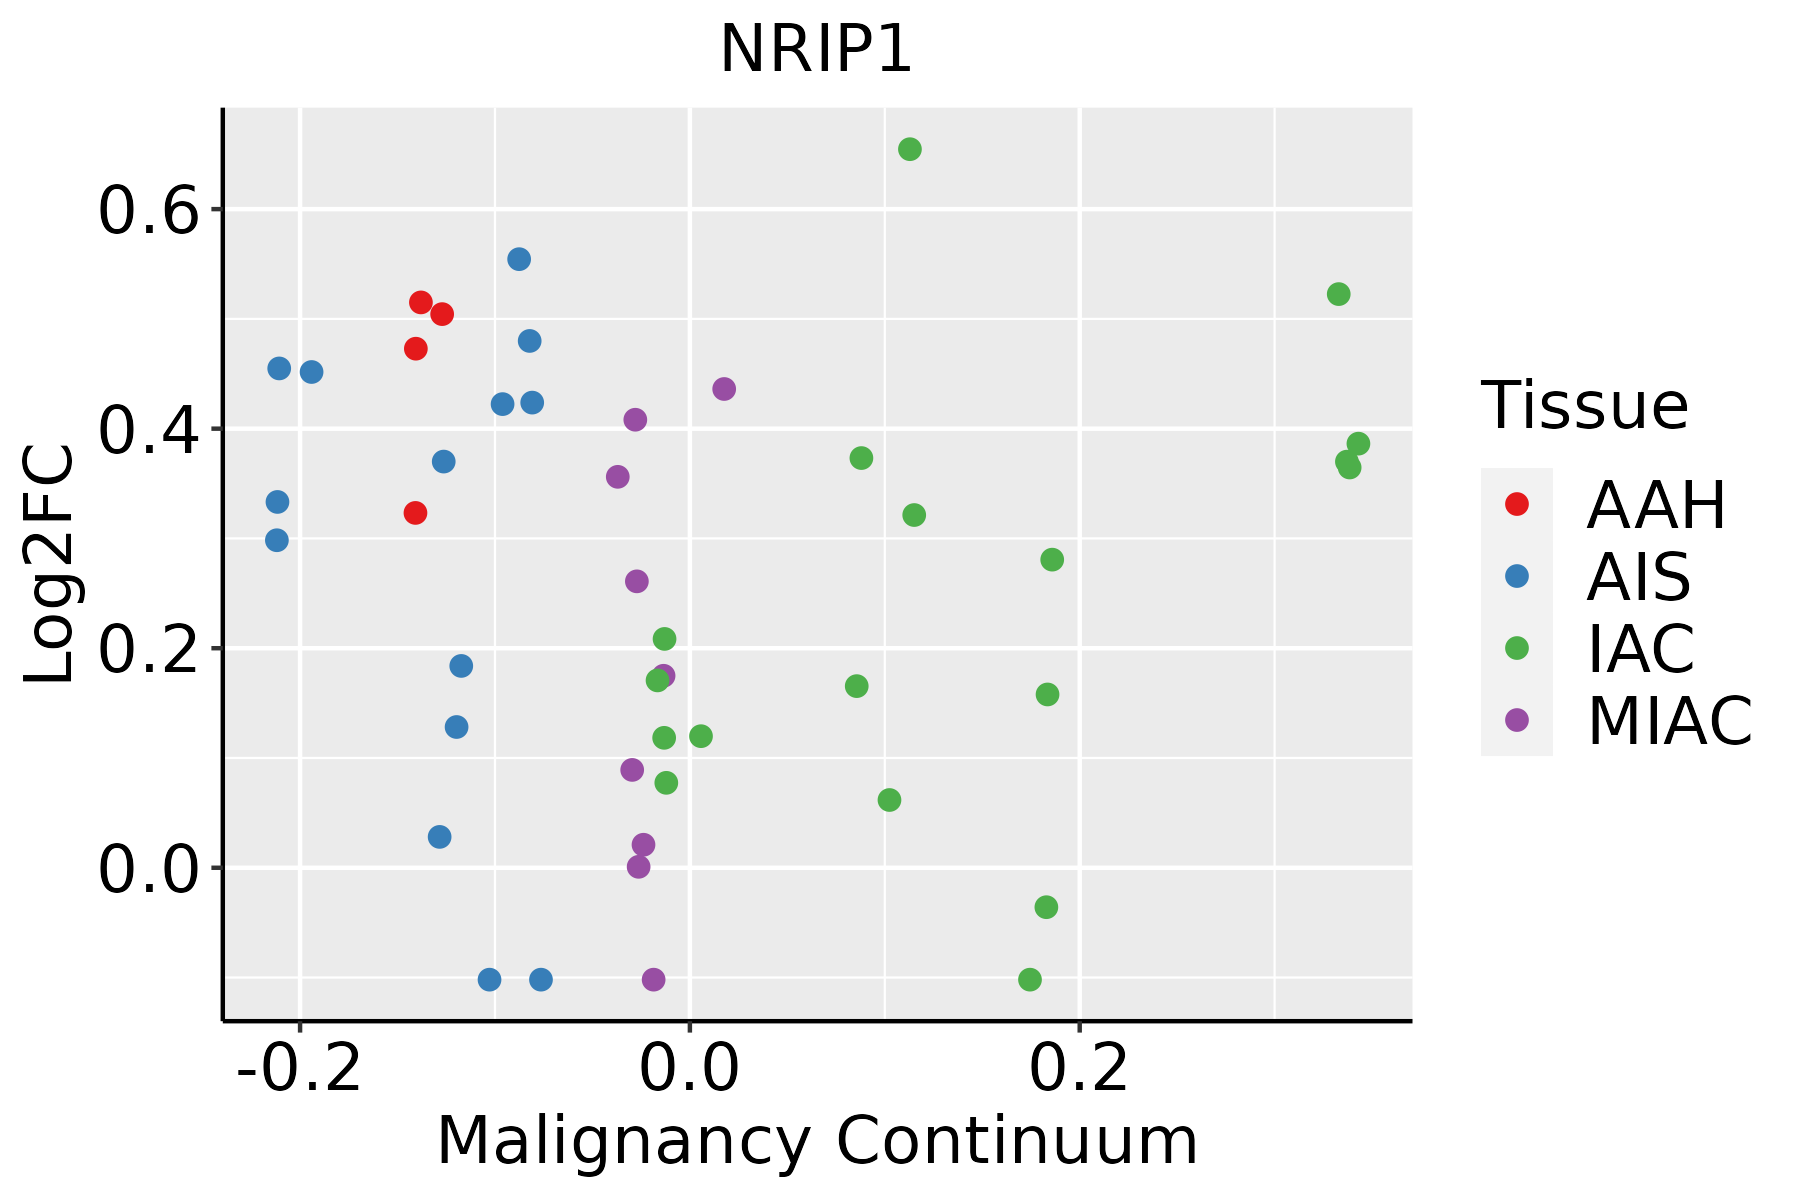 | AAH: Atypical adenomatous hyperplasia |
| AIS: Adenocarcinoma in situ | ||
| IAC: Invasive lung adenocarcinoma | ||
| MIA: Minimally invasive adenocarcinoma | ||
| Oral Cavity |  | EOLP: Erosive Oral lichen planus |
| LP: leukoplakia | ||
| NEOLP: Non-erosive oral lichen planus | ||
| OSCC: Oral squamous cell carcinoma | ||
| Prostate | 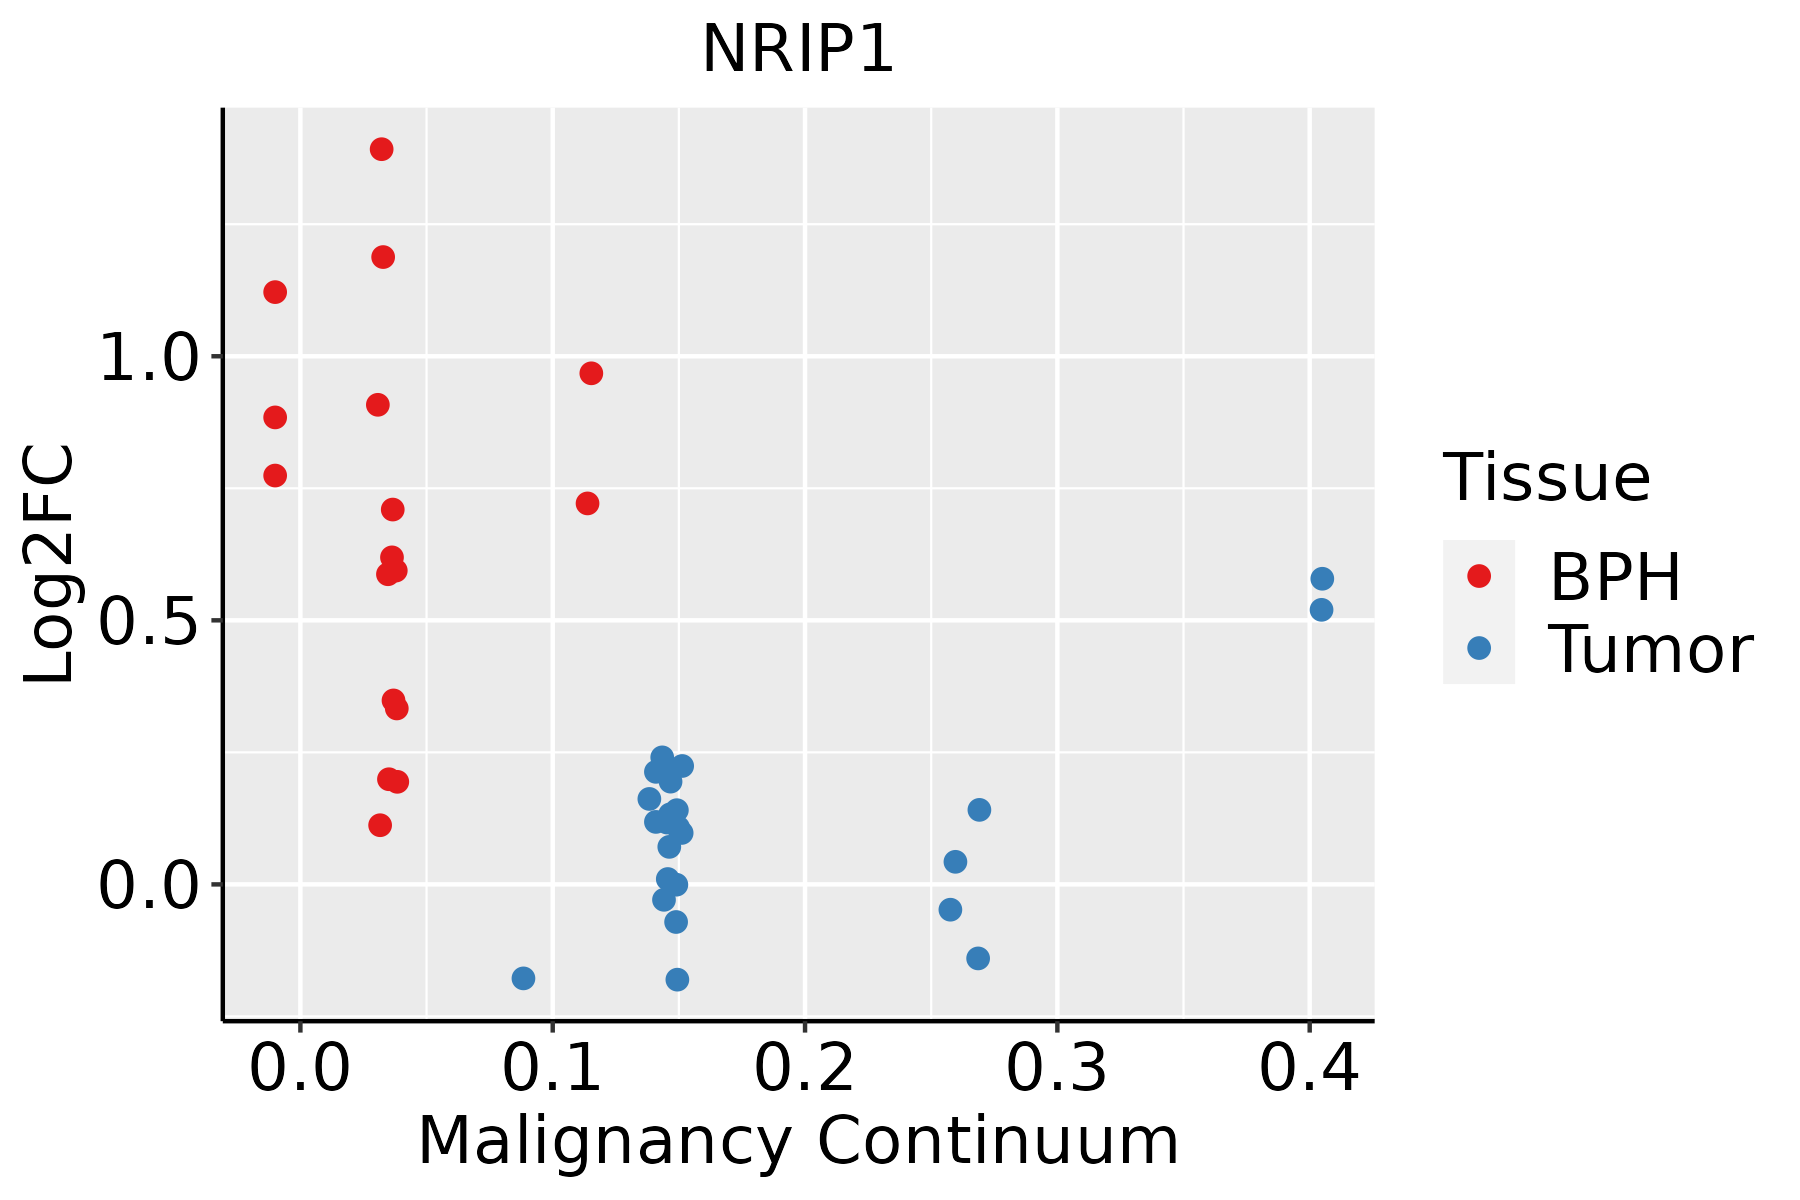 | BPH: Benign Prostatic Hyperplasia |
| Skin |  | AK: Actinic keratosis |
| cSCC: Cutaneous squamous cell carcinoma | ||
| SCCIS:squamous cell carcinoma in situ | ||
| Thyroid |  | ATC: Anaplastic thyroid cancer |
| HT: Hashimoto's thyroiditis | ||
| PTC: Papillary thyroid cancer |
| ∗log2FC in expression of this searched gene in stem-like cells from each diseased tissue sample relative to stem-like cells in normal samples in each tissue plotted against the malignancy continuum. Samples are colored based on if they are from different disease stage. |
Top |
Malignant transformation related pathway analysis |
| Find out the enriched GO biological processes and KEGG pathways involved in transition from healthy to precancer to cancer |
| Tissue | Disease Stage | Enriched GO biological Processes |
| Colorectum | AD |  |
| Colorectum | SER |  |
| Colorectum | MSS |  |
| Colorectum | MSI-H |  |
| Colorectum | FAP |  |
| ∗Top 15 enriched GO BP terms are showed in the bar plot of each disease state in each tissue. Each row represents a significant GO biological process which is colored according to the -log10(p.adjust). |
| Page: 1 2 3 4 5 6 7 8 9 |
| GO ID | Tissue | Disease Stage | Description | Gene Ratio | Bg Ratio | pvalue | p.adjust | Count |
| GO:004860812 | Breast | IDC | reproductive structure development | 60/1434 | 424/18723 | 2.71e-06 | 1.03e-04 | 60 |
| GO:006145813 | Breast | IDC | reproductive system development | 60/1434 | 427/18723 | 3.41e-06 | 1.24e-04 | 60 |
| GO:003235512 | Breast | IDC | response to estradiol | 27/1434 | 141/18723 | 7.87e-06 | 2.35e-04 | 27 |
| GO:005123513 | Breast | IDC | maintenance of location | 48/1434 | 327/18723 | 9.90e-06 | 2.77e-04 | 48 |
| GO:0008406 | Breast | IDC | gonad development | 32/1434 | 221/18723 | 3.64e-04 | 5.23e-03 | 32 |
| GO:0045137 | Breast | IDC | development of primary sexual characteristics | 32/1434 | 227/18723 | 5.85e-04 | 7.44e-03 | 32 |
| GO:00485117 | Breast | IDC | rhythmic process | 38/1434 | 298/18723 | 1.34e-03 | 1.39e-02 | 38 |
| GO:0007548 | Breast | IDC | sex differentiation | 35/1434 | 276/18723 | 2.23e-03 | 2.07e-02 | 35 |
| GO:004860821 | Breast | DCIS | reproductive structure development | 57/1390 | 424/18723 | 9.06e-06 | 2.45e-04 | 57 |
| GO:005123523 | Breast | DCIS | maintenance of location | 47/1390 | 327/18723 | 9.55e-06 | 2.56e-04 | 47 |
| GO:006145822 | Breast | DCIS | reproductive system development | 57/1390 | 427/18723 | 1.12e-05 | 2.92e-04 | 57 |
| GO:003235521 | Breast | DCIS | response to estradiol | 26/1390 | 141/18723 | 1.34e-05 | 3.33e-04 | 26 |
| GO:004851113 | Breast | DCIS | rhythmic process | 37/1390 | 298/18723 | 1.44e-03 | 1.47e-02 | 37 |
| GO:00084061 | Breast | DCIS | gonad development | 29/1390 | 221/18723 | 1.96e-03 | 1.84e-02 | 29 |
| GO:00451371 | Breast | DCIS | development of primary sexual characteristics | 29/1390 | 227/18723 | 2.93e-03 | 2.52e-02 | 29 |
| GO:00512359 | Cervix | CC | maintenance of location | 78/2311 | 327/18723 | 5.18e-09 | 4.92e-07 | 78 |
| GO:00614588 | Cervix | CC | reproductive system development | 87/2311 | 427/18723 | 1.37e-06 | 4.55e-05 | 87 |
| GO:00486088 | Cervix | CC | reproductive structure development | 86/2311 | 424/18723 | 1.90e-06 | 5.97e-05 | 86 |
| GO:00485118 | Cervix | CC | rhythmic process | 65/2311 | 298/18723 | 2.79e-06 | 8.04e-05 | 65 |
| GO:00076238 | Cervix | CC | circadian rhythm | 46/2311 | 210/18723 | 6.76e-05 | 9.60e-04 | 46 |
| Page: 1 2 3 4 5 6 7 8 9 10 11 |
| Pathway ID | Tissue | Disease Stage | Description | Gene Ratio | Bg Ratio | pvalue | p.adjust | qvalue | Count |
| Page: 1 |
Top |
Cell-cell communication analysis |
| Identification of potential cell-cell interactions between two cell types and their ligand-receptor pairs for different disease states |
| Ligand | Receptor | LRpair | Pathway | Tissue | Disease Stage |
| Page: 1 |
Top |
Single-cell gene regulatory network inference analysis |
| Find out the significant the regulons (TFs) and the target genes of each regulon across cell types for different disease states |
| TF | Cell Type | Tissue | Disease Stage | Target Gene | RSS | Regulon Activity |
| ∗The dot plots of a searched regulon are shown for all cell subpopulations in each disease state of each tissue based on the regulon specific score inferred using pySCENIC and by calculating the average expression. |
| Page: 1 |
Top |
Somatic mutation of malignant transformation related genes |
| Annotation of somatic variants for genes involved in malignant transformation |
| Hugo Symbol | Variant Class | Variant Classification | dbSNP RS | HGVSc | HGVSp | HGVSp Short | SWISSPROT | BIOTYPE | SIFT | PolyPhen | Tumor Sample Barcode | Tissue | Histology | Sex | Age | Stage | Therapy Types | Drugs | Outcome |
| NRIP1 | SNV | Missense_Mutation | c.459C>G | p.Ile153Met | p.I153M | P48552 | protein_coding | deleterious(0.01) | possibly_damaging(0.906) | TCGA-A1-A0SI-01 | Breast | breast invasive carcinoma | Female | <65 | I/II | Unknown | Unknown | SD | |
| NRIP1 | SNV | Missense_Mutation | c.430N>G | p.Leu144Val | p.L144V | P48552 | protein_coding | deleterious(0) | probably_damaging(0.997) | TCGA-A2-A0ET-01 | Breast | breast invasive carcinoma | Female | <65 | III/IV | Chemotherapy | cytoxan | SD | |
| NRIP1 | SNV | Missense_Mutation | novel | c.3365N>C | p.Arg1122Thr | p.R1122T | P48552 | protein_coding | deleterious(0.01) | possibly_damaging(0.73) | TCGA-A2-A3XT-01 | Breast | breast invasive carcinoma | Female | <65 | I/II | Chemotherapy | cyclophosphamide | PR |
| NRIP1 | SNV | Missense_Mutation | c.2275N>T | p.Pro759Ser | p.P759S | P48552 | protein_coding | deleterious(0.01) | probably_damaging(0.984) | TCGA-A8-A07P-01 | Breast | breast invasive carcinoma | Female | >=65 | I/II | Chemotherapy | 5-fluorouracil | SD | |
| NRIP1 | SNV | Missense_Mutation | c.997T>C | p.Ser333Pro | p.S333P | P48552 | protein_coding | tolerated(0.16) | benign(0.003) | TCGA-BH-A1FU-01 | Breast | breast invasive carcinoma | Female | <65 | I/II | Unknown | Unknown | PD | |
| NRIP1 | SNV | Missense_Mutation | c.3328N>T | p.Pro1110Ser | p.P1110S | P48552 | protein_coding | tolerated(0.3) | benign(0.009) | TCGA-C8-A275-01 | Breast | breast invasive carcinoma | Female | <65 | I/II | Unknown | Unknown | SD | |
| NRIP1 | SNV | Missense_Mutation | novel | c.61N>A | p.Leu21Ile | p.L21I | P48552 | protein_coding | deleterious(0.01) | probably_damaging(0.997) | TCGA-D8-A1XQ-01 | Breast | breast invasive carcinoma | Female | >=65 | I/II | Unknown | Unknown | SD |
| NRIP1 | SNV | Missense_Mutation | c.2875G>A | p.Asp959Asn | p.D959N | P48552 | protein_coding | tolerated(0.28) | benign(0.005) | TCGA-EW-A1IZ-01 | Breast | breast invasive carcinoma | Female | <65 | III/IV | Chemotherapy | taxotere | SD | |
| NRIP1 | deletion | Frame_Shift_Del | novel | c.2429delA | p.Asp810ValfsTer10 | p.D810Vfs*10 | P48552 | protein_coding | TCGA-AO-A128-01 | Breast | breast invasive carcinoma | Female | <65 | I/II | Chemotherapy | doxorubicin | SD | ||
| NRIP1 | insertion | Frame_Shift_Ins | novel | c.2427_2428insTTTGGTAAGTGGCCCT | p.Asp810PhefsTer6 | p.D810Ffs*6 | P48552 | protein_coding | TCGA-AO-A128-01 | Breast | breast invasive carcinoma | Female | <65 | I/II | Chemotherapy | doxorubicin | SD |
| Page: 1 2 3 4 5 6 7 8 9 10 11 12 13 14 15 |
Top |
Related drugs of malignant transformation related genes |
| Identification of chemicals and drugs interact with genes involved in malignant transfromation |
| (DGIdb 4.0) |
| Entrez ID | Symbol | Category | Interaction Types | Drug Claim Name | Drug Name | PMIDs |
| 8204 | NRIP1 | NUCLEAR HORMONE RECEPTOR | RETINOIC ACID | 15632153,14581481 | ||
| 8204 | NRIP1 | NUCLEAR HORMONE RECEPTOR | RETINOIDS | 15180561 |
| Page: 1 |

Copyright 2023-Present -The University of Texas Health Science Center at Houston |