
|
|||||
|
 | |
| |
| |
| |
| |
| |
|
Gene: NRF1 |
Gene summary for NRF1 |
| Gene information | Species | Human | Gene symbol | NRF1 | Gene ID | 4899 |
| Gene name | nuclear respiratory factor 1 | |
| Gene Alias | ALPHA-PAL | |
| Cytomap | 7q32.2 | |
| Gene Type | protein-coding | GO ID | GO:0006139 | UniProtAcc | A0A024R770 |
Top |
Malignant transformation analysis |
| Identification of the aberrant gene expression in precancerous and cancerous lesions by comparing the gene expression of stem-like cells in diseased tissues with normal stem cells |
| Entrez ID | Symbol | Replicates | Species | Organ | Tissue | Adj P-value | Log2FC | Malignancy |
| 4899 | NRF1 | HTA11_3410_2000001011 | Human | Colorectum | AD | 6.89e-06 | -3.94e-01 | 0.0155 |
| 4899 | NRF1 | HTA11_7696_3000711011 | Human | Colorectum | AD | 4.85e-05 | -2.88e-01 | 0.0674 |
| 4899 | NRF1 | HTA11_99999970781_79442 | Human | Colorectum | MSS | 2.21e-05 | -2.85e-01 | 0.294 |
| 4899 | NRF1 | HTA11_99999974143_84620 | Human | Colorectum | MSS | 5.83e-07 | -3.36e-01 | 0.3005 |
| 4899 | NRF1 | A001-C-207 | Human | Colorectum | FAP | 1.18e-04 | -3.13e-01 | 0.1278 |
| 4899 | NRF1 | A015-C-203 | Human | Colorectum | FAP | 8.20e-28 | -4.19e-01 | -0.1294 |
| 4899 | NRF1 | A015-C-204 | Human | Colorectum | FAP | 6.75e-05 | -3.28e-01 | -0.0228 |
| 4899 | NRF1 | A014-C-040 | Human | Colorectum | FAP | 3.67e-02 | -3.29e-01 | -0.1184 |
| 4899 | NRF1 | A002-C-201 | Human | Colorectum | FAP | 7.72e-09 | -2.48e-01 | 0.0324 |
| 4899 | NRF1 | A002-C-203 | Human | Colorectum | FAP | 2.05e-02 | -6.55e-02 | 0.2786 |
| 4899 | NRF1 | A001-C-119 | Human | Colorectum | FAP | 8.73e-05 | -3.36e-01 | -0.1557 |
| 4899 | NRF1 | A001-C-108 | Human | Colorectum | FAP | 7.33e-19 | -4.05e-01 | -0.0272 |
| 4899 | NRF1 | A002-C-205 | Human | Colorectum | FAP | 4.26e-16 | -4.04e-01 | -0.1236 |
| 4899 | NRF1 | A001-C-104 | Human | Colorectum | FAP | 1.79e-04 | -2.65e-01 | 0.0184 |
| 4899 | NRF1 | A015-C-005 | Human | Colorectum | FAP | 9.87e-03 | -2.33e-01 | -0.0336 |
| 4899 | NRF1 | A015-C-006 | Human | Colorectum | FAP | 8.41e-13 | -4.83e-01 | -0.0994 |
| 4899 | NRF1 | A015-C-106 | Human | Colorectum | FAP | 3.12e-17 | -3.65e-01 | -0.0511 |
| 4899 | NRF1 | A002-C-114 | Human | Colorectum | FAP | 3.72e-12 | -3.13e-01 | -0.1561 |
| 4899 | NRF1 | A015-C-104 | Human | Colorectum | FAP | 1.30e-29 | -4.70e-01 | -0.1899 |
| 4899 | NRF1 | A001-C-014 | Human | Colorectum | FAP | 2.32e-14 | -3.21e-01 | 0.0135 |
| Page: 1 2 3 |
| Tissue | Expression Dynamics | Abbreviation |
| Colorectum (GSE201348) |  | FAP: Familial adenomatous polyposis |
| CRC: Colorectal cancer | ||
| Colorectum (HTA11) |  | AD: Adenomas |
| SER: Sessile serrated lesions | ||
| MSI-H: Microsatellite-high colorectal cancer | ||
| MSS: Microsatellite stable colorectal cancer | ||
| Lung | 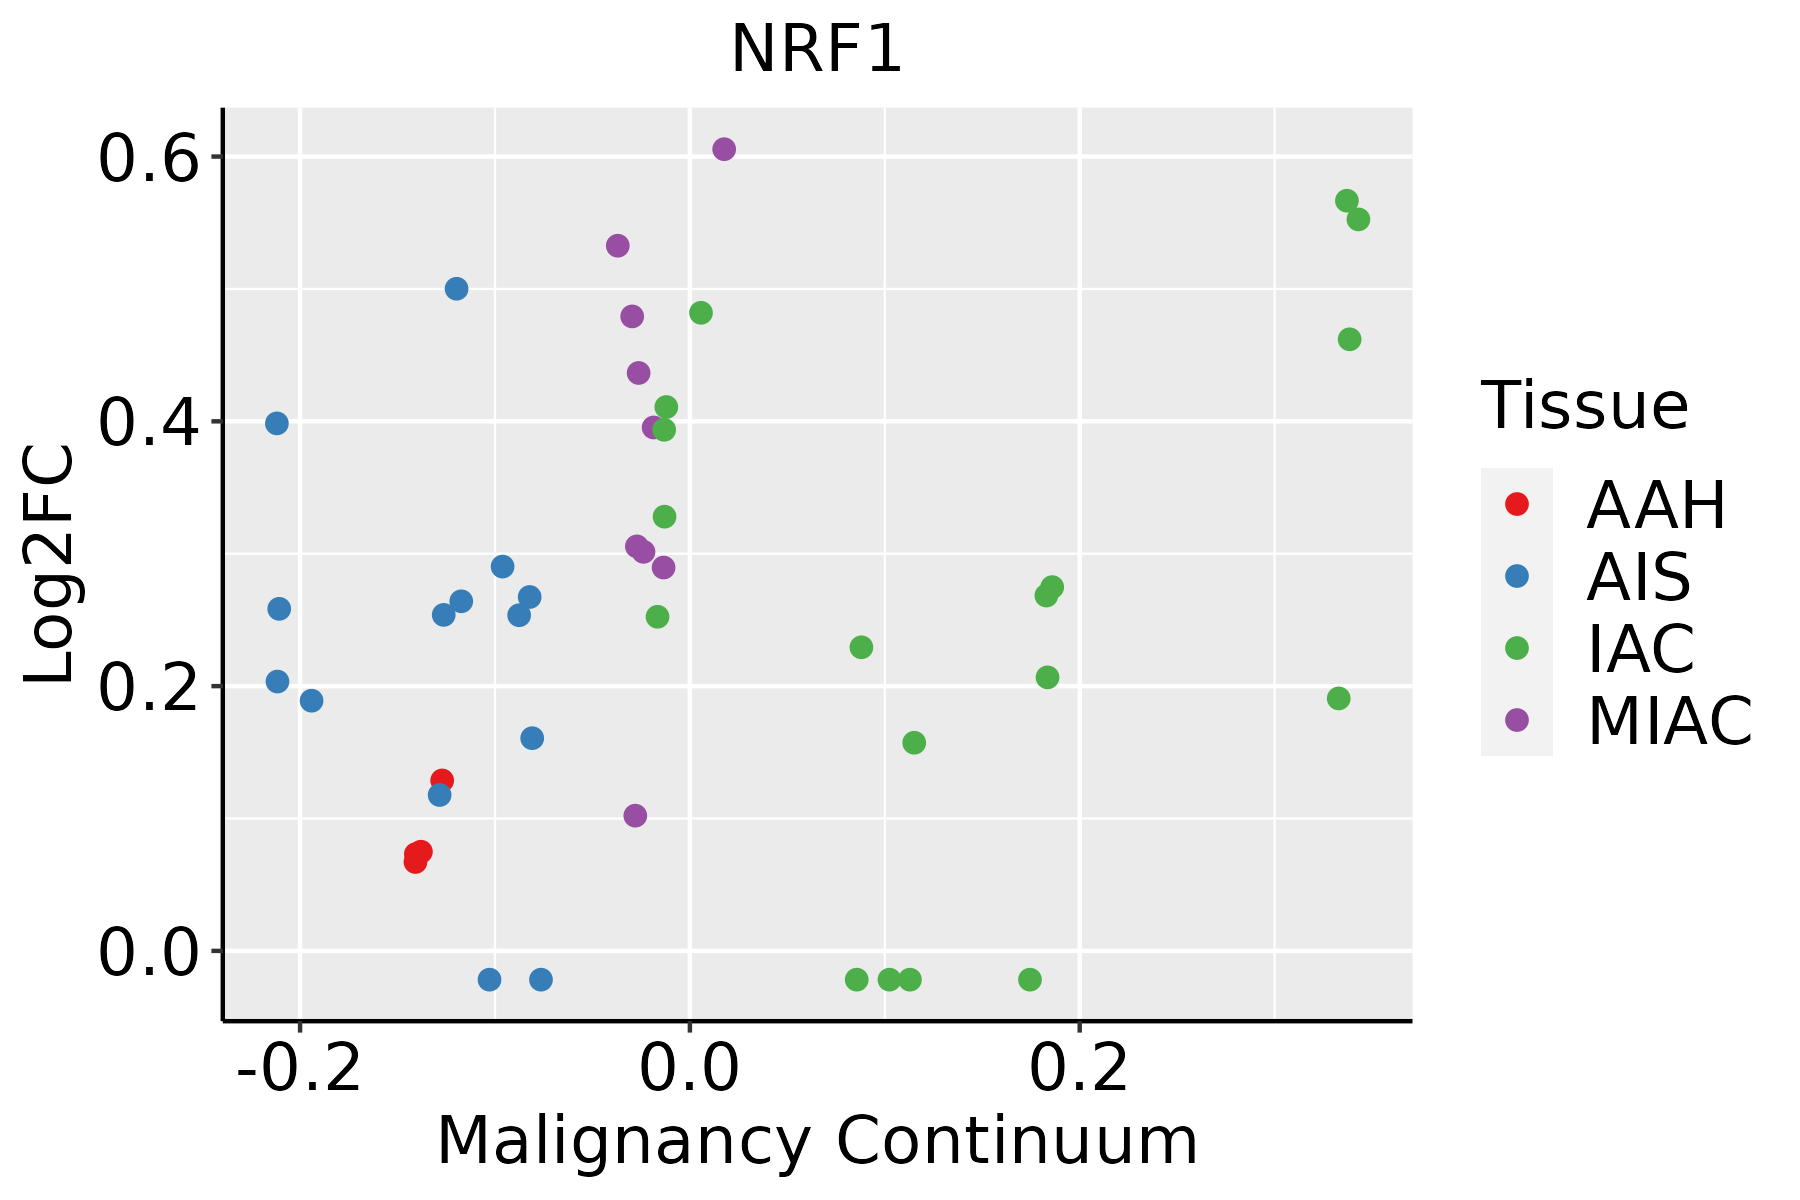 | AAH: Atypical adenomatous hyperplasia |
| AIS: Adenocarcinoma in situ | ||
| IAC: Invasive lung adenocarcinoma | ||
| MIA: Minimally invasive adenocarcinoma |
| ∗log2FC in expression of this searched gene in stem-like cells from each diseased tissue sample relative to stem-like cells in normal samples in each tissue plotted against the malignancy continuum. Samples are colored based on if they are from different disease stage. |
Top |
Malignant transformation related pathway analysis |
| Find out the enriched GO biological processes and KEGG pathways involved in transition from healthy to precancer to cancer |
| Tissue | Disease Stage | Enriched GO biological Processes |
| Colorectum | AD |  |
| Colorectum | SER |  |
| Colorectum | MSS |  |
| Colorectum | MSI-H |  |
| Colorectum | FAP |  |
| ∗Top 15 enriched GO BP terms are showed in the bar plot of each disease state in each tissue. Each row represents a significant GO biological process which is colored according to the -log10(p.adjust). |
| Page: 1 2 3 4 5 6 7 8 9 |
| GO ID | Tissue | Disease Stage | Description | Gene Ratio | Bg Ratio | pvalue | p.adjust | Count |
| GO:001049817 | Endometrium | EEC | proteasomal protein catabolic process | 112/2168 | 490/18723 | 6.99e-13 | 1.40e-10 | 112 |
| GO:004316117 | Endometrium | EEC | proteasome-mediated ubiquitin-dependent protein catabolic process | 92/2168 | 412/18723 | 3.01e-10 | 3.23e-08 | 92 |
| GO:007093614 | Endometrium | EEC | protein K48-linked ubiquitination | 22/2168 | 65/18723 | 1.92e-06 | 5.79e-05 | 22 |
| GO:000020913 | Endometrium | EEC | protein polyubiquitination | 46/2168 | 236/18723 | 2.65e-04 | 3.04e-03 | 46 |
| GO:0010498111 | Esophagus | ESCC | proteasomal protein catabolic process | 369/8552 | 490/18723 | 1.13e-41 | 1.80e-38 | 369 |
| GO:0043161111 | Esophagus | ESCC | proteasome-mediated ubiquitin-dependent protein catabolic process | 312/8552 | 412/18723 | 3.53e-36 | 4.48e-33 | 312 |
| GO:000020917 | Esophagus | ESCC | protein polyubiquitination | 170/8552 | 236/18723 | 1.40e-16 | 1.09e-14 | 170 |
| GO:007093617 | Esophagus | ESCC | protein K48-linked ubiquitination | 55/8552 | 65/18723 | 8.42e-11 | 2.58e-09 | 55 |
| GO:001049820 | Oral cavity | OSCC | proteasomal protein catabolic process | 336/7305 | 490/18723 | 5.45e-41 | 8.63e-38 | 336 |
| GO:004316120 | Oral cavity | OSCC | proteasome-mediated ubiquitin-dependent protein catabolic process | 285/7305 | 412/18723 | 5.68e-36 | 5.99e-33 | 285 |
| GO:000020910 | Oral cavity | OSCC | protein polyubiquitination | 150/7305 | 236/18723 | 1.59e-14 | 9.27e-13 | 150 |
| GO:00709369 | Oral cavity | OSCC | protein K48-linked ubiquitination | 53/7305 | 65/18723 | 2.47e-12 | 1.02e-10 | 53 |
| GO:0010498110 | Oral cavity | LP | proteasomal protein catabolic process | 224/4623 | 490/18723 | 9.57e-25 | 4.00e-22 | 224 |
| GO:0043161110 | Oral cavity | LP | proteasome-mediated ubiquitin-dependent protein catabolic process | 190/4623 | 412/18723 | 1.08e-21 | 2.93e-19 | 190 |
| GO:007093616 | Oral cavity | LP | protein K48-linked ubiquitination | 32/4623 | 65/18723 | 1.61e-05 | 2.81e-04 | 32 |
| GO:000020915 | Oral cavity | LP | protein polyubiquitination | 82/4623 | 236/18723 | 3.23e-04 | 3.26e-03 | 82 |
| GO:007093622 | Oral cavity | EOLP | protein K48-linked ubiquitination | 31/2218 | 65/18723 | 9.08e-13 | 2.27e-10 | 31 |
| GO:001049825 | Oral cavity | EOLP | proteasomal protein catabolic process | 108/2218 | 490/18723 | 7.79e-11 | 9.51e-09 | 108 |
| GO:000020923 | Oral cavity | EOLP | protein polyubiquitination | 62/2218 | 236/18723 | 7.88e-10 | 5.90e-08 | 62 |
| GO:004316125 | Oral cavity | EOLP | proteasome-mediated ubiquitin-dependent protein catabolic process | 92/2218 | 412/18723 | 9.87e-10 | 6.96e-08 | 92 |
| Page: 1 2 |
| Pathway ID | Tissue | Disease Stage | Description | Gene Ratio | Bg Ratio | pvalue | p.adjust | qvalue | Count |
| hsa05016 | Colorectum | AD | Huntington disease | 147/2092 | 306/8465 | 1.93e-19 | 9.26e-18 | 5.91e-18 | 147 |
| hsa050161 | Colorectum | AD | Huntington disease | 147/2092 | 306/8465 | 1.93e-19 | 9.26e-18 | 5.91e-18 | 147 |
| hsa050164 | Colorectum | MSS | Huntington disease | 141/1875 | 306/8465 | 2.90e-21 | 1.62e-19 | 9.92e-20 | 141 |
| hsa050165 | Colorectum | MSS | Huntington disease | 141/1875 | 306/8465 | 2.90e-21 | 1.62e-19 | 9.92e-20 | 141 |
| hsa050168 | Colorectum | FAP | Huntington disease | 73/1404 | 306/8465 | 5.54e-04 | 3.93e-03 | 2.39e-03 | 73 |
| hsa050169 | Colorectum | FAP | Huntington disease | 73/1404 | 306/8465 | 5.54e-04 | 3.93e-03 | 2.39e-03 | 73 |
| Page: 1 |
Top |
Cell-cell communication analysis |
| Identification of potential cell-cell interactions between two cell types and their ligand-receptor pairs for different disease states |
| Ligand | Receptor | LRpair | Pathway | Tissue | Disease Stage |
| Page: 1 |
Top |
Single-cell gene regulatory network inference analysis |
| Find out the significant the regulons (TFs) and the target genes of each regulon across cell types for different disease states |
| TF | Cell Type | Tissue | Disease Stage | Target Gene | RSS | Regulon Activity |
| ∗The dot plots of a searched regulon are shown for all cell subpopulations in each disease state of each tissue based on the regulon specific score inferred using pySCENIC and by calculating the average expression. |
| Page: 1 |
Top |
Somatic mutation of malignant transformation related genes |
| Annotation of somatic variants for genes involved in malignant transformation |
| Hugo Symbol | Variant Class | Variant Classification | dbSNP RS | HGVSc | HGVSp | HGVSp Short | SWISSPROT | BIOTYPE | SIFT | PolyPhen | Tumor Sample Barcode | Tissue | Histology | Sex | Age | Stage | Therapy Types | Drugs | Outcome |
| NRF1 | SNV | Missense_Mutation | c.62N>T | p.Ala21Val | p.A21V | Q16656 | protein_coding | tolerated_low_confidence(0.1) | benign(0.086) | TCGA-AN-A0XN-01 | Breast | breast invasive carcinoma | Female | >=65 | III/IV | Unknown | Unknown | SD | |
| NRF1 | SNV | Missense_Mutation | novel | c.982G>T | p.Val328Leu | p.V328L | Q16656 | protein_coding | tolerated(0.08) | benign(0.031) | TCGA-BH-A0BR-01 | Breast | breast invasive carcinoma | Female | <65 | I/II | Unknown | Unknown | SD |
| NRF1 | SNV | Missense_Mutation | c.742N>A | p.Arg248Ser | p.R248S | Q16656 | protein_coding | deleterious(0) | probably_damaging(1) | TCGA-GM-A2DD-01 | Breast | breast invasive carcinoma | Female | <65 | I/II | Chemotherapy | fluorouracil | CR | |
| NRF1 | insertion | Frame_Shift_Ins | novel | c.1214_1215insAATAAAAGAGAAAATAGGCACAGTTGTAGACCCTTTG | p.Leu406IlefsTer14 | p.L406Ifs*14 | Q16656 | protein_coding | TCGA-AN-A0FX-01 | Breast | breast invasive carcinoma | Female | <65 | I/II | Unknown | Unknown | SD | ||
| NRF1 | SNV | Missense_Mutation | novel | c.989N>T | p.Thr330Ile | p.T330I | Q16656 | protein_coding | tolerated(0.05) | benign(0.231) | TCGA-EA-A410-01 | Cervix | cervical & endocervical cancer | Female | <65 | I/II | Unknown | Unknown | SD |
| NRF1 | SNV | Missense_Mutation | c.1561N>C | p.Glu521Gln | p.E521Q | Q16656 | protein_coding | deleterious_low_confidence(0.03) | benign(0.39) | TCGA-FU-A23L-01 | Cervix | cervical & endocervical cancer | Female | <65 | I/II | Chemotherapy | cisplatin | CR | |
| NRF1 | SNV | Missense_Mutation | novel | c.870N>C | p.Gln290His | p.Q290H | Q16656 | protein_coding | deleterious(0.04) | benign(0) | TCGA-VS-A8EJ-01 | Cervix | cervical & endocervical cancer | Female | <65 | I/II | Chemotherapy | cisplatin | PD |
| NRF1 | SNV | Missense_Mutation | novel | c.388G>T | p.Ala130Ser | p.A130S | Q16656 | protein_coding | deleterious(0.02) | possibly_damaging(0.7) | TCGA-AA-3977-01 | Colorectum | colon adenocarcinoma | Male | >=65 | I/II | Unknown | Unknown | SD |
| NRF1 | SNV | Missense_Mutation | rs764173748 | c.1225G>A | p.Glu409Lys | p.E409K | Q16656 | protein_coding | tolerated(0.07) | possibly_damaging(0.603) | TCGA-AA-3977-01 | Colorectum | colon adenocarcinoma | Male | >=65 | I/II | Unknown | Unknown | SD |
| NRF1 | SNV | Missense_Mutation | c.28N>A | p.Glu10Lys | p.E10K | Q16656 | protein_coding | deleterious_low_confidence(0) | benign(0.024) | TCGA-AA-A010-01 | Colorectum | colon adenocarcinoma | Female | <65 | I/II | Chemotherapy | folinic | CR |
| Page: 1 2 3 4 5 6 |
Top |
Related drugs of malignant transformation related genes |
| Identification of chemicals and drugs interact with genes involved in malignant transfromation |
| (DGIdb 4.0) |
| Entrez ID | Symbol | Category | Interaction Types | Drug Claim Name | Drug Name | PMIDs |
| Page: 1 |

Copyright 2023-Present -The University of Texas Health Science Center at Houston |