Schematic overview of the cellular and molecular mechanisms involved in the cancer progression, including the proposed cellular and molecular mechanisms in cancer cells trajectory. AT1: alveolar type 1 cells; AT2: alveolar type 2 cells; AAH: atypical adenomatous hyperplasia; AIS: adenocarcinoma in situ; MIA: minimally invasive adenocarcinoma; IA: invasive adenocarcinoma; EMT: epithelial-mesenchymal transition

Home

Download

Statistics

Help

Contact

Center for Computational Systems Medicine
leaf

Gene summary

leaf

Malignant transformation analysis

leaf

Malignant transformation related pathway analysis

leaf

Cell-cell communication analysis

leaf

Single-cell gene regulatory network inference analysis

leaf

Somatic mutation of malignant transformation related genes

leaf

Related drugs of malignant transformation related genes

Gene: NREP

Gene summary for NREP

check button Gene summary.

Gene informationSpeciesHuman
Gene symbol

NREP

Gene ID

9315

Gene nameneuronal regeneration related protein
Gene AliasC5orf13
Cytomap5q22.1
Gene Typeprotein-coding
GO ID

GO:0006950

UniProtAcc

Q16612


Top

Malignant transformation analysis

check button Identification of the aberrant gene expression in precancerous and cancerous lesions by comparing the gene expression of stem-like cells in diseased tissues with normal stem cells
check button Malignant transformation involving gene list.
Entrez IDSymbolReplicatesSpeciesOrganTissueAdj P-valueLog2FCMalignancy
9315NREPAEH-subject1HumanEndometriumAEH1.23e-12-4.85e-01-0.3059
9315NREPAEH-subject2HumanEndometriumAEH1.02e-23-5.22e-01-0.2525
9315NREPAEH-subject3HumanEndometriumAEH6.33e-17-4.91e-01-0.2576
9315NREPAEH-subject4HumanEndometriumAEH2.25e-03-2.19e-01-0.2657
9315NREPAEH-subject5HumanEndometriumAEH1.74e-15-5.40e-01-0.2953
9315NREPEEC-subject1HumanEndometriumEEC9.63e-15-4.78e-01-0.2682
9315NREPEEC-subject2HumanEndometriumEEC1.97e-20-5.34e-01-0.2607
9315NREPEEC-subject3HumanEndometriumEEC2.00e-28-5.51e-01-0.2525
9315NREPEEC-subject4HumanEndometriumEEC2.20e-27-5.83e-01-0.2571
9315NREPEEC-subject5HumanEndometriumEEC3.93e-16-5.17e-01-0.249
9315NREPGSM5276934HumanEndometriumEEC1.04e-27-5.94e-01-0.0913
9315NREPGSM5276937HumanEndometriumEEC5.91e-23-5.40e-01-0.0897
9315NREPGSM6177620_NYU_UCEC1_lib1_lib1HumanEndometriumEEC5.06e-23-4.03e-01-0.1869
9315NREPGSM6177620_NYU_UCEC1_lib2_lib2HumanEndometriumEEC3.82e-21-4.35e-01-0.1875
9315NREPGSM6177620_NYU_UCEC1_lib3_lib3HumanEndometriumEEC5.64e-22-2.99e-01-0.1883
9315NREPGSM6177621_NYU_UCEC2_lib1_lib1HumanEndometriumEEC3.88e-17-4.20e-01-0.1934
9315NREPGSM6177622_NYU_UCEC3_lib1_lib1HumanEndometriumEEC1.11e-22-3.67e-01-0.1917
9315NREPGSM6177622_NYU_UCEC3_lib2_lib2HumanEndometriumEEC1.04e-37-3.88e-01-0.1916
9315NREPLZE7THumanEsophagusESCC1.64e-026.10e-010.0667
9315NREPLZE8THumanEsophagusESCC3.01e-028.46e-030.067
Page: 1 2 3 4 5 

check button Transcriptomic changes along malignancy continuum.
TissueExpression DynamicsAbbreviation
EndometriumThe image shows the transcriptomic changes along malignancy continuum.log2FC in expression of this searched gene in stem-like cells from each diseased tissue sample relative to stem-like cells in normal samples in each tissue plotted against the malignancy continuum. Samples are colored based on if they are from different disease stage.AEH: Atypical endometrial hyperplasia
EEC: Endometrioid Cancer
EsophagusThe image shows the transcriptomic changes along malignancy continuum.log2FC in expression of this searched gene in stem-like cells from each diseased tissue sample relative to stem-like cells in normal samples in each tissue plotted against the malignancy continuum. Samples are colored based on if they are from different disease stage.
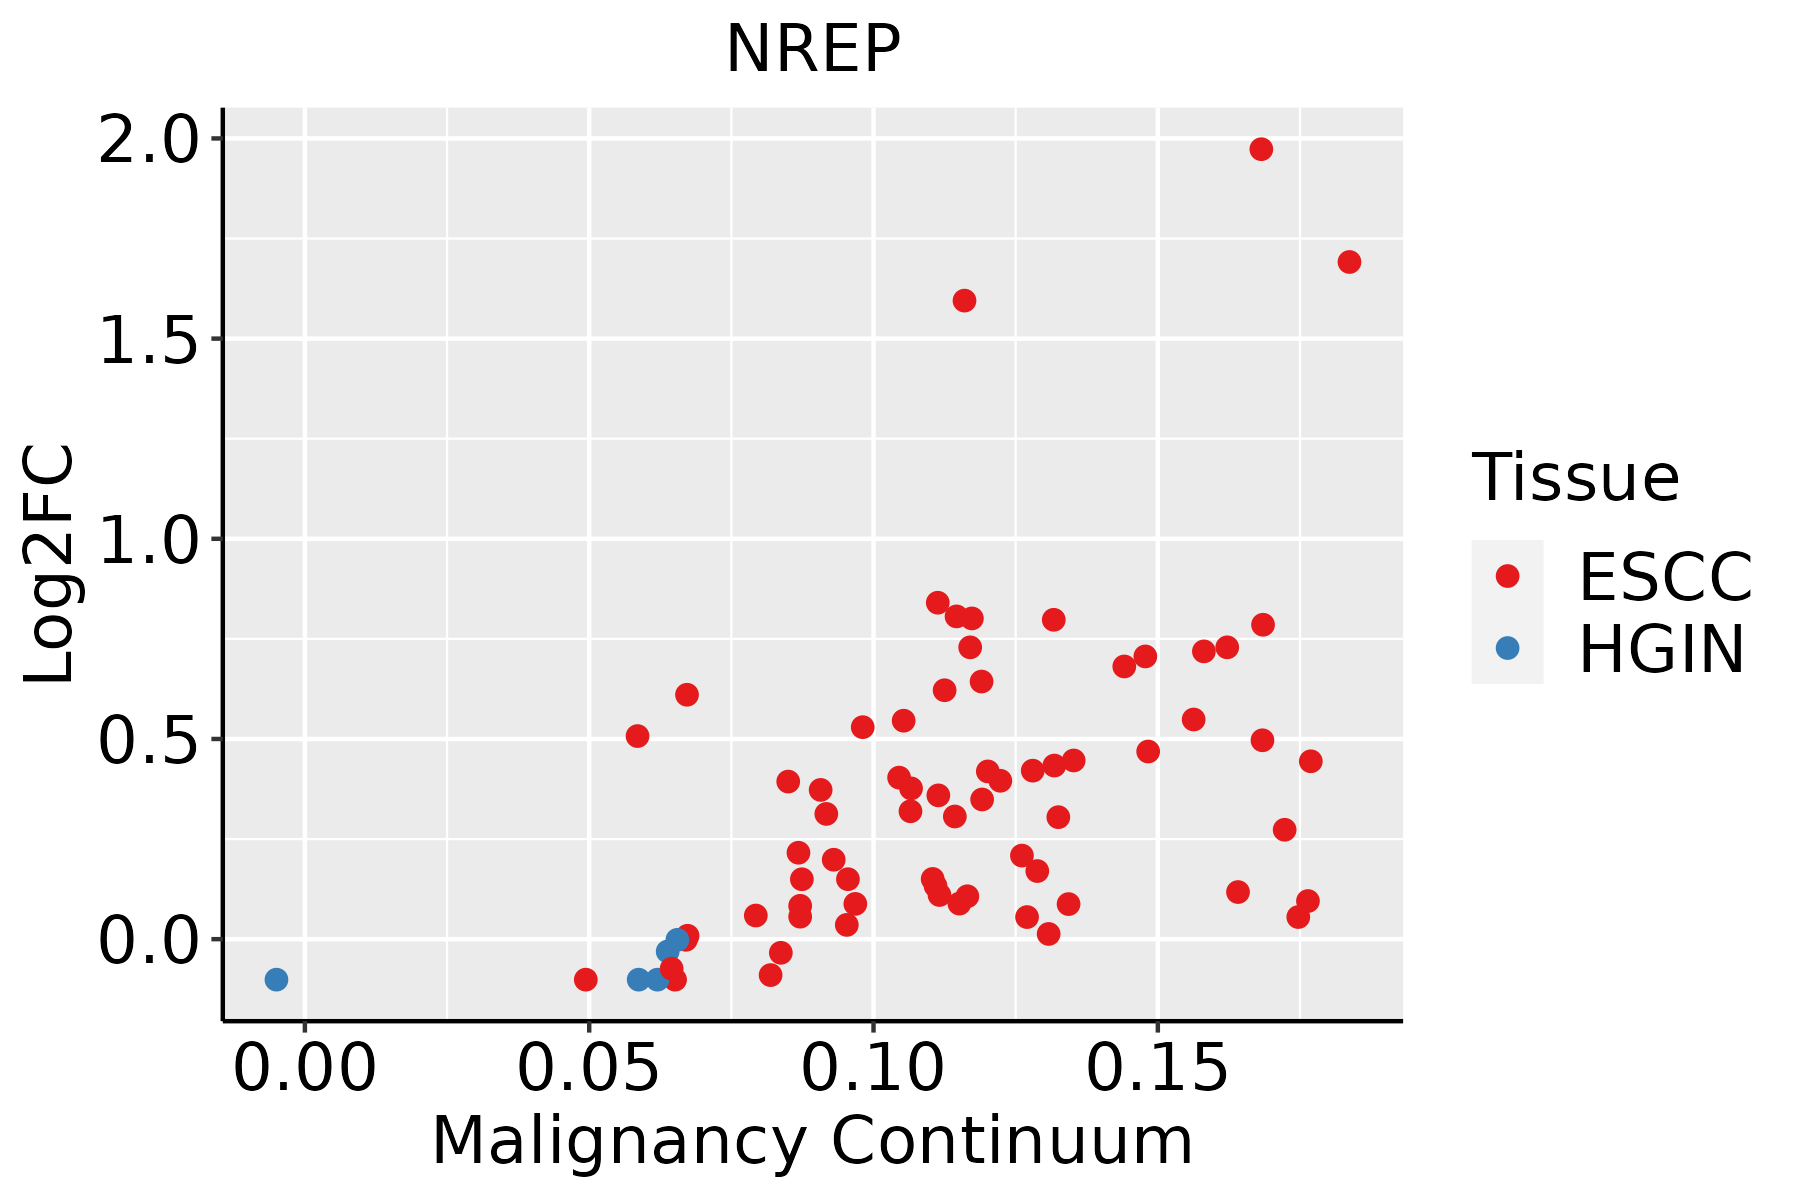
ESCC: Esophageal squamous cell carcinoma
HGIN: High-grade intraepithelial neoplasias
LGIN: Low-grade intraepithelial neoplasias
LiverThe image shows the transcriptomic changes along malignancy continuum.log2FC in expression of this searched gene in stem-like cells from each diseased tissue sample relative to stem-like cells in normal samples in each tissue plotted against the malignancy continuum. Samples are colored based on if they are from different disease stage.
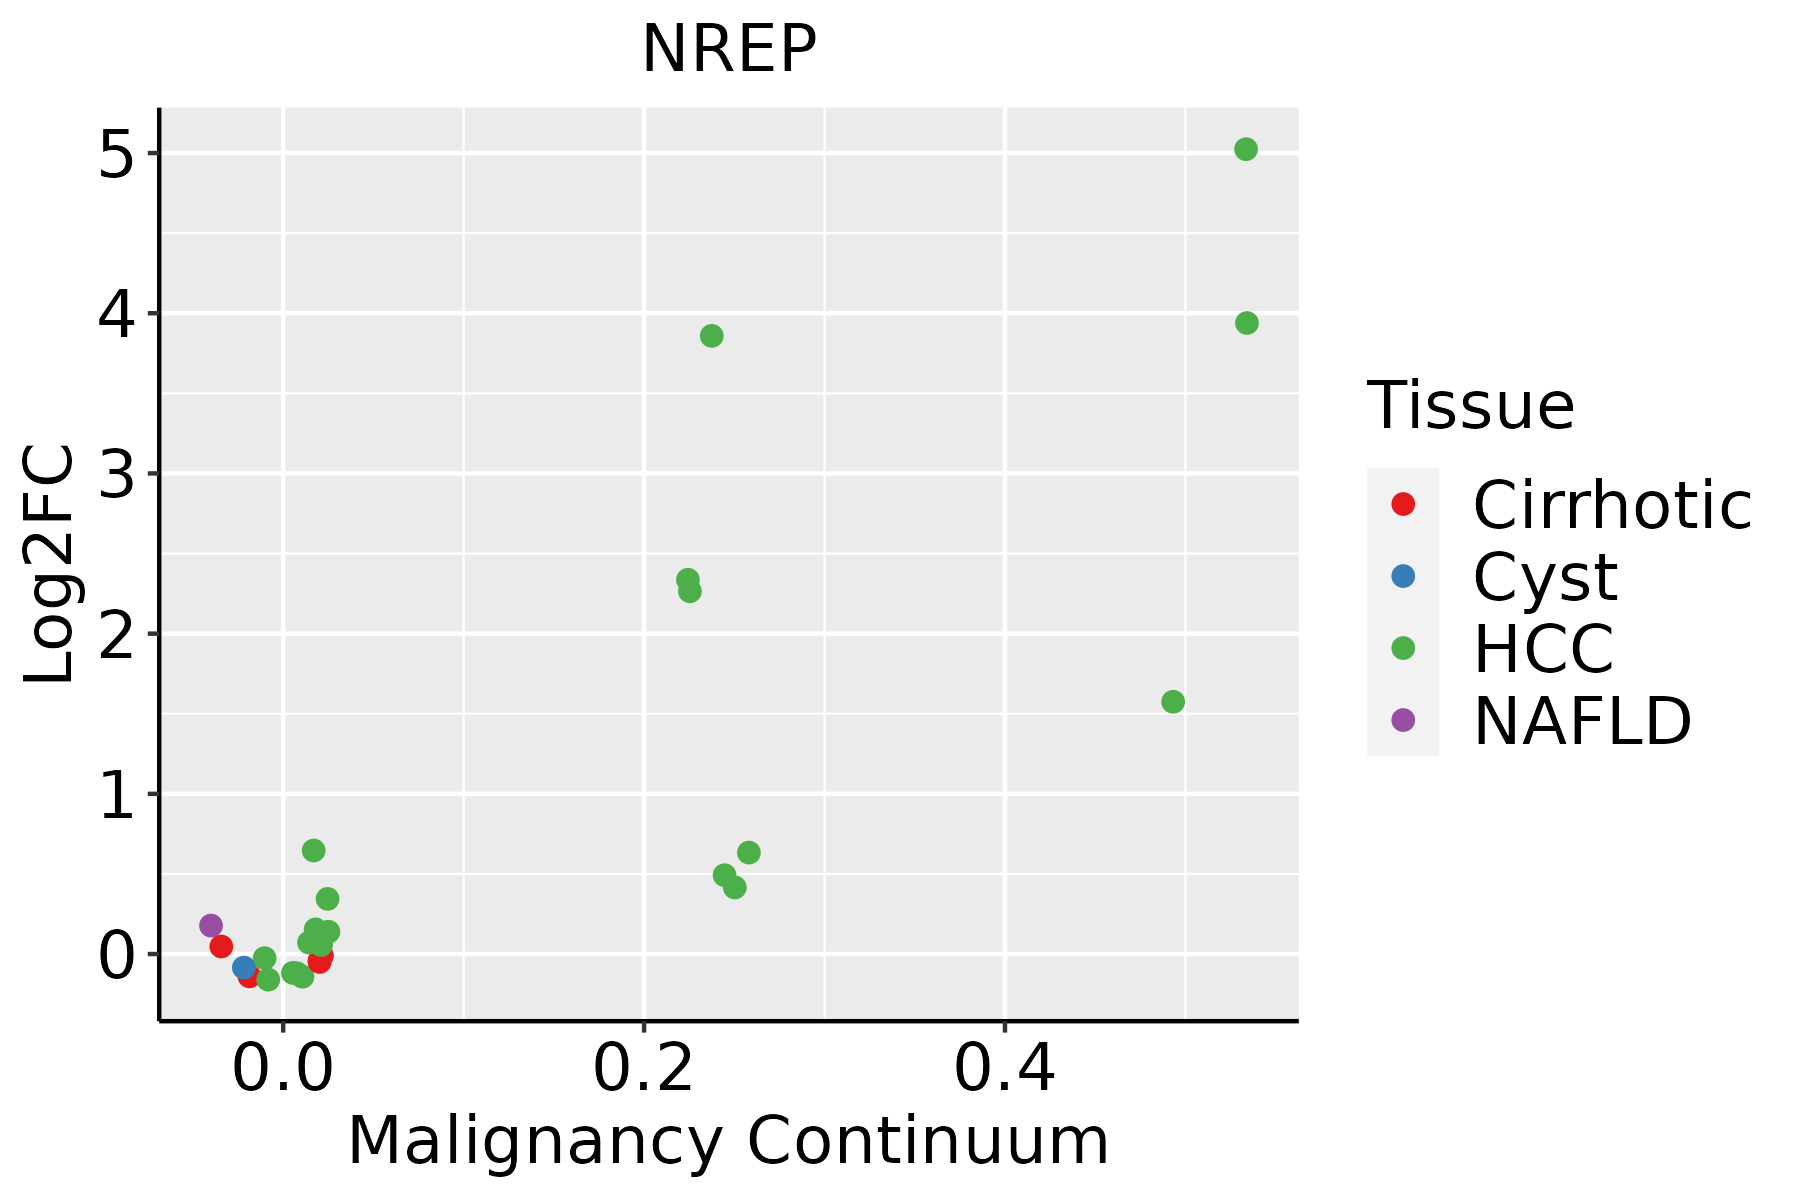
HCC: Hepatocellular carcinoma
NAFLD: Non-alcoholic fatty liver disease
Oral CavityThe image shows the transcriptomic changes along malignancy continuum.log2FC in expression of this searched gene in stem-like cells from each diseased tissue sample relative to stem-like cells in normal samples in each tissue plotted against the malignancy continuum. Samples are colored based on if they are from different disease stage.
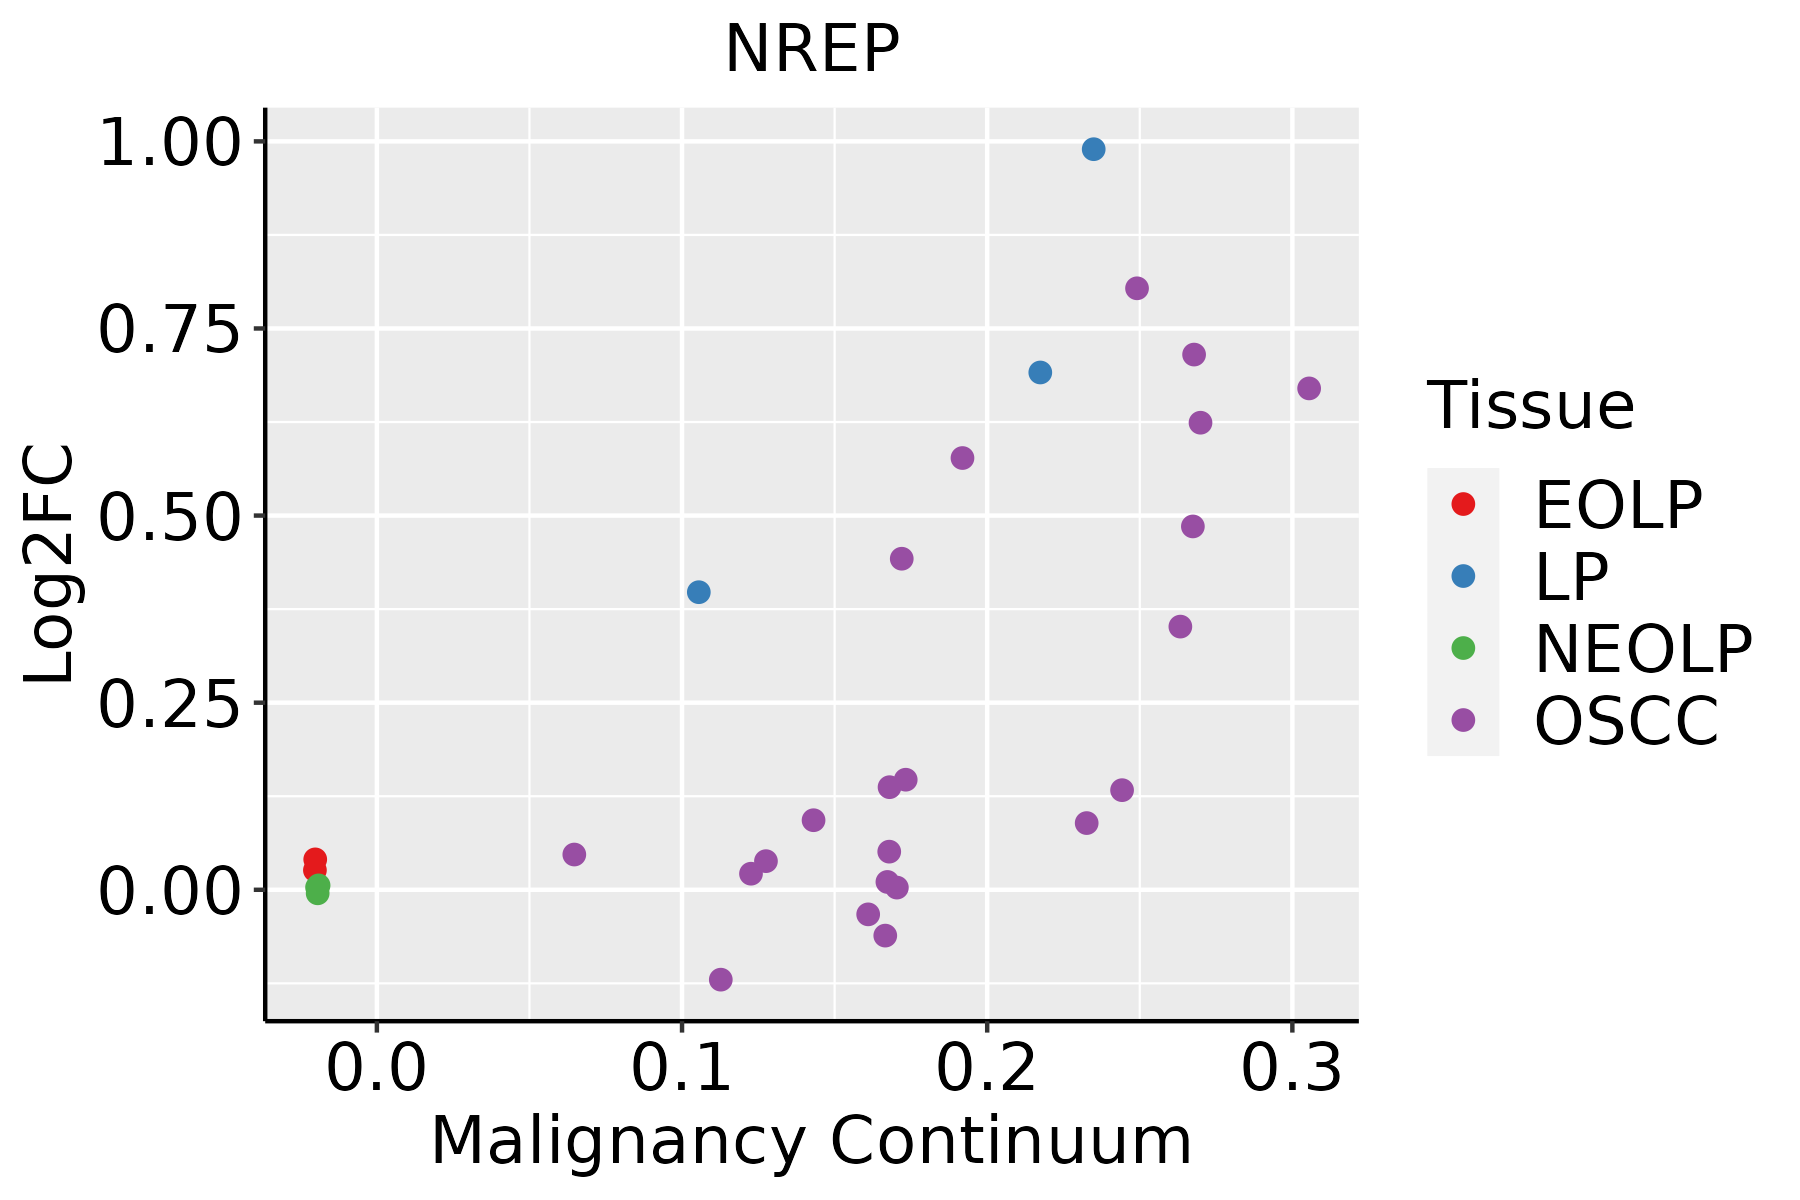
EOLP: Erosive Oral lichen planus
LP: leukoplakia
NEOLP: Non-erosive oral lichen planus
OSCC: Oral squamous cell carcinoma
SkinThe image shows the transcriptomic changes along malignancy continuum.log2FC in expression of this searched gene in stem-like cells from each diseased tissue sample relative to stem-like cells in normal samples in each tissue plotted against the malignancy continuum. Samples are colored based on if they are from different disease stage.
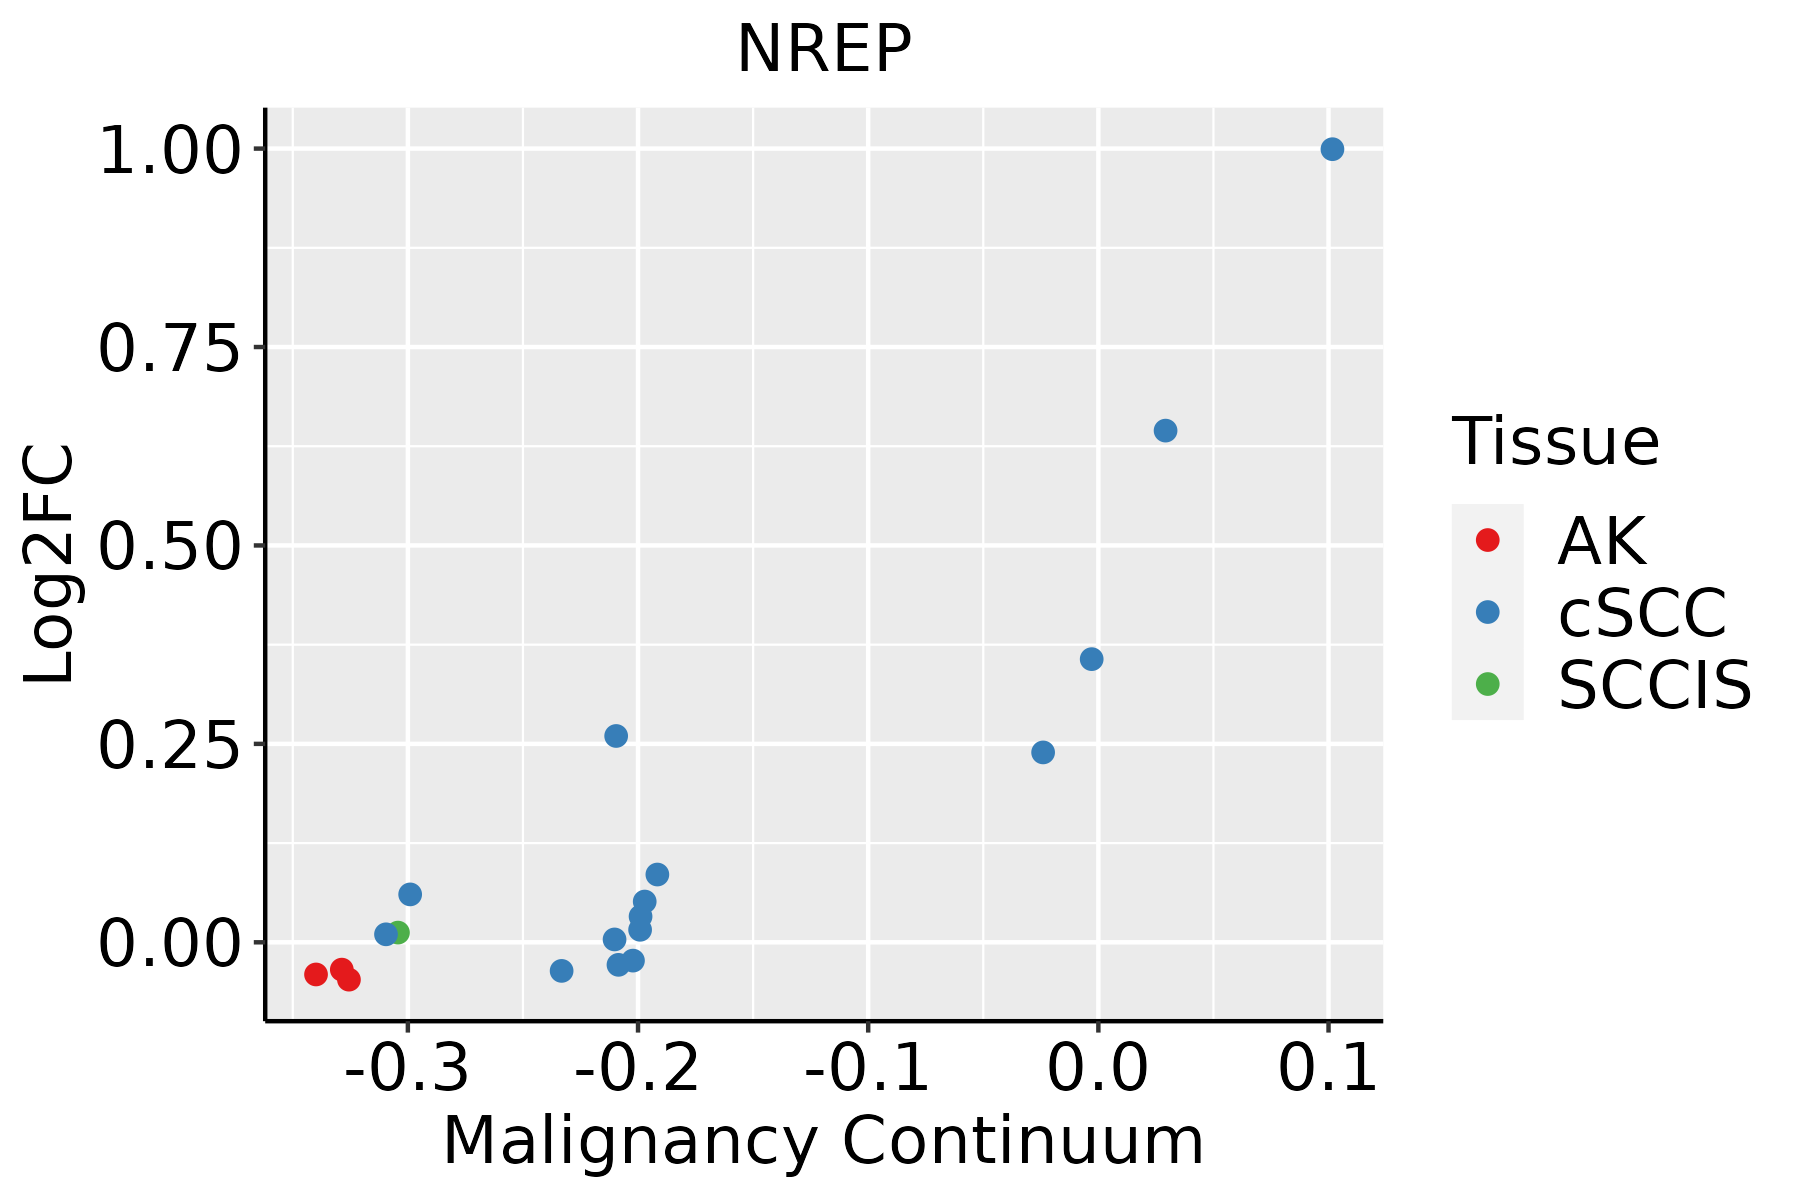
AK: Actinic keratosis
cSCC: Cutaneous squamous cell carcinoma
SCCIS:squamous cell carcinoma in situ
ThyroidThe image shows the transcriptomic changes along malignancy continuum.log2FC in expression of this searched gene in stem-like cells from each diseased tissue sample relative to stem-like cells in normal samples in each tissue plotted against the malignancy continuum. Samples are colored based on if they are from different disease stage.
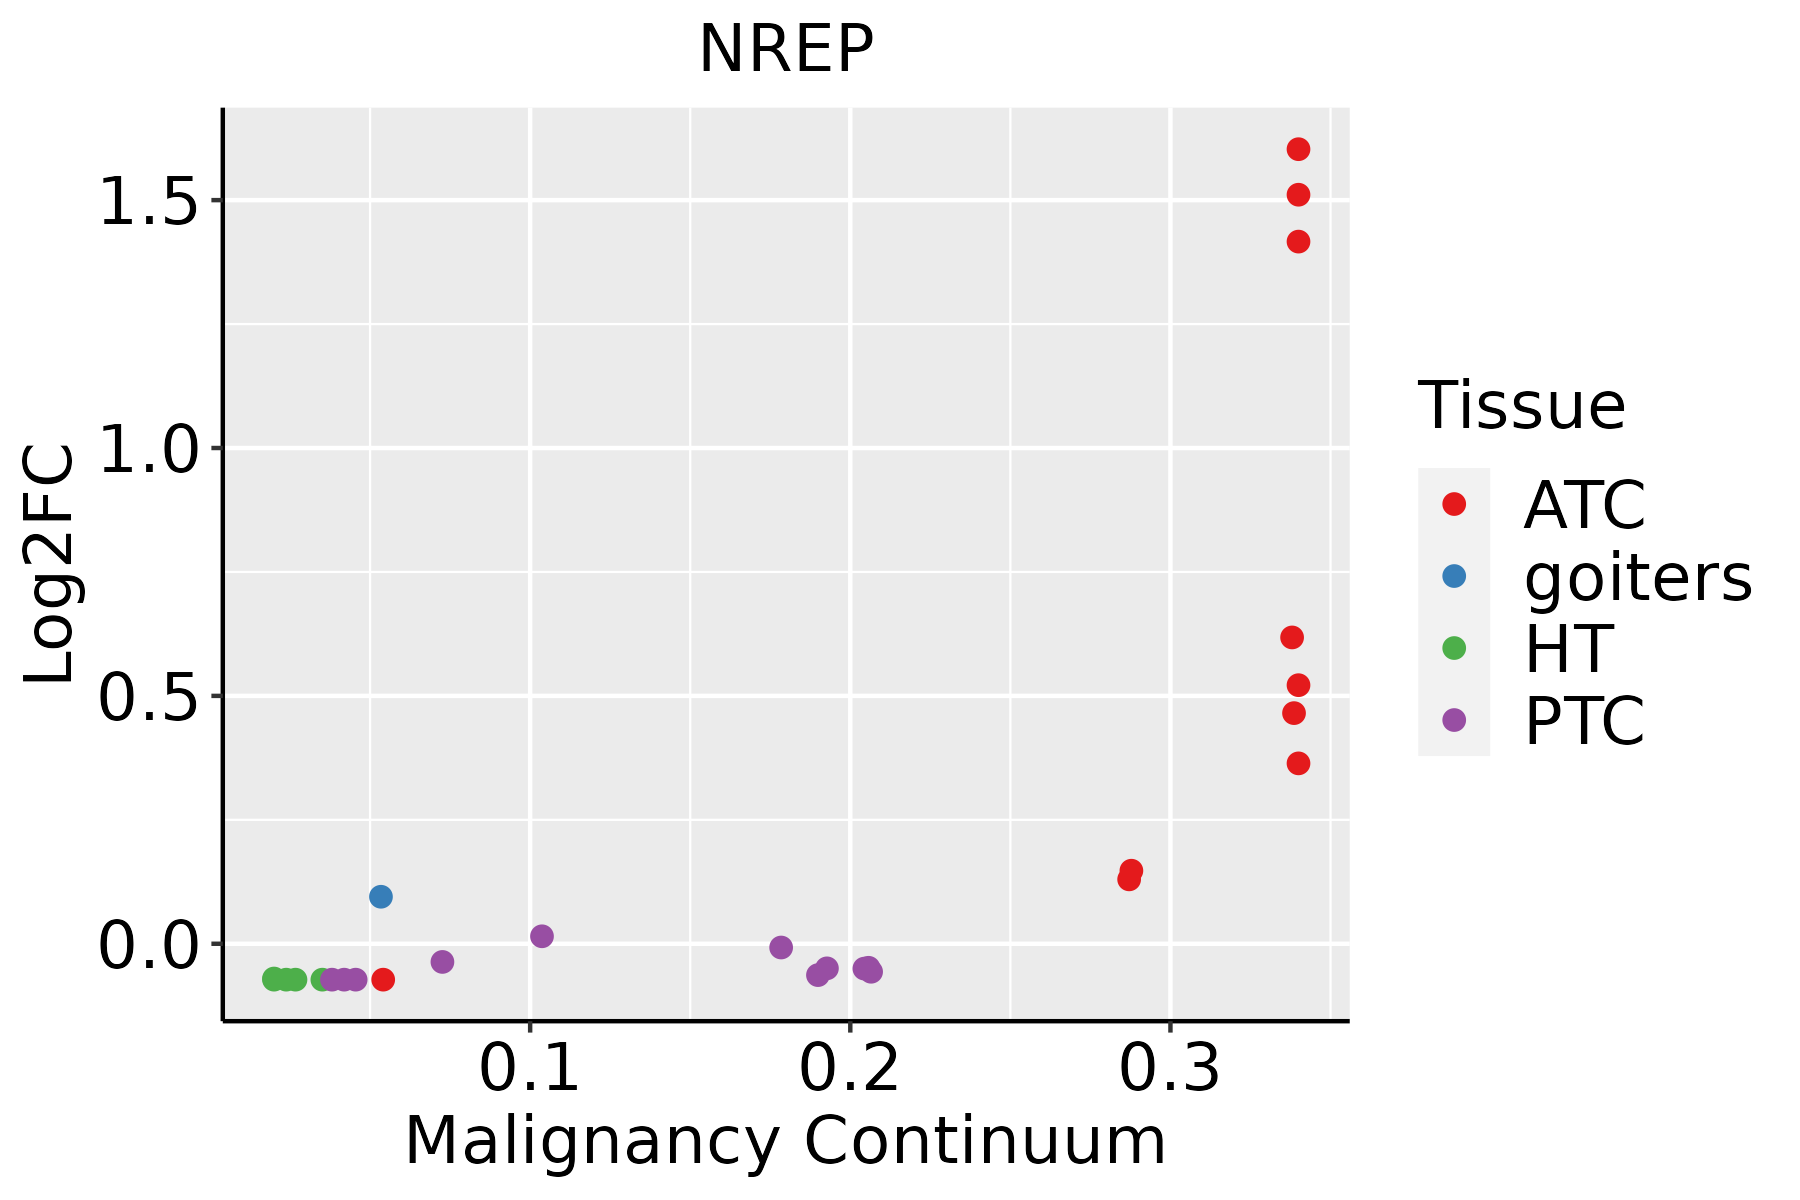
ATC: Anaplastic thyroid cancer
HT: Hashimoto's thyroiditis
PTC: Papillary thyroid cancer
∗log2FC in expression of this searched gene in stem-like cells from each diseased tissue sample relative to stem-like cells in normal samples in each tissue plotted against the malignancy continuum. Samples are colored based on if they are from different disease stage.

Top

Malignant transformation related pathway analysis

check buttonFind out the enriched GO biological processes and KEGG pathways involved in transition from healthy to precancer to cancer
check button Figure of enriched GO biological processes.
TissueDisease StageEnriched GO biological Processes
ColorectumADGO analysis - Figure of enriched GO biological processes: Top 15 enriched GO BP terms are showed in the bar plot of each disease state in each tissue. Each row represents a significant GO biological process which is colored according to the -log10(p.adjust).
ColorectumSERGO analysis - Figure of enriched GO biological processes: Top 15 enriched GO BP terms are showed in the bar plot of each disease state in each tissue. Each row represents a significant GO biological process which is colored according to the -log10(p.adjust).
ColorectumMSSGO analysis - Figure of enriched GO biological processes: Top 15 enriched GO BP terms are showed in the bar plot of each disease state in each tissue. Each row represents a significant GO biological process which is colored according to the -log10(p.adjust).
ColorectumMSI-HGO analysis - Figure of enriched GO biological processes: Top 15 enriched GO BP terms are showed in the bar plot of each disease state in each tissue. Each row represents a significant GO biological process which is colored according to the -log10(p.adjust).
ColorectumFAPGO analysis - Figure of enriched GO biological processes: Top 15 enriched GO BP terms are showed in the bar plot of each disease state in each tissue. Each row represents a significant GO biological process which is colored according to the -log10(p.adjust).
∗Top 15 enriched GO BP terms are showed in the bar plot of each disease state in each tissue. Each row represents a significant GO biological process which is colored according to the -log10(p.adjust).
Page: 1 2 3 4 5 6 7 8 9 

check button Enriched GO biological processes.
GO IDTissueDisease StageDescriptionGene RatioBg Ratiopvaluep.adjustCount
GO:00615648EndometriumAEHaxon development88/2100467/187236.39e-072.38e-0588
GO:00715596EndometriumAEHresponse to transforming growth factor beta53/2100256/187237.01e-061.69e-0453
GO:00071787EndometriumAEHtransmembrane receptor protein serine/threonine kinase signaling pathway67/2100355/187231.28e-052.80e-0467
GO:00715606EndometriumAEHcellular response to transforming growth factor beta stimulus51/2100250/187231.59e-053.32e-0451
GO:00310997EndometriumAEHregeneration41/2100198/187237.29e-051.11e-0341
GO:00071796EndometriumAEHtransforming growth factor beta receptor signaling pathway38/2100198/187236.41e-046.23e-0338
GO:00900922EndometriumAEHregulation of transmembrane receptor protein serine/threonine kinase signaling pathway43/2100256/187234.47e-032.93e-0243
GO:006156412EndometriumEECaxon development93/2168467/187239.60e-084.69e-0693
GO:003109914EndometriumEECregeneration45/2168198/187236.19e-061.49e-0445
GO:007155914EndometriumEECresponse to transforming growth factor beta54/2168256/187238.25e-061.83e-0454
GO:007156014EndometriumEECcellular response to transforming growth factor beta stimulus52/2168250/187231.81e-053.41e-0452
GO:000717814EndometriumEECtransmembrane receptor protein serine/threonine kinase signaling pathway68/2168355/187231.90e-053.50e-0468
GO:000717914EndometriumEECtransforming growth factor beta receptor signaling pathway39/2168198/187236.03e-045.98e-0339
GO:0031102EndometriumEECneuron projection regeneration15/216860/187232.88e-032.03e-0215
GO:009009211EndometriumEECregulation of transmembrane receptor protein serine/threonine kinase signaling pathway44/2168256/187234.72e-033.00e-0244
GO:00311031EndometriumEECaxon regeneration13/216852/187235.34e-033.31e-0213
GO:00486783EndometriumEECresponse to axon injury18/216883/187236.04e-033.57e-0218
GO:00715599EsophagusESCCresponse to transforming growth factor beta157/8552256/187232.95e-074.23e-06157
GO:00715609EsophagusESCCcellular response to transforming growth factor beta stimulus151/8552250/187231.78e-062.10e-05151
GO:003109910EsophagusESCCregeneration122/8552198/187234.26e-064.57e-05122
Page: 1 2 3 4 

check button Enriched KEGG pathways.
Pathway IDTissueDisease StageDescriptionGene RatioBg Ratiopvaluep.adjustqvalueCount
Page: 1 

Top

Cell-cell communication analysis

check buttonIdentification of potential cell-cell interactions between two cell types and their ligand-receptor pairs for different disease states
LigandReceptorLRpairPathwayTissueDisease Stage
Page: 1 

Top

Single-cell gene regulatory network inference analysis

check buttonFind out the significant the regulons (TFs) and the target genes of each regulon across cell types for different disease states
TFCell TypeTissueDisease StageTarget GeneRSSRegulon Activity
∗The dot plots of a searched regulon are shown for all cell subpopulations in each disease state of each tissue based on the regulon specific score inferred using pySCENIC and by calculating the average expression.
Page: 1 

Top

Somatic mutation of malignant transformation related genes

check buttonAnnotation of somatic variants for genes involved in malignant transformation
Hugo SymbolVariant ClassVariant ClassificationdbSNP RSHGVScHGVSpHGVSp ShortSWISSPROTBIOTYPESIFTPolyPhenTumor Sample BarcodeTissueHistologySexAgeStageTherapy TypesDrugsOutcome
NREPSNVMissense_Mutationc.245G>Ap.Arg82Hisp.R82HQ16612protein_codingdeleterious(0.05)probably_damaging(1)TCGA-BH-A0B1-01Breastbreast invasive carcinomaFemale>=65I/IIChemotherapyadriamycinSD
NREPSNVMissense_Mutationrs756211201c.35N>Ap.Arg12Glnp.R12QQ16612protein_codingdeleterious_low_confidence(0)benign(0)TCGA-C8-A1HM-01Breastbreast invasive carcinomaFemale>=65I/IIChemotherapydoxorubicinCR
NREPSNVMissense_Mutationc.224C>Tp.Pro75Leup.P75LQ16612protein_codingdeleterious(0.02)probably_damaging(1)TCGA-AA-3715-01Colorectumcolon adenocarcinomaMale>=65I/IIUnknownUnknownPD
NREPSNVMissense_Mutationc.245N>Ap.Arg82Hisp.R82HQ16612protein_codingdeleterious(0.05)probably_damaging(1)TCGA-A5-A0G1-01Endometriumuterine corpus endometrioid carcinomaFemale>=65I/IIUnknownUnknownSD
NREPSNVMissense_Mutationrs1802827c.290G>Ap.Gly97Aspp.G97DQ16612protein_codingdeleterious(0.04)possibly_damaging(0.836)TCGA-A5-A1OF-01Endometriumuterine corpus endometrioid carcinomaFemale<65I/IIUnknownUnknownSD
NREPSNVMissense_Mutationc.244N>Tp.Arg82Cysp.R82CQ16612protein_codingdeleterious(0.01)probably_damaging(1)TCGA-AP-A051-01Endometriumuterine corpus endometrioid carcinomaFemale>=65I/IIUnknownUnknownSD
NREPSNVMissense_Mutationnovelc.314N>Ap.Arg105Lysp.R105KQ16612protein_codingtolerated(0.59)benign(0.005)TCGA-AP-A1DV-01Endometriumuterine corpus endometrioid carcinomaFemale<65I/IIUnknownUnknownSD
NREPSNVMissense_Mutationnovelc.314G>Tp.Arg105Ilep.R105IQ16612protein_codingdeleterious(0.03)benign(0.403)TCGA-AP-A1E0-01Endometriumuterine corpus endometrioid carcinomaFemale<65III/IVChemotherapypaclitaxelSD
NREPSNVMissense_Mutationc.61N>Gp.Arg21Glyp.R21GQ16612protein_codingdeleterious_low_confidence(0.02)benign(0)TCGA-B5-A0JN-01Endometriumuterine corpus endometrioid carcinomaFemale>=65III/IVChemotherapypaclitaxelSD
NREPSNVMissense_Mutationc.6A>Cp.Lys2Asnp.K2NQ16612protein_codingdeleterious_low_confidence(0)benign(0.007)TCGA-D1-A103-01Endometriumuterine corpus endometrioid carcinomaFemale>=65I/IIUnknownUnknownSD
Page: 1 2 

Top

Related drugs of malignant transformation related genes

check buttonIdentification of chemicals and drugs interact with genes involved in malignant transfromation
(DGIdb 4.0)
Entrez IDSymbolCategoryInteraction TypesDrug Claim NameDrug NamePMIDs
Page: 1