Schematic overview of the cellular and molecular mechanisms involved in the cancer progression, including the proposed cellular and molecular mechanisms in cancer cells trajectory. AT1: alveolar type 1 cells; AT2: alveolar type 2 cells; AAH: atypical adenomatous hyperplasia; AIS: adenocarcinoma in situ; MIA: minimally invasive adenocarcinoma; IA: invasive adenocarcinoma; EMT: epithelial-mesenchymal transition

Home

Download

Statistics

Help

Contact

Center for Computational Systems Medicine
leaf

Gene summary

leaf

Malignant transformation analysis

leaf

Malignant transformation related pathway analysis

leaf

Cell-cell communication analysis

leaf

Single-cell gene regulatory network inference analysis

leaf

Somatic mutation of malignant transformation related genes

leaf

Related drugs of malignant transformation related genes

Gene: NRDE2

Gene summary for NRDE2

check button Gene summary.

Gene informationSpeciesHuman
Gene symbol

NRDE2

Gene ID

55051

Gene nameNRDE-2, necessary for RNA interference, domain containing
Gene AliasC14orf102
Cytomap14q32.11
Gene Typeprotein-coding
GO ID

GO:0000278

UniProtAcc

Q9H7Z3


Top

Malignant transformation analysis

check button Identification of the aberrant gene expression in precancerous and cancerous lesions by comparing the gene expression of stem-like cells in diseased tissues with normal stem cells
check button Malignant transformation involving gene list.
Entrez IDSymbolReplicatesSpeciesOrganTissueAdj P-valueLog2FCMalignancy
55051NRDE2LZE7THumanEsophagusESCC5.28e-041.40e-010.0667
55051NRDE2LZE20THumanEsophagusESCC7.59e-052.16e-010.0662
55051NRDE2LZE24THumanEsophagusESCC1.32e-051.09e-010.0596
55051NRDE2LZE21THumanEsophagusESCC2.85e-023.11e-010.0655
55051NRDE2P1T-EHumanEsophagusESCC2.51e-022.04e-010.0875
55051NRDE2P2T-EHumanEsophagusESCC2.03e-131.79e-010.1177
55051NRDE2P4T-EHumanEsophagusESCC1.23e-131.93e-010.1323
55051NRDE2P5T-EHumanEsophagusESCC6.02e-189.76e-020.1327
55051NRDE2P8T-EHumanEsophagusESCC3.32e-183.05e-010.0889
55051NRDE2P9T-EHumanEsophagusESCC1.61e-041.60e-010.1131
55051NRDE2P10T-EHumanEsophagusESCC5.01e-547.99e-010.116
55051NRDE2P11T-EHumanEsophagusESCC5.90e-082.81e-010.1426
55051NRDE2P12T-EHumanEsophagusESCC1.06e-194.02e-010.1122
55051NRDE2P15T-EHumanEsophagusESCC5.52e-234.35e-010.1149
55051NRDE2P16T-EHumanEsophagusESCC5.06e-142.18e-010.1153
55051NRDE2P17T-EHumanEsophagusESCC1.02e-021.83e-010.1278
55051NRDE2P20T-EHumanEsophagusESCC1.34e-092.24e-010.1124
55051NRDE2P21T-EHumanEsophagusESCC1.27e-111.18e-010.1617
55051NRDE2P22T-EHumanEsophagusESCC7.46e-131.27e-010.1236
55051NRDE2P23T-EHumanEsophagusESCC1.31e-131.80e-010.108
Page: 1 2 3 4 5 

check button Transcriptomic changes along malignancy continuum.
TissueExpression DynamicsAbbreviation
EsophagusThe image shows the transcriptomic changes along malignancy continuum.log2FC in expression of this searched gene in stem-like cells from each diseased tissue sample relative to stem-like cells in normal samples in each tissue plotted against the malignancy continuum. Samples are colored based on if they are from different disease stage.
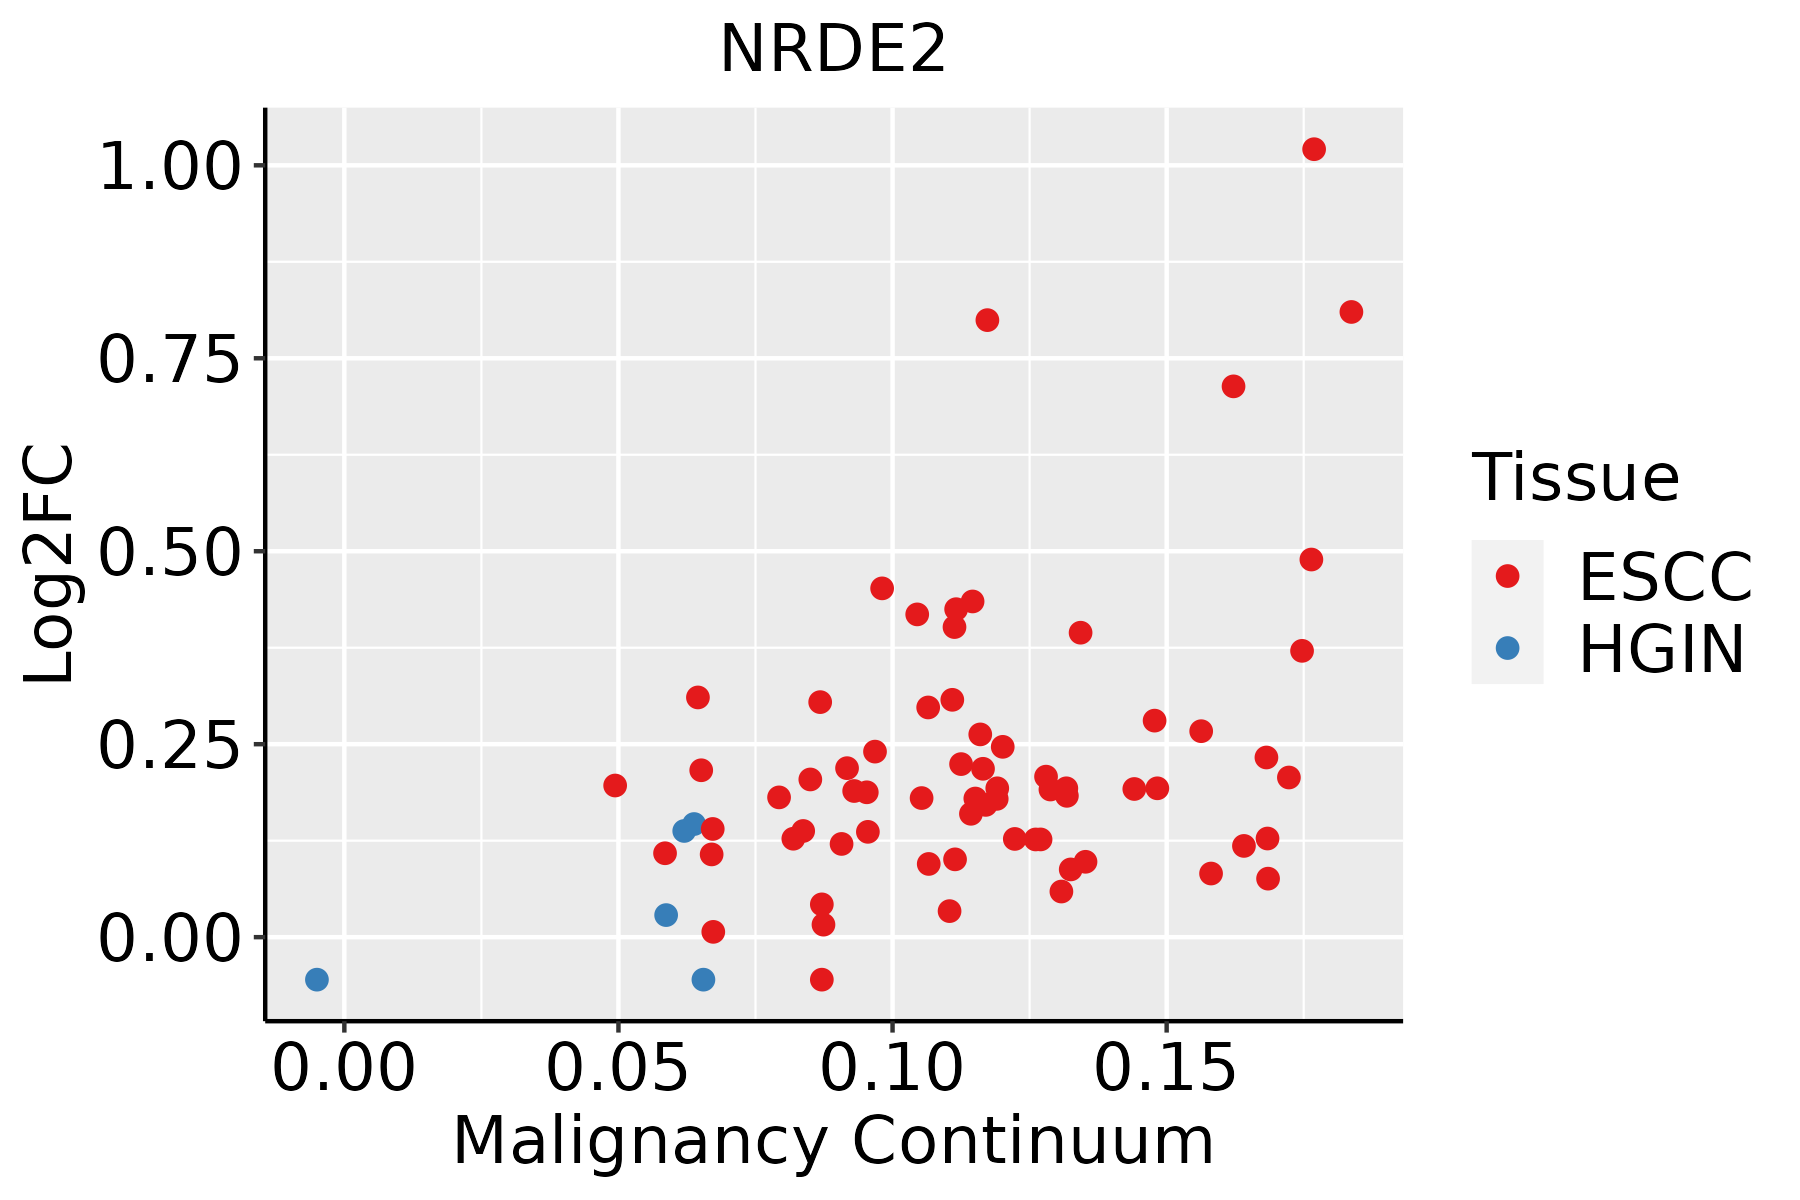
ESCC: Esophageal squamous cell carcinoma
HGIN: High-grade intraepithelial neoplasias
LGIN: Low-grade intraepithelial neoplasias
Oral CavityThe image shows the transcriptomic changes along malignancy continuum.log2FC in expression of this searched gene in stem-like cells from each diseased tissue sample relative to stem-like cells in normal samples in each tissue plotted against the malignancy continuum. Samples are colored based on if they are from different disease stage.
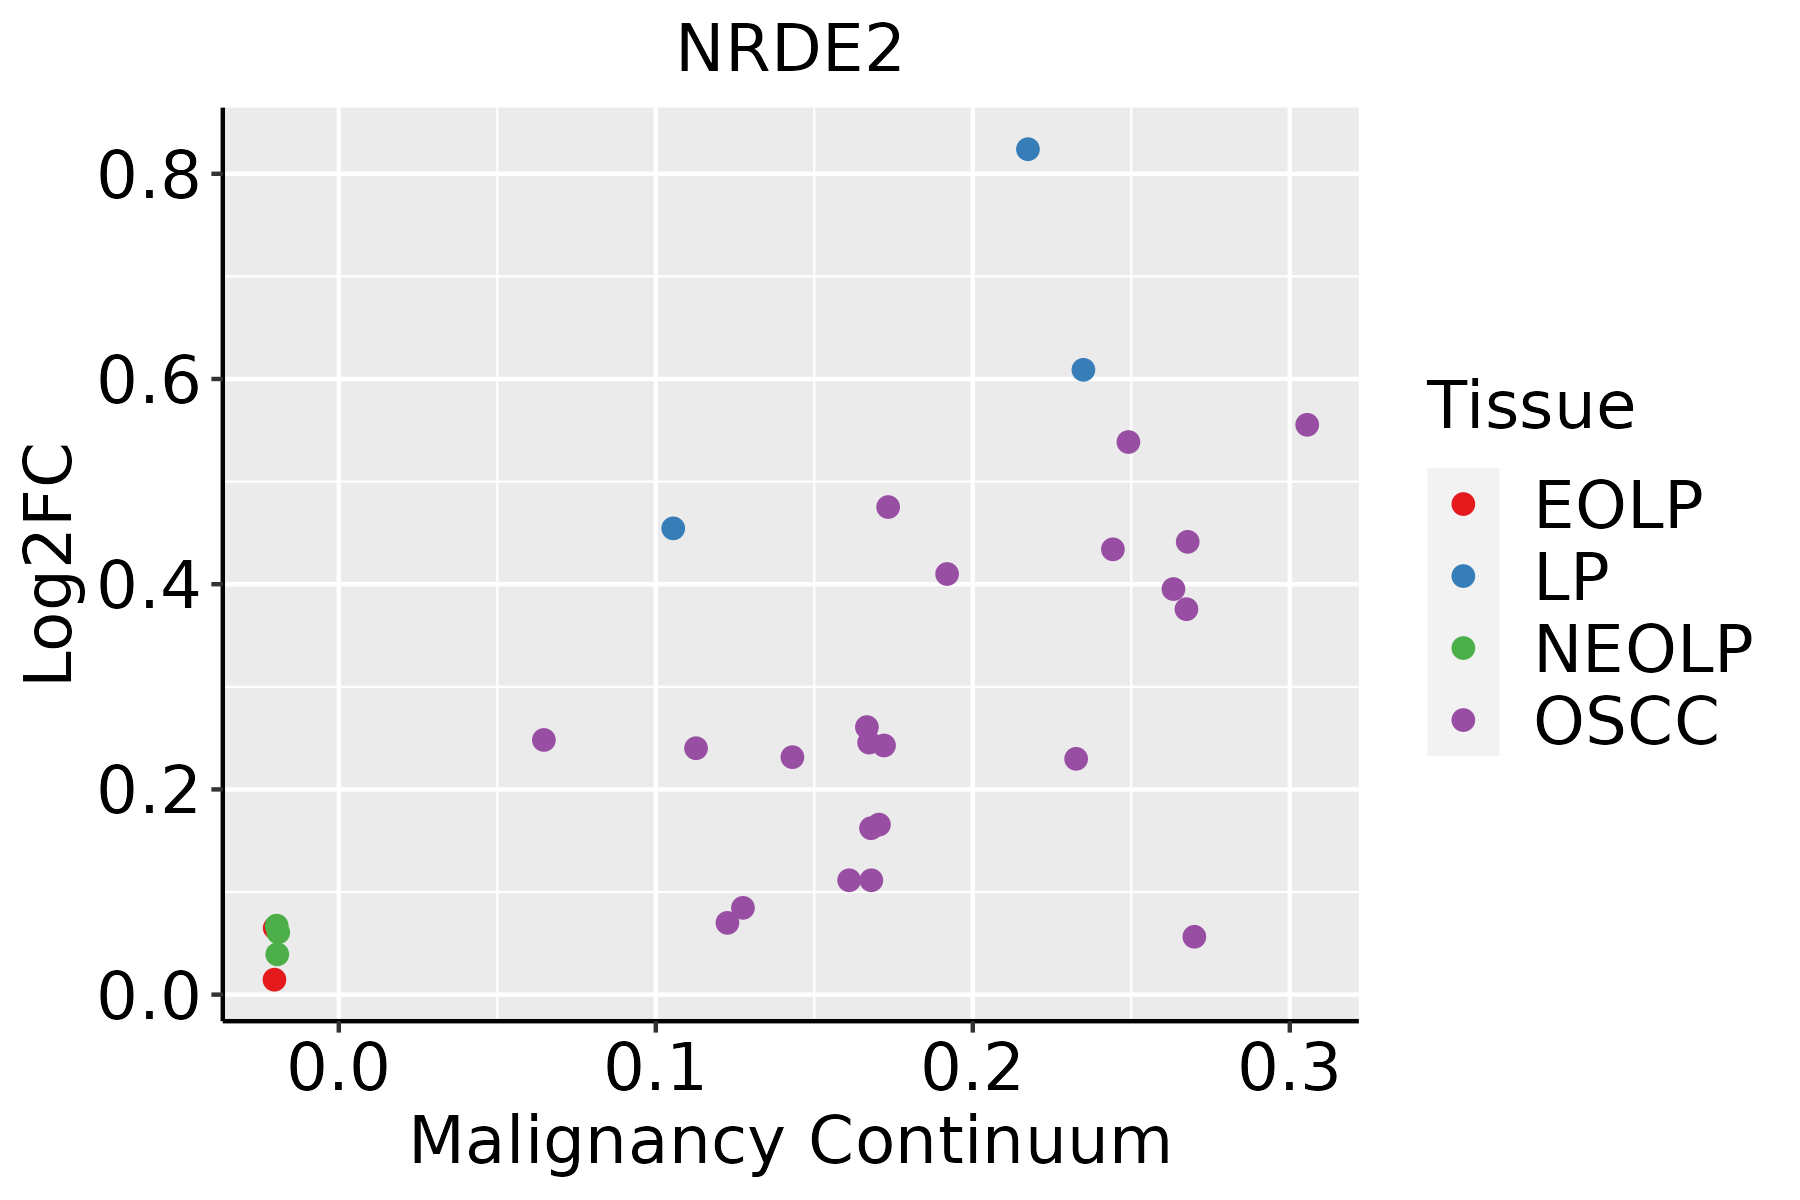
EOLP: Erosive Oral lichen planus
LP: leukoplakia
NEOLP: Non-erosive oral lichen planus
OSCC: Oral squamous cell carcinoma
ThyroidThe image shows the transcriptomic changes along malignancy continuum.log2FC in expression of this searched gene in stem-like cells from each diseased tissue sample relative to stem-like cells in normal samples in each tissue plotted against the malignancy continuum. Samples are colored based on if they are from different disease stage.
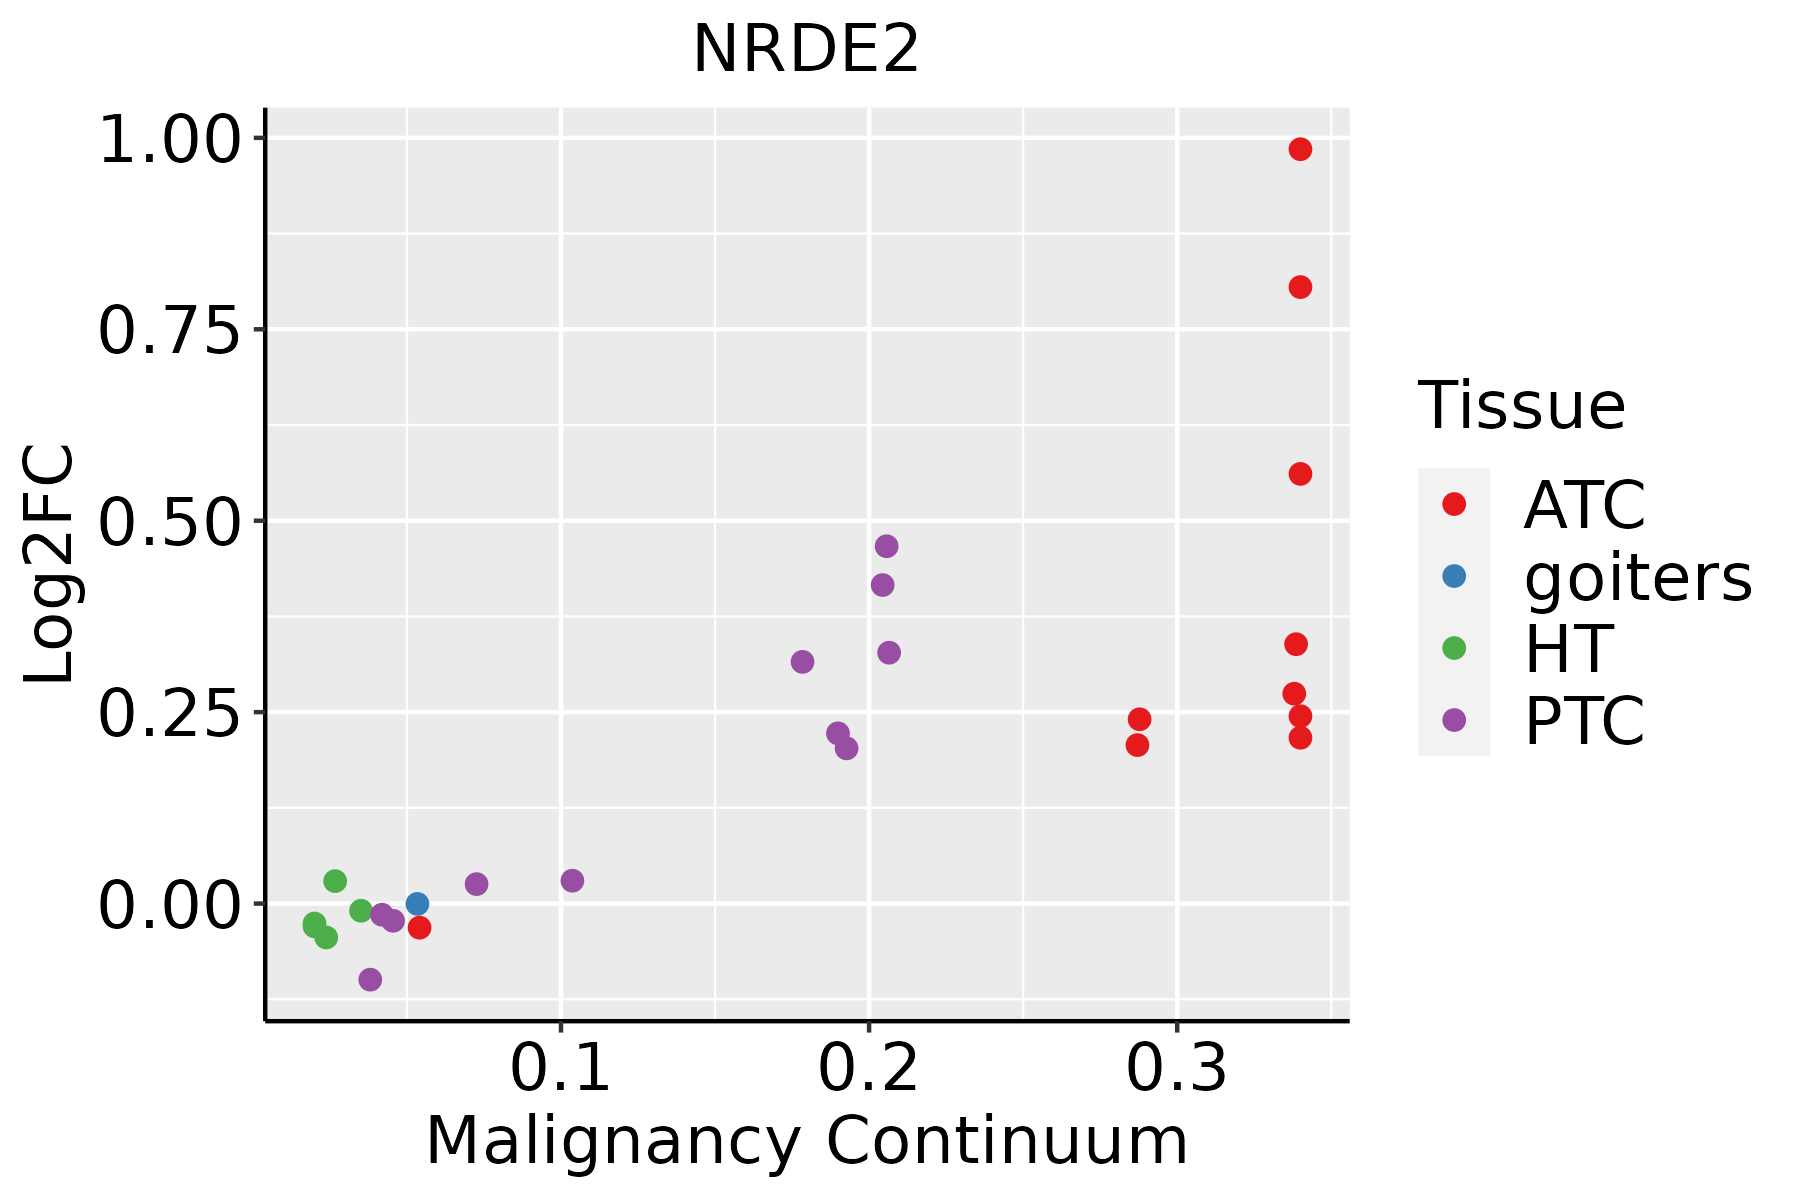
ATC: Anaplastic thyroid cancer
HT: Hashimoto's thyroiditis
PTC: Papillary thyroid cancer
∗log2FC in expression of this searched gene in stem-like cells from each diseased tissue sample relative to stem-like cells in normal samples in each tissue plotted against the malignancy continuum. Samples are colored based on if they are from different disease stage.

Top

Malignant transformation related pathway analysis

check buttonFind out the enriched GO biological processes and KEGG pathways involved in transition from healthy to precancer to cancer
check button Figure of enriched GO biological processes.
TissueDisease StageEnriched GO biological Processes
ColorectumADGO analysis - Figure of enriched GO biological processes: Top 15 enriched GO BP terms are showed in the bar plot of each disease state in each tissue. Each row represents a significant GO biological process which is colored according to the -log10(p.adjust).
ColorectumSERGO analysis - Figure of enriched GO biological processes: Top 15 enriched GO BP terms are showed in the bar plot of each disease state in each tissue. Each row represents a significant GO biological process which is colored according to the -log10(p.adjust).
ColorectumMSSGO analysis - Figure of enriched GO biological processes: Top 15 enriched GO BP terms are showed in the bar plot of each disease state in each tissue. Each row represents a significant GO biological process which is colored according to the -log10(p.adjust).
ColorectumMSI-HGO analysis - Figure of enriched GO biological processes: Top 15 enriched GO BP terms are showed in the bar plot of each disease state in each tissue. Each row represents a significant GO biological process which is colored according to the -log10(p.adjust).
ColorectumFAPGO analysis - Figure of enriched GO biological processes: Top 15 enriched GO BP terms are showed in the bar plot of each disease state in each tissue. Each row represents a significant GO biological process which is colored according to the -log10(p.adjust).
∗Top 15 enriched GO BP terms are showed in the bar plot of each disease state in each tissue. Each row represents a significant GO biological process which is colored according to the -log10(p.adjust).
Page: 1 2 3 4 5 6 7 8 9 

check button Enriched GO biological processes.
GO IDTissueDisease StageDescriptionGene RatioBg Ratiopvaluep.adjustCount
GO:0008380111EsophagusESCCRNA splicing336/8552434/187231.74e-423.67e-39336
GO:0006913110EsophagusESCCnucleocytoplasmic transport230/8552301/187236.04e-282.02e-25230
GO:0051169110EsophagusESCCnuclear transport230/8552301/187236.04e-282.02e-25230
GO:0006403110EsophagusESCCRNA localization166/8552201/187231.95e-276.18e-25166
GO:003238618EsophagusESCCregulation of intracellular transport243/8552337/187233.20e-237.25e-21243
GO:0006401110EsophagusESCCRNA catabolic process204/8552278/187233.39e-215.66e-19204
GO:005123617EsophagusESCCestablishment of RNA localization134/8552166/187231.23e-201.81e-18134
GO:0051168110EsophagusESCCnuclear export126/8552154/187231.88e-202.65e-18126
GO:005065717EsophagusESCCnucleic acid transport131/8552163/187236.94e-208.46e-18131
GO:005065817EsophagusESCCRNA transport131/8552163/187236.94e-208.46e-18131
GO:0034655110EsophagusESCCnucleobase-containing compound catabolic process272/8552407/187232.92e-182.90e-16272
GO:0032388110EsophagusESCCpositive regulation of intracellular transport152/8552202/187237.89e-187.36e-16152
GO:001593117EsophagusESCCnucleobase-containing compound transport162/8552222/187239.87e-177.93e-15162
GO:004670018EsophagusESCCheterocycle catabolic process286/8552445/187231.12e-157.47e-14286
GO:0046822110EsophagusESCCregulation of nucleocytoplasmic transport88/8552106/187231.88e-151.19e-1388
GO:004427019EsophagusESCCcellular nitrogen compound catabolic process288/8552451/187233.03e-151.79e-13288
GO:001943918EsophagusESCCaromatic compound catabolic process295/8552467/187231.09e-145.98e-13295
GO:190136118EsophagusESCCorganic cyclic compound catabolic process307/8552495/187239.99e-144.80e-12307
GO:000640512EsophagusESCCRNA export from nucleus68/855284/187232.99e-111.01e-0968
GO:0009895111EsophagusESCCnegative regulation of catabolic process201/8552320/187233.88e-101.05e-08201
Page: 1 2 3 4 5 6 7 8 

check button Enriched KEGG pathways.
Pathway IDTissueDisease StageDescriptionGene RatioBg Ratiopvaluep.adjustqvalueCount
Page: 1 

Top

Cell-cell communication analysis

check buttonIdentification of potential cell-cell interactions between two cell types and their ligand-receptor pairs for different disease states
LigandReceptorLRpairPathwayTissueDisease Stage
Page: 1 

Top

Single-cell gene regulatory network inference analysis

check buttonFind out the significant the regulons (TFs) and the target genes of each regulon across cell types for different disease states
TFCell TypeTissueDisease StageTarget GeneRSSRegulon Activity
∗The dot plots of a searched regulon are shown for all cell subpopulations in each disease state of each tissue based on the regulon specific score inferred using pySCENIC and by calculating the average expression.
Page: 1 

Top

Somatic mutation of malignant transformation related genes

check buttonAnnotation of somatic variants for genes involved in malignant transformation
Hugo SymbolVariant ClassVariant ClassificationdbSNP RSHGVScHGVSpHGVSp ShortSWISSPROTBIOTYPESIFTPolyPhenTumor Sample BarcodeTissueHistologySexAgeStageTherapy TypesDrugsOutcome
NRDE2SNVMissense_Mutationc.1088T>Cp.Leu363Prop.L363PQ9H7Z3protein_codingdeleterious(0)probably_damaging(0.981)TCGA-AN-A0XN-01Breastbreast invasive carcinomaFemale>=65III/IVUnknownUnknownSD
NRDE2SNVMissense_Mutationc.457N>Cp.Glu153Glnp.E153QQ9H7Z3protein_codingdeleterious(0.01)possibly_damaging(0.69)TCGA-AN-A0XW-01Breastbreast invasive carcinomaFemale<65III/IVUnknownUnknownSD
NRDE2SNVMissense_Mutationc.2039N>Ap.Phe680Tyrp.F680YQ9H7Z3protein_codingtolerated(0.89)benign(0.001)TCGA-BH-A0B5-01Breastbreast invasive carcinomaFemale<65III/IVChemotherapyadriamycinCR
NRDE2SNVMissense_Mutationrs78302825c.3448C>Tp.Arg1150Trpp.R1150WQ9H7Z3protein_codingdeleterious(0)probably_damaging(0.952)TCGA-BH-A0BL-01Breastbreast invasive carcinomaFemale<65I/IIChemotherapyadriamycinCR
NRDE2SNVMissense_Mutationc.1792N>Cp.Asp598Hisp.D598HQ9H7Z3protein_codingdeleterious(0)probably_damaging(0.997)TCGA-D8-A1JA-01Breastbreast invasive carcinomaFemale<65III/IVChemotherapyadriamycinPD
NRDE2SNVMissense_Mutationc.337G>Ap.Asp113Asnp.D113NQ9H7Z3protein_codingtolerated(0.18)benign(0.379)TCGA-E2-A1L7-01Breastbreast invasive carcinomaFemale<65III/IVChemotherapycyclophosphamidePD
NRDE2SNVMissense_Mutationrs368842771c.1585N>Tp.Arg529Trpp.R529WQ9H7Z3protein_codingdeleterious(0)probably_damaging(1)TCGA-E9-A5UO-01Breastbreast invasive carcinomaFemale<65I/IIUnknownUnknownSD
NRDE2insertionNonsense_Mutationnovelc.430_431insTTCAATAAGTATTAGTTGAATAAATGAATCCAAAAGTACp.Asp144delinsValGlnTerValLeuValGluTerMetAsnProLysValHisp.D144delinsVQ*VLVE*MNPKVHQ9H7Z3protein_codingTCGA-A7-A0CG-01Breastbreast invasive carcinomaFemale>=65I/IIUnknownUnknownSD
NRDE2insertionIn_Frame_Insnovelc.2676_2677insGCTGGCCCCTCTGCGAGAGGCACTCTCACAGGCTTTAAAp.Ser892_Asn893insAlaGlyProSerAlaArgGlyThrLeuThrGlyPheLysp.S892_N893insAGPSARGTLTGFKQ9H7Z3protein_codingTCGA-A8-A06X-01Breastbreast invasive carcinomaFemale>=65I/IIUnknownUnknownSD
NRDE2SNVMissense_Mutationrs771864754c.2141N>Ap.Arg714Hisp.R714HQ9H7Z3protein_codingtolerated(0.17)benign(0.011)TCGA-2W-A8YY-01Cervixcervical & endocervical cancerFemale<65I/IIChemotherapycisplatinCR
Page: 1 2 3 4 5 6 7 8 9 10 11 

Top

Related drugs of malignant transformation related genes

check buttonIdentification of chemicals and drugs interact with genes involved in malignant transfromation
(DGIdb 4.0)
Entrez IDSymbolCategoryInteraction TypesDrug Claim NameDrug NamePMIDs
Page: 1