Schematic overview of the cellular and molecular mechanisms involved in the cancer progression, including the proposed cellular and molecular mechanisms in cancer cells trajectory. AT1: alveolar type 1 cells; AT2: alveolar type 2 cells; AAH: atypical adenomatous hyperplasia; AIS: adenocarcinoma in situ; MIA: minimally invasive adenocarcinoma; IA: invasive adenocarcinoma; EMT: epithelial-mesenchymal transition

Home

Download

Statistics

Help

Contact

Center for Computational Systems Medicine
leaf

Gene summary

leaf

Malignant transformation analysis

leaf

Malignant transformation related pathway analysis

leaf

Cell-cell communication analysis

leaf

Single-cell gene regulatory network inference analysis

leaf

Somatic mutation of malignant transformation related genes

leaf

Related drugs of malignant transformation related genes

Gene: NRDC

Gene summary for NRDC

check button Gene summary.

Gene informationSpeciesHuman
Gene symbol

NRDC

Gene ID

4898

Gene namenardilysin convertase
Gene AliasNRD1
Cytomap1p32.3
Gene Typeprotein-coding
GO ID

GO:0001659

UniProtAcc

O43847


Top

Malignant transformation analysis

check button Identification of the aberrant gene expression in precancerous and cancerous lesions by comparing the gene expression of stem-like cells in diseased tissues with normal stem cells
check button Malignant transformation involving gene list.
Entrez IDSymbolReplicatesSpeciesOrganTissueAdj P-valueLog2FCMalignancy
4898NRDCHTA11_1938_2000001011HumanColorectumAD3.88e-127.38e-01-0.0811
4898NRDCHTA11_347_2000001011HumanColorectumAD1.96e-136.89e-01-0.1954
4898NRDCHTA11_1391_2000001011HumanColorectumAD4.01e-024.53e-01-0.059
4898NRDCHTA11_99999970781_79442HumanColorectumMSS1.28e-024.56e-010.294
4898NRDCHTA11_99999965104_69814HumanColorectumMSS3.08e-035.06e-010.281
4898NRDCA001-C-207HumanColorectumFAP1.34e-04-2.70e-010.1278
4898NRDCA015-C-203HumanColorectumFAP3.83e-28-4.19e-01-0.1294
4898NRDCA015-C-204HumanColorectumFAP5.33e-07-3.40e-01-0.0228
4898NRDCA014-C-040HumanColorectumFAP3.27e-04-4.87e-01-0.1184
4898NRDCA002-C-201HumanColorectumFAP2.91e-15-4.47e-010.0324
4898NRDCA002-C-203HumanColorectumFAP2.20e-02-1.17e-010.2786
4898NRDCA001-C-119HumanColorectumFAP1.13e-03-2.66e-01-0.1557
4898NRDCA001-C-108HumanColorectumFAP1.19e-14-1.47e-01-0.0272
4898NRDCA002-C-205HumanColorectumFAP6.95e-18-2.36e-01-0.1236
4898NRDCA001-C-104HumanColorectumFAP3.89e-02-6.11e-020.0184
4898NRDCA015-C-005HumanColorectumFAP4.40e-03-2.26e-01-0.0336
4898NRDCA015-C-006HumanColorectumFAP8.27e-14-3.33e-01-0.0994
4898NRDCA015-C-106HumanColorectumFAP1.17e-11-2.84e-01-0.0511
4898NRDCA002-C-114HumanColorectumFAP2.55e-13-2.77e-01-0.1561
4898NRDCA015-C-104HumanColorectumFAP8.26e-27-1.95e-01-0.1899
Page: 1 2 3 4 5 6 7 8 9 

check button Transcriptomic changes along malignancy continuum.
TissueExpression DynamicsAbbreviation
Colorectum (GSE201348)The image shows the transcriptomic changes along malignancy continuum.log2FC in expression of this searched gene in stem-like cells from each diseased tissue sample relative to stem-like cells in normal samples in each tissue plotted against the malignancy continuum. Samples are colored based on if they are from different disease stage.FAP: Familial adenomatous polyposis
CRC: Colorectal cancer
Colorectum (HTA11)The image shows the transcriptomic changes along malignancy continuum.log2FC in expression of this searched gene in stem-like cells from each diseased tissue sample relative to stem-like cells in normal samples in each tissue plotted against the malignancy continuum. Samples are colored based on if they are from different disease stage.AD: Adenomas
SER: Sessile serrated lesions
MSI-H: Microsatellite-high colorectal cancer
MSS: Microsatellite stable colorectal cancer
EsophagusThe image shows the transcriptomic changes along malignancy continuum.log2FC in expression of this searched gene in stem-like cells from each diseased tissue sample relative to stem-like cells in normal samples in each tissue plotted against the malignancy continuum. Samples are colored based on if they are from different disease stage.ESCC: Esophageal squamous cell carcinoma
HGIN: High-grade intraepithelial neoplasias
LGIN: Low-grade intraepithelial neoplasias
LiverThe image shows the transcriptomic changes along malignancy continuum.log2FC in expression of this searched gene in stem-like cells from each diseased tissue sample relative to stem-like cells in normal samples in each tissue plotted against the malignancy continuum. Samples are colored based on if they are from different disease stage.
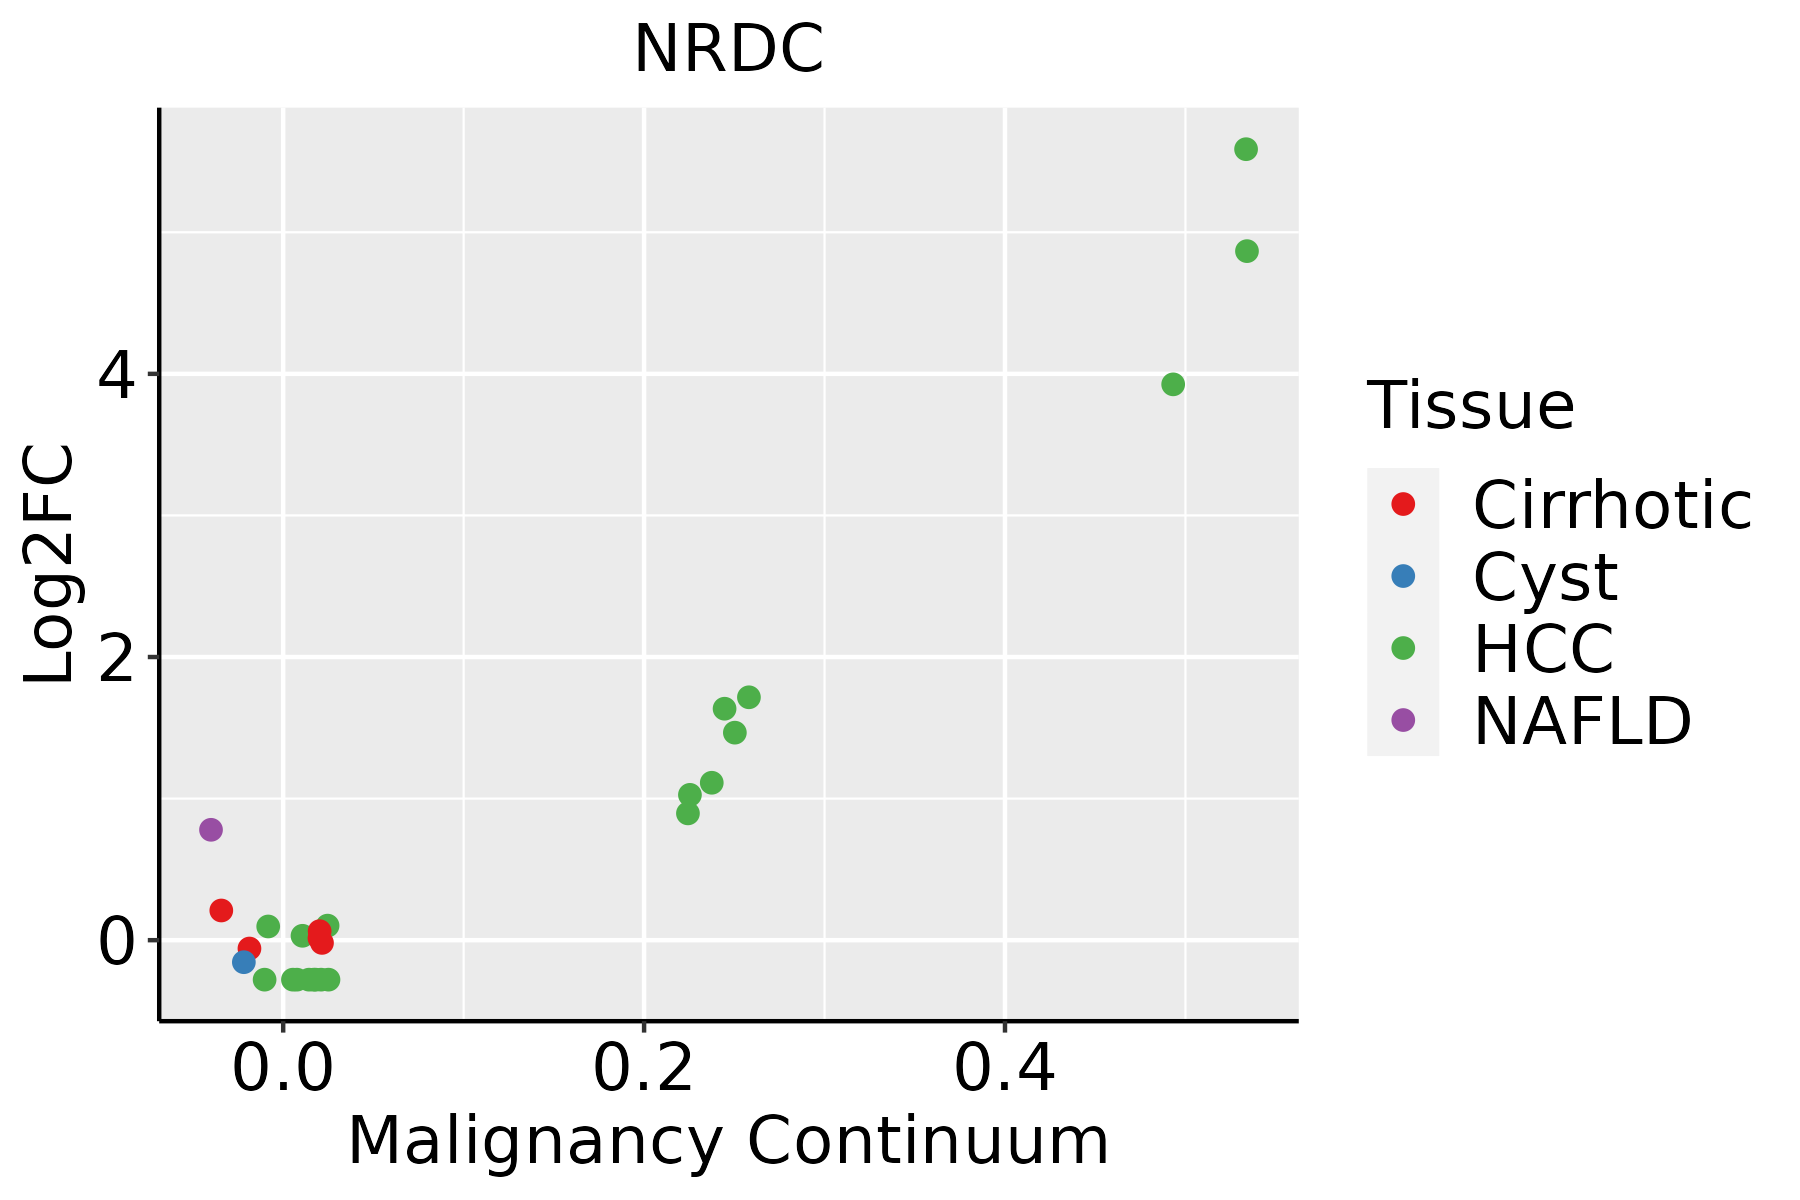
HCC: Hepatocellular carcinoma
NAFLD: Non-alcoholic fatty liver disease
LungThe image shows the transcriptomic changes along malignancy continuum.log2FC in expression of this searched gene in stem-like cells from each diseased tissue sample relative to stem-like cells in normal samples in each tissue plotted against the malignancy continuum. Samples are colored based on if they are from different disease stage.
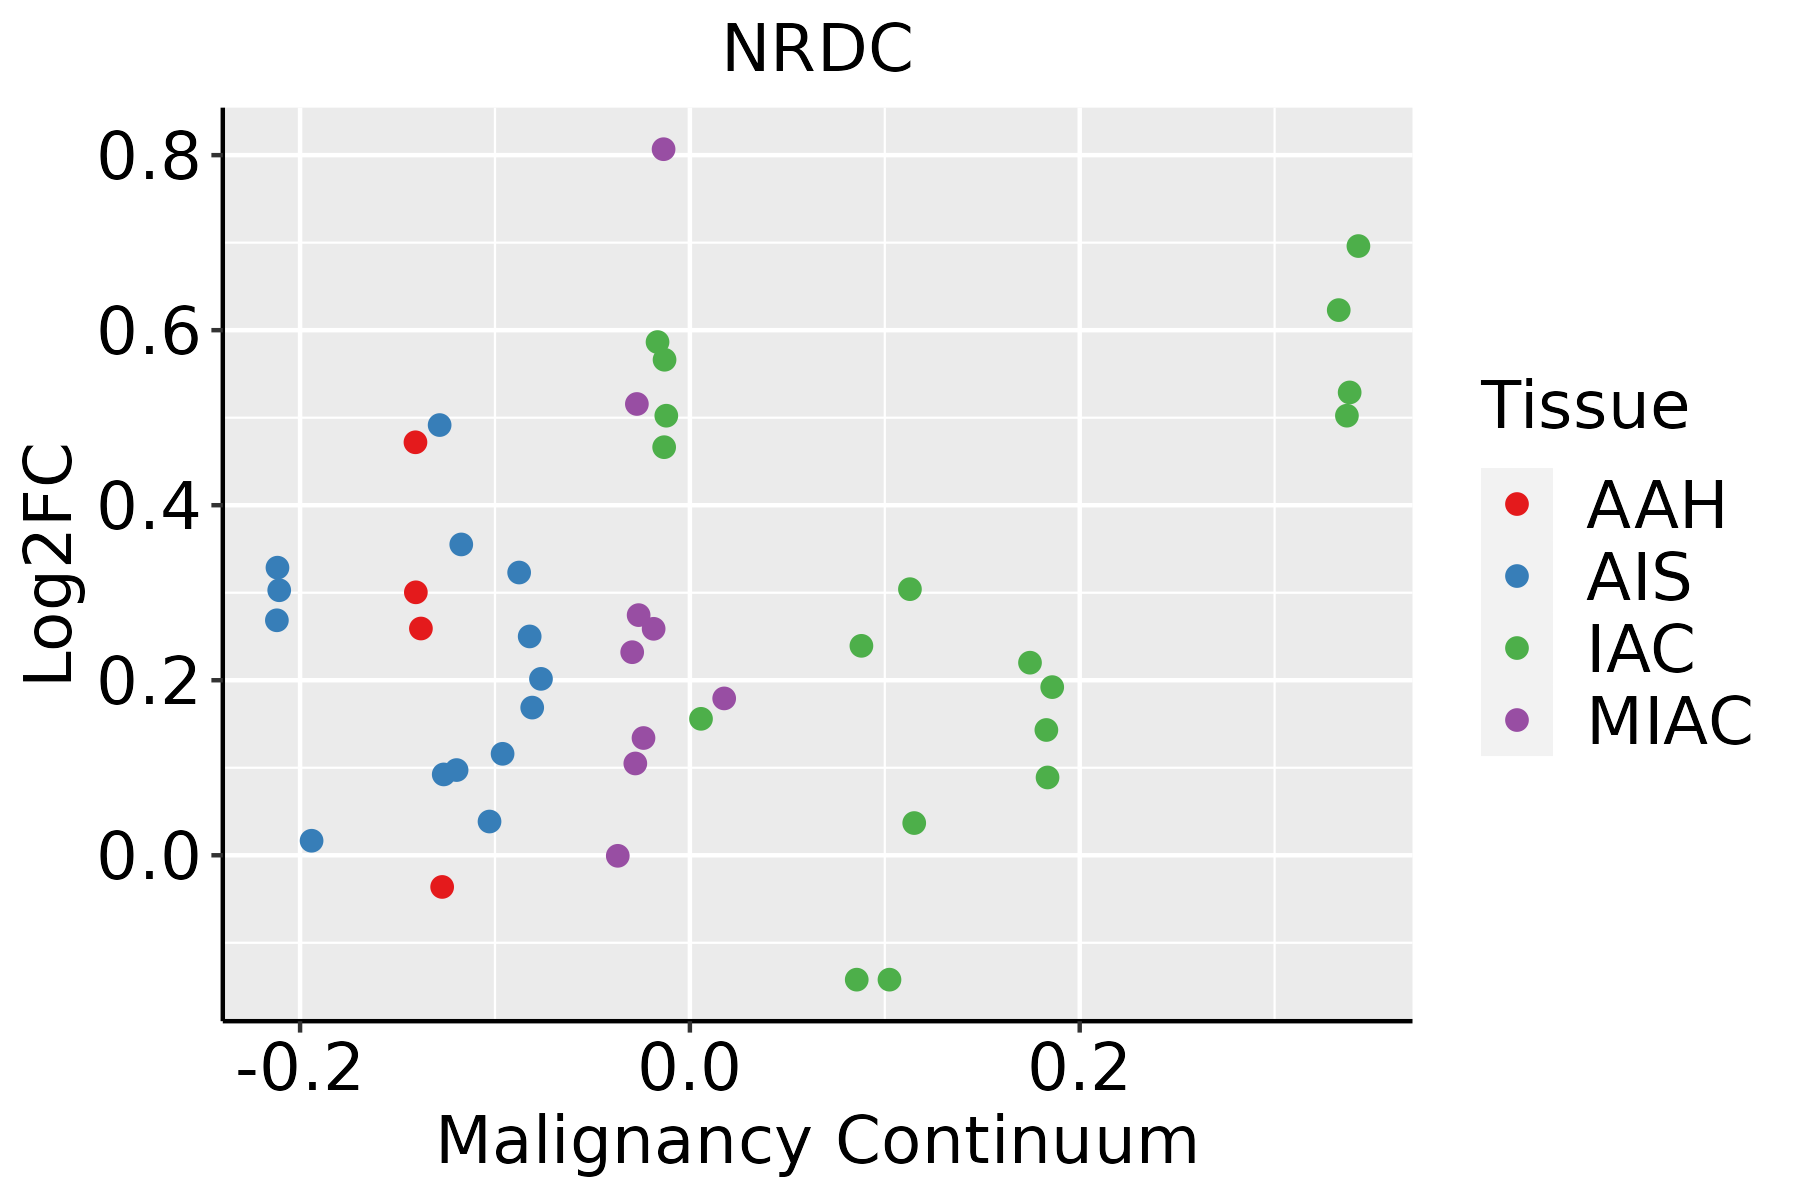
AAH: Atypical adenomatous hyperplasia
AIS: Adenocarcinoma in situ
IAC: Invasive lung adenocarcinoma
MIA: Minimally invasive adenocarcinoma
Oral CavityThe image shows the transcriptomic changes along malignancy continuum.log2FC in expression of this searched gene in stem-like cells from each diseased tissue sample relative to stem-like cells in normal samples in each tissue plotted against the malignancy continuum. Samples are colored based on if they are from different disease stage.
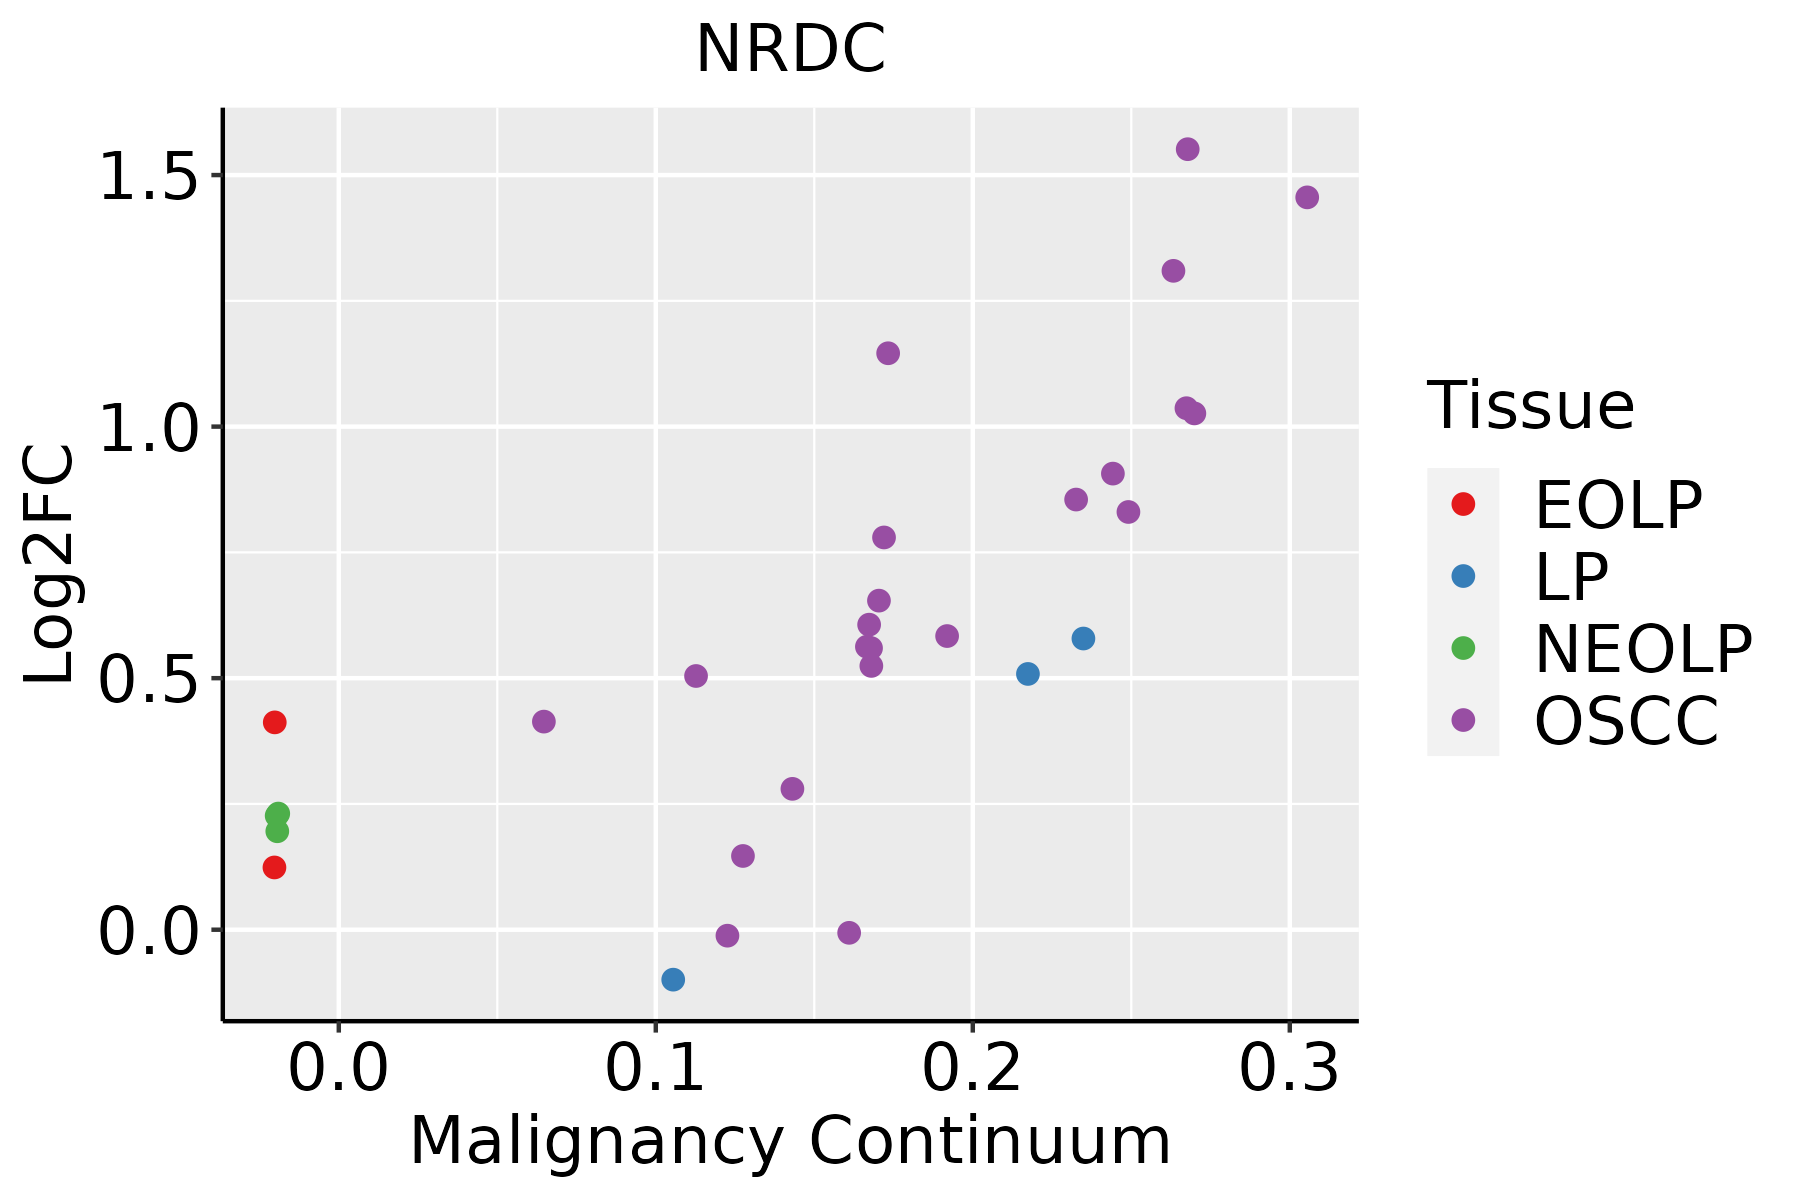
EOLP: Erosive Oral lichen planus
LP: leukoplakia
NEOLP: Non-erosive oral lichen planus
OSCC: Oral squamous cell carcinoma
ThyroidThe image shows the transcriptomic changes along malignancy continuum.log2FC in expression of this searched gene in stem-like cells from each diseased tissue sample relative to stem-like cells in normal samples in each tissue plotted against the malignancy continuum. Samples are colored based on if they are from different disease stage.
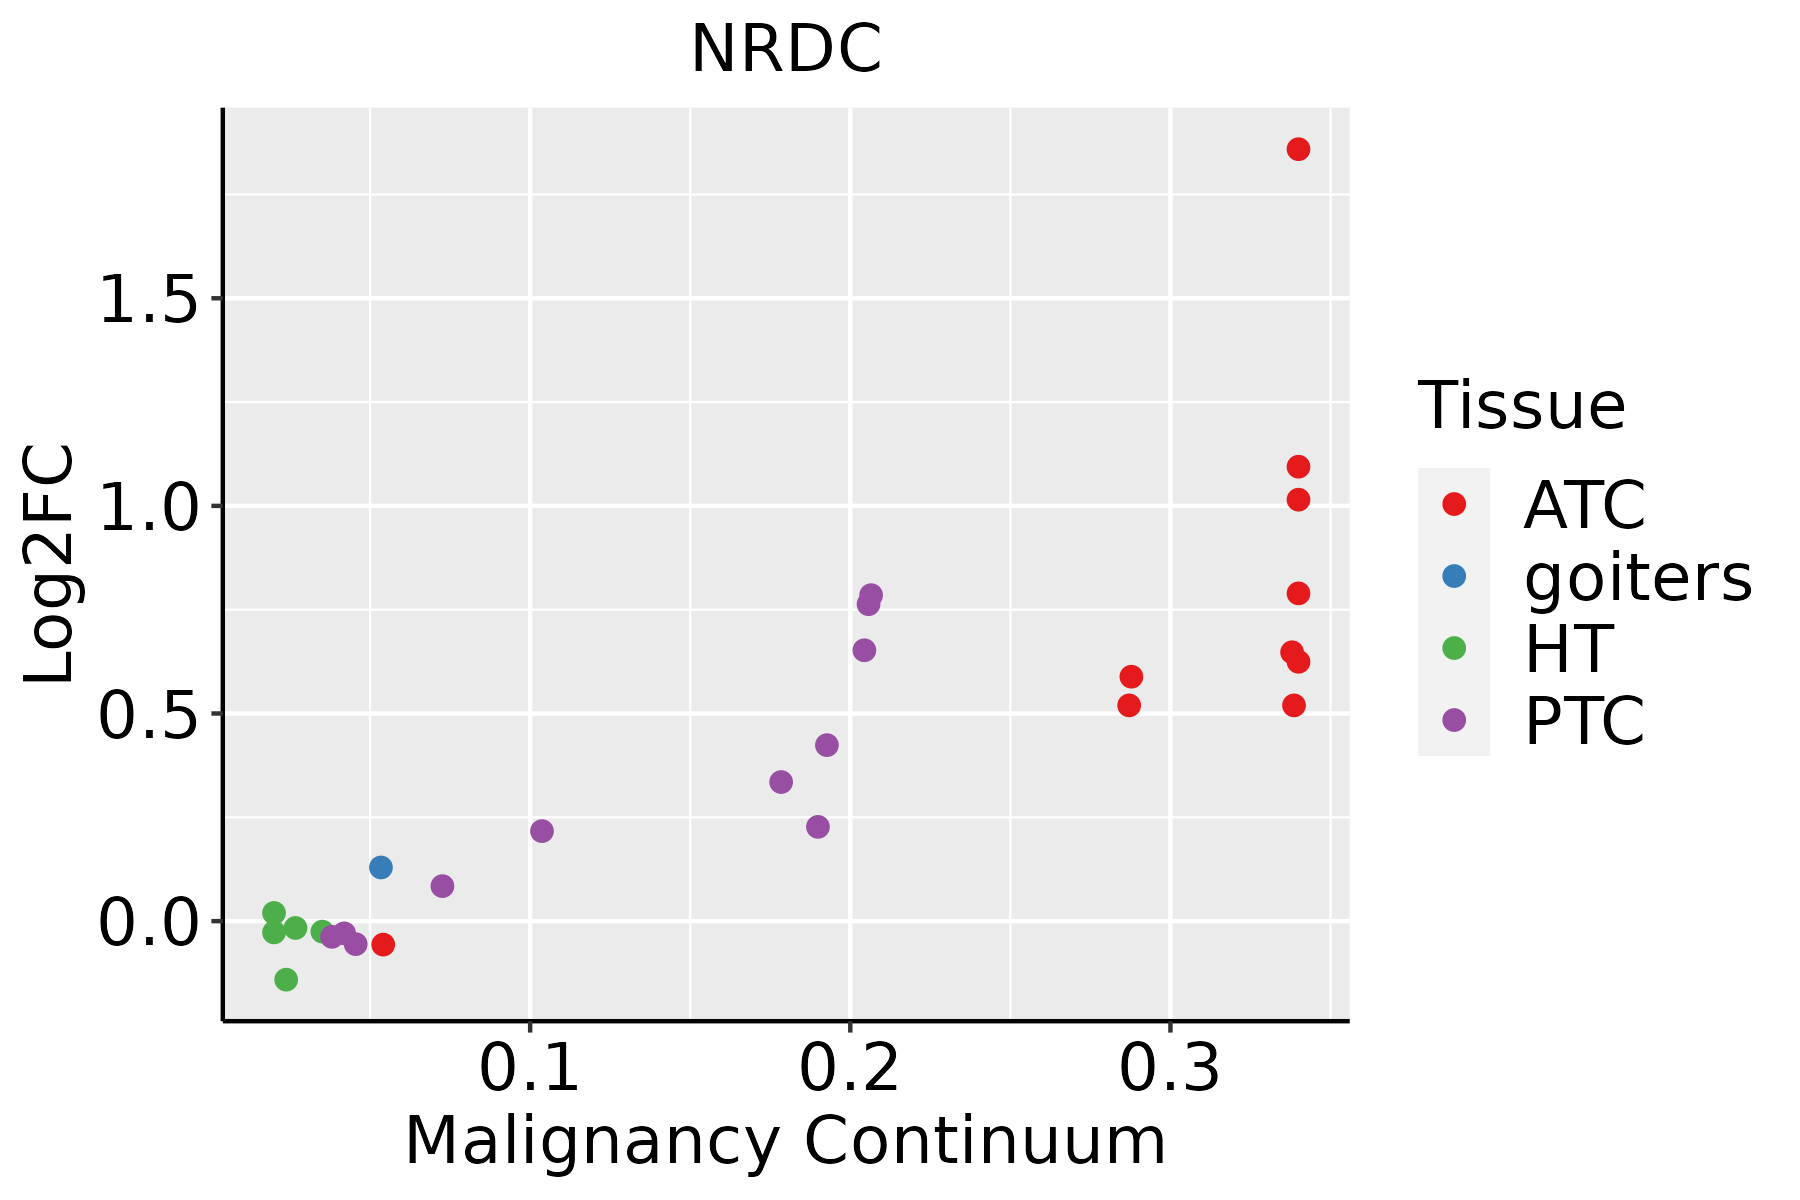
ATC: Anaplastic thyroid cancer
HT: Hashimoto's thyroiditis
PTC: Papillary thyroid cancer
∗log2FC in expression of this searched gene in stem-like cells from each diseased tissue sample relative to stem-like cells in normal samples in each tissue plotted against the malignancy continuum. Samples are colored based on if they are from different disease stage.

Top

Malignant transformation related pathway analysis

check buttonFind out the enriched GO biological processes and KEGG pathways involved in transition from healthy to precancer to cancer
check button Figure of enriched GO biological processes.
TissueDisease StageEnriched GO biological Processes
ColorectumADGO analysis - Figure of enriched GO biological processes: Top 15 enriched GO BP terms are showed in the bar plot of each disease state in each tissue. Each row represents a significant GO biological process which is colored according to the -log10(p.adjust).
ColorectumSERGO analysis - Figure of enriched GO biological processes: Top 15 enriched GO BP terms are showed in the bar plot of each disease state in each tissue. Each row represents a significant GO biological process which is colored according to the -log10(p.adjust).
ColorectumMSSGO analysis - Figure of enriched GO biological processes: Top 15 enriched GO BP terms are showed in the bar plot of each disease state in each tissue. Each row represents a significant GO biological process which is colored according to the -log10(p.adjust).
ColorectumMSI-HGO analysis - Figure of enriched GO biological processes: Top 15 enriched GO BP terms are showed in the bar plot of each disease state in each tissue. Each row represents a significant GO biological process which is colored according to the -log10(p.adjust).
ColorectumFAPGO analysis - Figure of enriched GO biological processes: Top 15 enriched GO BP terms are showed in the bar plot of each disease state in each tissue. Each row represents a significant GO biological process which is colored according to the -log10(p.adjust).
∗Top 15 enriched GO BP terms are showed in the bar plot of each disease state in each tissue. Each row represents a significant GO biological process which is colored according to the -log10(p.adjust).
Page: 1 2 3 4 5 6 7 8 9 

check button Enriched GO biological processes.
GO IDTissueDisease StageDescriptionGene RatioBg Ratiopvaluep.adjustCount
GO:0042176ColorectumADregulation of protein catabolic process160/3918391/187231.06e-197.34e-17160
GO:0009896ColorectumADpositive regulation of catabolic process180/3918492/187234.33e-161.94e-13180
GO:0031331ColorectumADpositive regulation of cellular catabolic process156/3918427/187234.68e-141.05e-11156
GO:0045732ColorectumADpositive regulation of protein catabolic process92/3918231/187233.85e-114.47e-0992
GO:0045862ColorectumADpositive regulation of proteolysis129/3918372/187234.04e-103.46e-08129
GO:0052547ColorectumADregulation of peptidase activity137/3918461/187234.12e-061.12e-04137
GO:0052548ColorectumADregulation of endopeptidase activity124/3918432/187236.58e-051.07e-03124
GO:0033619ColorectumADmembrane protein proteolysis21/391857/187234.16e-032.88e-0221
GO:0106106ColorectumADcold-induced thermogenesis43/3918144/187237.05e-034.31e-0243
GO:0120161ColorectumADregulation of cold-induced thermogenesis43/3918144/187237.05e-034.31e-0243
GO:1990845ColorectumADadaptive thermogenesis46/3918157/187237.97e-034.73e-0246
GO:00421762ColorectumMSSregulation of protein catabolic process145/3467391/187232.03e-181.17e-15145
GO:00098962ColorectumMSSpositive regulation of catabolic process163/3467492/187233.10e-159.22e-13163
GO:00313312ColorectumMSSpositive regulation of cellular catabolic process140/3467427/187237.02e-131.33e-10140
GO:00457322ColorectumMSSpositive regulation of protein catabolic process85/3467231/187233.66e-114.57e-0985
GO:00458622ColorectumMSSpositive regulation of proteolysis119/3467372/187232.14e-102.09e-08119
GO:00525472ColorectumMSSregulation of peptidase activity130/3467461/187231.81e-078.13e-06130
GO:00525482ColorectumMSSregulation of endopeptidase activity117/3467432/187236.25e-061.65e-04117
GO:00336191ColorectumMSSmembrane protein proteolysis20/346757/187232.23e-031.84e-0220
GO:0006509ColorectumMSSmembrane protein ectodomain proteolysis15/346743/187238.06e-034.91e-0215
Page: 1 2 3 4 5 6 7 8 9 

check button Enriched KEGG pathways.
Pathway IDTissueDisease StageDescriptionGene RatioBg Ratiopvaluep.adjustqvalueCount
Page: 1 

Top

Cell-cell communication analysis

check buttonIdentification of potential cell-cell interactions between two cell types and their ligand-receptor pairs for different disease states
LigandReceptorLRpairPathwayTissueDisease Stage
Page: 1 

Top

Single-cell gene regulatory network inference analysis

check buttonFind out the significant the regulons (TFs) and the target genes of each regulon across cell types for different disease states
TFCell TypeTissueDisease StageTarget GeneRSSRegulon Activity
∗The dot plots of a searched regulon are shown for all cell subpopulations in each disease state of each tissue based on the regulon specific score inferred using pySCENIC and by calculating the average expression.
Page: 1 

Top

Somatic mutation of malignant transformation related genes

check buttonAnnotation of somatic variants for genes involved in malignant transformation
Hugo SymbolVariant ClassVariant ClassificationdbSNP RSHGVScHGVSpHGVSp ShortSWISSPROTBIOTYPESIFTPolyPhenTumor Sample BarcodeTissueHistologySexAgeStageTherapy TypesDrugsOutcome
NRDCSNVMissense_Mutationc.3193N>Cp.Glu1065Glnp.E1065Qprotein_codingdeleterious(0.04)possibly_damaging(0.905)TCGA-5L-AAT0-01Breastbreast invasive carcinomaFemale<65I/IIHormone TherapytamoxiphenSD
NRDCSNVMissense_Mutationnovelc.2839N>Cp.Asp947Hisp.D947Hprotein_codingdeleterious(0.02)benign(0.046)TCGA-5L-AAT1-01Breastbreast invasive carcinomaFemale<65III/IVHormone TherapyletrozolSD
NRDCSNVMissense_Mutationnovelc.890C>Ap.Pro297Glnp.P297Qprotein_codingtolerated(0.11)probably_damaging(0.964)TCGA-A2-A25A-01Breastbreast invasive carcinomaFemale<65I/IIUnspecificCytoxanSD
NRDCSNVMissense_Mutationc.1057G>Ap.Glu353Lysp.E353Kprotein_codingdeleterious(0.04)possibly_damaging(0.742)TCGA-AC-A23H-01Breastbreast invasive carcinomaFemale>=65I/IIUnknownUnknownPD
NRDCSNVMissense_Mutationnovelc.3062G>Ap.Arg1021Glnp.R1021Qprotein_codingdeleterious(0)probably_damaging(0.999)TCGA-AN-A046-01Breastbreast invasive carcinomaFemale>=65I/IIUnknownUnknownSD
NRDCSNVMissense_Mutationc.210N>Cp.Gln70Hisp.Q70Hprotein_codingtolerated_low_confidence(0.06)benign(0.276)TCGA-AN-A0XN-01Breastbreast invasive carcinomaFemale>=65III/IVUnknownUnknownSD
NRDCSNVMissense_Mutationc.766T>Gp.Ser256Alap.S256Aprotein_codingtolerated_low_confidence(0.45)benign(0)TCGA-BH-A0BQ-01Breastbreast invasive carcinomaFemale<65I/IIUnknownUnknownPD
NRDCSNVMissense_Mutationc.3389C>Tp.Ser1130Leup.S1130Lprotein_codingtolerated(0.21)benign(0.001)TCGA-C8-A26Y-01Breastbreast invasive carcinomaFemale>=65I/IIUnknownUnknownSD
NRDCSNVMissense_Mutationnovelc.520N>Ap.Asp174Asnp.D174Nprotein_codingtolerated_low_confidence(0.3)benign(0.021)TCGA-GM-A2DO-01Breastbreast invasive carcinomaFemale<65I/IIHormone TherapytamoxiphenCR
NRDCinsertionNonsense_Mutationnovelc.3125_3126insCAAATAAATAAACp.Phe1043LysfsTer2p.F1043Kfs*2protein_codingTCGA-AN-A03X-01Breastbreast invasive carcinomaFemale>=65I/IIUnknownUnknownSD
Page: 1 2 3 4 5 6 7 8 9 10 11 12 13 

Top

Related drugs of malignant transformation related genes

check buttonIdentification of chemicals and drugs interact with genes involved in malignant transfromation
(DGIdb 4.0)
Entrez IDSymbolCategoryInteraction TypesDrug Claim NameDrug NamePMIDs
Page: 1