
|
|||||
|
 | |
| |
| |
| |
| |
| |
|
Gene: NRCAM |
Gene summary for NRCAM |
| Gene information | Species | Human | Gene symbol | NRCAM | Gene ID | 4897 |
| Gene name | neuronal cell adhesion molecule | |
| Gene Alias | NRCAM | |
| Cytomap | 7q31.1 | |
| Gene Type | protein-coding | GO ID | GO:0000902 | UniProtAcc | Q14CA1 |
Top |
Malignant transformation analysis |
| Identification of the aberrant gene expression in precancerous and cancerous lesions by comparing the gene expression of stem-like cells in diseased tissues with normal stem cells |
| Entrez ID | Symbol | Replicates | Species | Organ | Tissue | Adj P-value | Log2FC | Malignancy |
| 4897 | NRCAM | AEH-subject1 | Human | Endometrium | AEH | 1.04e-03 | 2.64e-01 | -0.3059 |
| 4897 | NRCAM | AEH-subject2 | Human | Endometrium | AEH | 1.69e-07 | 3.42e-01 | -0.2525 |
| 4897 | NRCAM | EEC-subject1 | Human | Endometrium | EEC | 4.32e-35 | 7.76e-01 | -0.2682 |
| 4897 | NRCAM | EEC-subject2 | Human | Endometrium | EEC | 1.96e-05 | 3.68e-01 | -0.2607 |
| 4897 | NRCAM | EEC-subject5 | Human | Endometrium | EEC | 7.89e-11 | 4.22e-01 | -0.249 |
| 4897 | NRCAM | GSM6177621_NYU_UCEC2_lib1_lib1 | Human | Endometrium | EEC | 2.43e-02 | 1.89e-01 | -0.1934 |
| 4897 | NRCAM | LZE7T | Human | Esophagus | ESCC | 2.41e-06 | 5.29e-01 | 0.0667 |
| 4897 | NRCAM | P9T-E | Human | Esophagus | ESCC | 1.71e-09 | 2.75e-01 | 0.1131 |
| 4897 | NRCAM | P12T-E | Human | Esophagus | ESCC | 1.42e-10 | 3.46e-01 | 0.1122 |
| 4897 | NRCAM | P16T-E | Human | Esophagus | ESCC | 1.31e-11 | 3.05e-01 | 0.1153 |
| 4897 | NRCAM | P26T-E | Human | Esophagus | ESCC | 1.37e-23 | 7.63e-01 | 0.1276 |
| 4897 | NRCAM | P27T-E | Human | Esophagus | ESCC | 2.86e-04 | 2.35e-01 | 0.1055 |
| 4897 | NRCAM | P30T-E | Human | Esophagus | ESCC | 1.53e-02 | 1.68e-01 | 0.137 |
| 4897 | NRCAM | P32T-E | Human | Esophagus | ESCC | 7.98e-04 | 1.71e-01 | 0.1666 |
| 4897 | NRCAM | P48T-E | Human | Esophagus | ESCC | 1.63e-06 | 1.92e-01 | 0.0959 |
| 4897 | NRCAM | P52T-E | Human | Esophagus | ESCC | 5.76e-11 | 3.64e-01 | 0.1555 |
| 4897 | NRCAM | P61T-E | Human | Esophagus | ESCC | 1.69e-10 | 2.39e-01 | 0.099 |
| 4897 | NRCAM | P74T-E | Human | Esophagus | ESCC | 1.97e-04 | 2.08e-01 | 0.1479 |
| 4897 | NRCAM | P76T-E | Human | Esophagus | ESCC | 3.31e-07 | 1.64e-01 | 0.1207 |
| 4897 | NRCAM | P83T-E | Human | Esophagus | ESCC | 1.17e-09 | 3.21e-01 | 0.1738 |
| Page: 1 2 |
| Tissue | Expression Dynamics | Abbreviation |
| Endometrium | 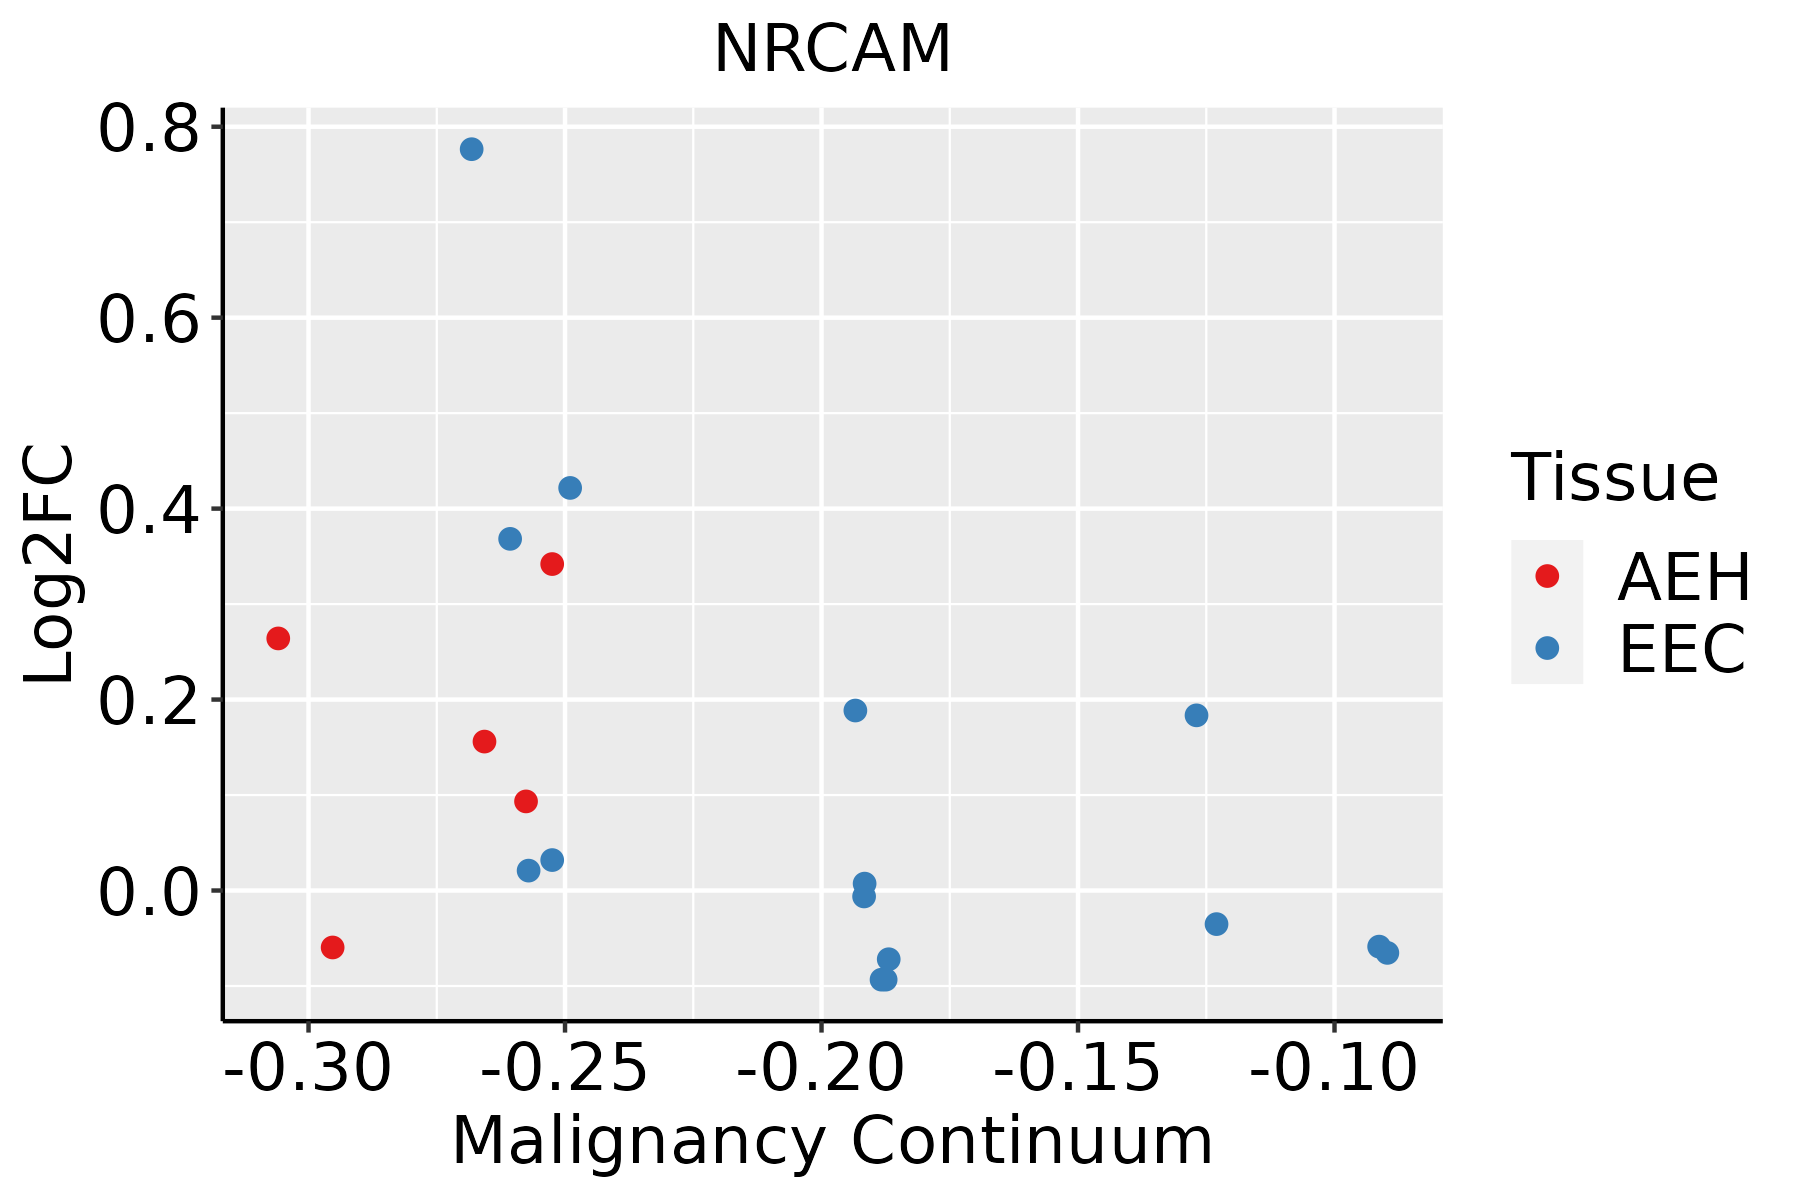 | AEH: Atypical endometrial hyperplasia |
| EEC: Endometrioid Cancer | ||
| Esophagus | 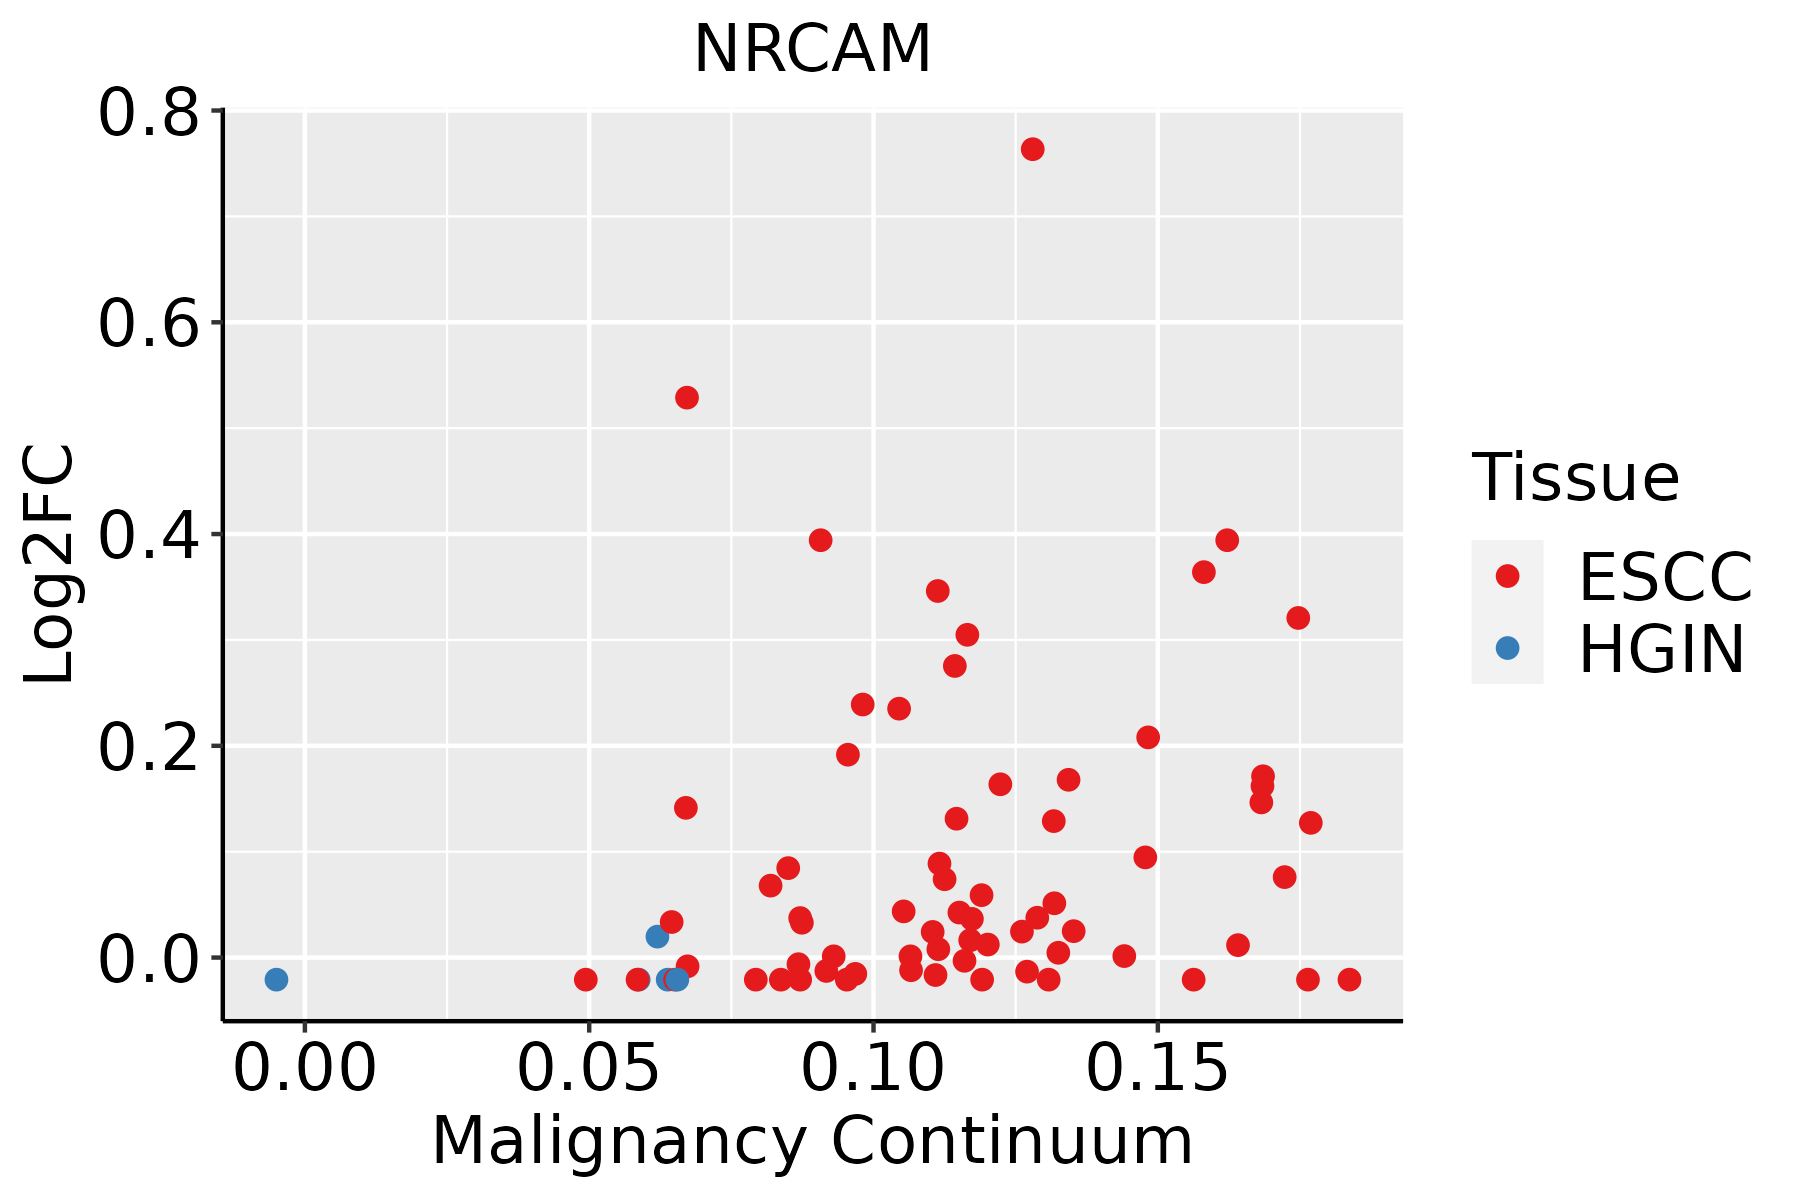 | ESCC: Esophageal squamous cell carcinoma |
| HGIN: High-grade intraepithelial neoplasias | ||
| LGIN: Low-grade intraepithelial neoplasias | ||
| Liver |  | HCC: Hepatocellular carcinoma |
| NAFLD: Non-alcoholic fatty liver disease | ||
| Thyroid |  | ATC: Anaplastic thyroid cancer |
| HT: Hashimoto's thyroiditis | ||
| PTC: Papillary thyroid cancer |
| ∗log2FC in expression of this searched gene in stem-like cells from each diseased tissue sample relative to stem-like cells in normal samples in each tissue plotted against the malignancy continuum. Samples are colored based on if they are from different disease stage. |
Top |
Malignant transformation related pathway analysis |
| Find out the enriched GO biological processes and KEGG pathways involved in transition from healthy to precancer to cancer |
| Tissue | Disease Stage | Enriched GO biological Processes |
| Colorectum | AD |  |
| Colorectum | SER |  |
| Colorectum | MSS |  |
| Colorectum | MSI-H |  |
| Colorectum | FAP |  |
| ∗Top 15 enriched GO BP terms are showed in the bar plot of each disease state in each tissue. Each row represents a significant GO biological process which is colored according to the -log10(p.adjust). |
| Page: 1 2 3 4 5 6 7 8 9 |
| GO ID | Tissue | Disease Stage | Description | Gene Ratio | Bg Ratio | pvalue | p.adjust | Count |
| GO:00160499 | Endometrium | AEH | cell growth | 93/2100 | 482/18723 | 1.00e-07 | 4.99e-06 | 93 |
| GO:003253510 | Endometrium | AEH | regulation of cellular component size | 78/2100 | 383/18723 | 1.10e-07 | 5.29e-06 | 78 |
| GO:00605607 | Endometrium | AEH | developmental growth involved in morphogenesis | 53/2100 | 234/18723 | 4.02e-07 | 1.67e-05 | 53 |
| GO:00074098 | Endometrium | AEH | axonogenesis | 81/2100 | 418/18723 | 5.54e-07 | 2.12e-05 | 81 |
| GO:00615648 | Endometrium | AEH | axon development | 88/2100 | 467/18723 | 6.39e-07 | 2.38e-05 | 88 |
| GO:00343299 | Endometrium | AEH | cell junction assembly | 78/2100 | 420/18723 | 4.80e-06 | 1.24e-04 | 78 |
| GO:00486757 | Endometrium | AEH | axon extension | 31/2100 | 120/18723 | 6.13e-06 | 1.50e-04 | 31 |
| GO:00015589 | Endometrium | AEH | regulation of cell growth | 75/2100 | 414/18723 | 1.79e-05 | 3.65e-04 | 75 |
| GO:00485887 | Endometrium | AEH | developmental cell growth | 48/2100 | 234/18723 | 2.39e-05 | 4.53e-04 | 48 |
| GO:19901386 | Endometrium | AEH | neuron projection extension | 38/2100 | 172/18723 | 3.03e-05 | 5.56e-04 | 38 |
| GO:00083616 | Endometrium | AEH | regulation of cell size | 38/2100 | 181/18723 | 9.69e-05 | 1.40e-03 | 38 |
| GO:00486387 | Endometrium | AEH | regulation of developmental growth | 58/2100 | 330/18723 | 3.45e-04 | 3.80e-03 | 58 |
| GO:00017642 | Endometrium | AEH | neuron migration | 31/2100 | 156/18723 | 1.08e-03 | 9.46e-03 | 31 |
| GO:00613872 | Endometrium | AEH | regulation of extent of cell growth | 23/2100 | 110/18723 | 2.27e-03 | 1.74e-02 | 23 |
| GO:00508086 | Endometrium | AEH | synapse organization | 67/2100 | 426/18723 | 2.67e-03 | 1.94e-02 | 67 |
| GO:00305166 | Endometrium | AEH | regulation of axon extension | 20/2100 | 95/18723 | 3.91e-03 | 2.64e-02 | 20 |
| GO:006156412 | Endometrium | EEC | axon development | 93/2168 | 467/18723 | 9.60e-08 | 4.69e-06 | 93 |
| GO:001604915 | Endometrium | EEC | cell growth | 95/2168 | 482/18723 | 1.16e-07 | 5.54e-06 | 95 |
| GO:003253516 | Endometrium | EEC | regulation of cellular component size | 79/2168 | 383/18723 | 1.98e-07 | 8.93e-06 | 79 |
| GO:006056013 | Endometrium | EEC | developmental growth involved in morphogenesis | 54/2168 | 234/18723 | 4.60e-07 | 1.78e-05 | 54 |
| Page: 1 2 3 4 |
| Pathway ID | Tissue | Disease Stage | Description | Gene Ratio | Bg Ratio | pvalue | p.adjust | qvalue | Count |
| Page: 1 |
Top |
Cell-cell communication analysis |
| Identification of potential cell-cell interactions between two cell types and their ligand-receptor pairs for different disease states |
| Ligand | Receptor | LRpair | Pathway | Tissue | Disease Stage |
| CNTN1 | NRCAM | CNTN1_NRCAM | CNTN | HNSCC | Precancer |
| CNTN1 | NRCAM | CNTN1_NRCAM | CNTN | Skin | AK |
| Page: 1 |
Top |
Single-cell gene regulatory network inference analysis |
| Find out the significant the regulons (TFs) and the target genes of each regulon across cell types for different disease states |
| TF | Cell Type | Tissue | Disease Stage | Target Gene | RSS | Regulon Activity |
| ∗The dot plots of a searched regulon are shown for all cell subpopulations in each disease state of each tissue based on the regulon specific score inferred using pySCENIC and by calculating the average expression. |
| Page: 1 |
Top |
Somatic mutation of malignant transformation related genes |
| Annotation of somatic variants for genes involved in malignant transformation |
| Hugo Symbol | Variant Class | Variant Classification | dbSNP RS | HGVSc | HGVSp | HGVSp Short | SWISSPROT | BIOTYPE | SIFT | PolyPhen | Tumor Sample Barcode | Tissue | Histology | Sex | Age | Stage | Therapy Types | Drugs | Outcome |
| NRCAM | SNV | Missense_Mutation | rs773133428 | c.2305N>A | p.Pro769Thr | p.P769T | Q92823 | protein_coding | deleterious(0) | probably_damaging(0.99) | TCGA-A2-A0EY-01 | Breast | breast invasive carcinoma | Female | <65 | I/II | Chemotherapy | adriamycin | SD |
| NRCAM | SNV | Missense_Mutation | c.2112N>T | p.Gln704His | p.Q704H | Q92823 | protein_coding | tolerated(0.52) | benign(0.003) | TCGA-A8-A097-01 | Breast | breast invasive carcinoma | Female | >=65 | I/II | Hormone Therapy | tamoxiphen | SD | |
| NRCAM | SNV | Missense_Mutation | c.756N>C | p.Leu252Phe | p.L252F | Q92823 | protein_coding | tolerated(0.4) | benign(0.129) | TCGA-AC-A23H-01 | Breast | breast invasive carcinoma | Female | >=65 | I/II | Unknown | Unknown | PD | |
| NRCAM | SNV | Missense_Mutation | c.47N>C | p.Arg16Thr | p.R16T | Q92823 | protein_coding | tolerated(0.24) | benign(0.039) | TCGA-AC-A23H-01 | Breast | breast invasive carcinoma | Female | >=65 | I/II | Unknown | Unknown | PD | |
| NRCAM | SNV | Missense_Mutation | c.47N>C | p.Arg16Thr | p.R16T | Q92823 | protein_coding | tolerated(0.24) | benign(0.039) | TCGA-D8-A27G-01 | Breast | breast invasive carcinoma | Female | >=65 | I/II | Unknown | Unknown | SD | |
| NRCAM | SNV | Missense_Mutation | c.2364N>C | p.Gln788His | p.Q788H | Q92823 | protein_coding | deleterious(0) | possibly_damaging(0.704) | TCGA-GM-A2D9-01 | Breast | breast invasive carcinoma | Female | >=65 | I/II | Hormone Therapy | arimidex | SD | |
| NRCAM | insertion | Frame_Shift_Ins | novel | c.3351_3352insACCC | p.Arg1118ThrfsTer36 | p.R1118Tfs*36 | Q92823 | protein_coding | TCGA-A8-A08H-01 | Breast | breast invasive carcinoma | Female | >=65 | I/II | Unknown | Unknown | SD | ||
| NRCAM | insertion | Frame_Shift_Ins | novel | c.3350_3351insA | p.Arg1118SerfsTer35 | p.R1118Sfs*35 | Q92823 | protein_coding | TCGA-A8-A08H-01 | Breast | breast invasive carcinoma | Female | >=65 | I/II | Unknown | Unknown | SD | ||
| NRCAM | deletion | Frame_Shift_Del | novel | c.3432delN | p.Phe1144LeufsTer2 | p.F1144Lfs*2 | Q92823 | protein_coding | TCGA-EW-A2FV-01 | Breast | breast invasive carcinoma | Female | <65 | III/IV | Chemotherapy | docetaxel | SD | ||
| NRCAM | SNV | Missense_Mutation | c.1126N>A | p.Glu376Lys | p.E376K | Q92823 | protein_coding | deleterious(0.02) | probably_damaging(0.996) | TCGA-BI-A0VR-01 | Cervix | cervical & endocervical cancer | Female | <65 | III/IV | Unknown | Unknown | SD |
| Page: 1 2 3 4 5 6 7 8 9 10 11 12 13 14 15 16 17 18 |
Top |
Related drugs of malignant transformation related genes |
| Identification of chemicals and drugs interact with genes involved in malignant transfromation |
| (DGIdb 4.0) |
| Entrez ID | Symbol | Category | Interaction Types | Drug Claim Name | Drug Name | PMIDs |
| Page: 1 |

Copyright 2023-Present -The University of Texas Health Science Center at Houston |