
|
|||||
|
 | |
| |
| |
| |
| |
| |
|
Gene: NRBP2 |
Gene summary for NRBP2 |
| Gene information | Species | Human | Gene symbol | NRBP2 | Gene ID | 340371 |
| Gene name | nuclear receptor binding protein 2 | |
| Gene Alias | TRG16 | |
| Cytomap | 8q24.3 | |
| Gene Type | protein-coding | GO ID | GO:0006464 | UniProtAcc | Q9NSY0 |
Top |
Malignant transformation analysis |
| Identification of the aberrant gene expression in precancerous and cancerous lesions by comparing the gene expression of stem-like cells in diseased tissues with normal stem cells |
| Entrez ID | Symbol | Replicates | Species | Organ | Tissue | Adj P-value | Log2FC | Malignancy |
| 340371 | NRBP2 | HCC1_Meng | Human | Liver | HCC | 6.50e-46 | 1.32e-01 | 0.0246 |
| 340371 | NRBP2 | HCC2_Meng | Human | Liver | HCC | 2.71e-16 | 9.88e-02 | 0.0107 |
| 340371 | NRBP2 | HCC1 | Human | Liver | HCC | 4.02e-04 | 2.66e+00 | 0.5336 |
| 340371 | NRBP2 | HCC2 | Human | Liver | HCC | 2.07e-12 | 3.09e+00 | 0.5341 |
| 340371 | NRBP2 | Pt13.b | Human | Liver | HCC | 1.02e-07 | 2.17e-01 | 0.0251 |
| 340371 | NRBP2 | S014 | Human | Liver | HCC | 2.89e-09 | 6.01e-01 | 0.2254 |
| 340371 | NRBP2 | S015 | Human | Liver | HCC | 3.73e-04 | 3.98e-01 | 0.2375 |
| 340371 | NRBP2 | S016 | Human | Liver | HCC | 1.15e-05 | 4.08e-01 | 0.2243 |
| 340371 | NRBP2 | S027 | Human | Liver | HCC | 1.86e-11 | 9.38e-01 | 0.2446 |
| 340371 | NRBP2 | S028 | Human | Liver | HCC | 5.93e-26 | 1.01e+00 | 0.2503 |
| 340371 | NRBP2 | S029 | Human | Liver | HCC | 2.63e-28 | 1.57e+00 | 0.2581 |
| 340371 | NRBP2 | C04 | Human | Oral cavity | OSCC | 2.43e-05 | 3.88e-01 | 0.2633 |
| 340371 | NRBP2 | C21 | Human | Oral cavity | OSCC | 3.61e-12 | 4.01e-01 | 0.2678 |
| 340371 | NRBP2 | C30 | Human | Oral cavity | OSCC | 6.04e-12 | 6.38e-01 | 0.3055 |
| 340371 | NRBP2 | C51 | Human | Oral cavity | OSCC | 7.78e-18 | 8.78e-01 | 0.2674 |
| 340371 | NRBP2 | C57 | Human | Oral cavity | OSCC | 4.73e-03 | 2.04e-01 | 0.1679 |
| 340371 | NRBP2 | C08 | Human | Oral cavity | OSCC | 1.76e-07 | 1.95e-01 | 0.1919 |
| 340371 | NRBP2 | SYSMH1 | Human | Oral cavity | OSCC | 8.49e-05 | 1.83e-01 | 0.1127 |
| 340371 | NRBP2 | SYSMH2 | Human | Oral cavity | OSCC | 5.01e-04 | 2.49e-01 | 0.2326 |
| 340371 | NRBP2 | SYSMH3 | Human | Oral cavity | OSCC | 1.21e-14 | 4.25e-01 | 0.2442 |
| Page: 1 2 |
| Tissue | Expression Dynamics | Abbreviation |
| Liver | 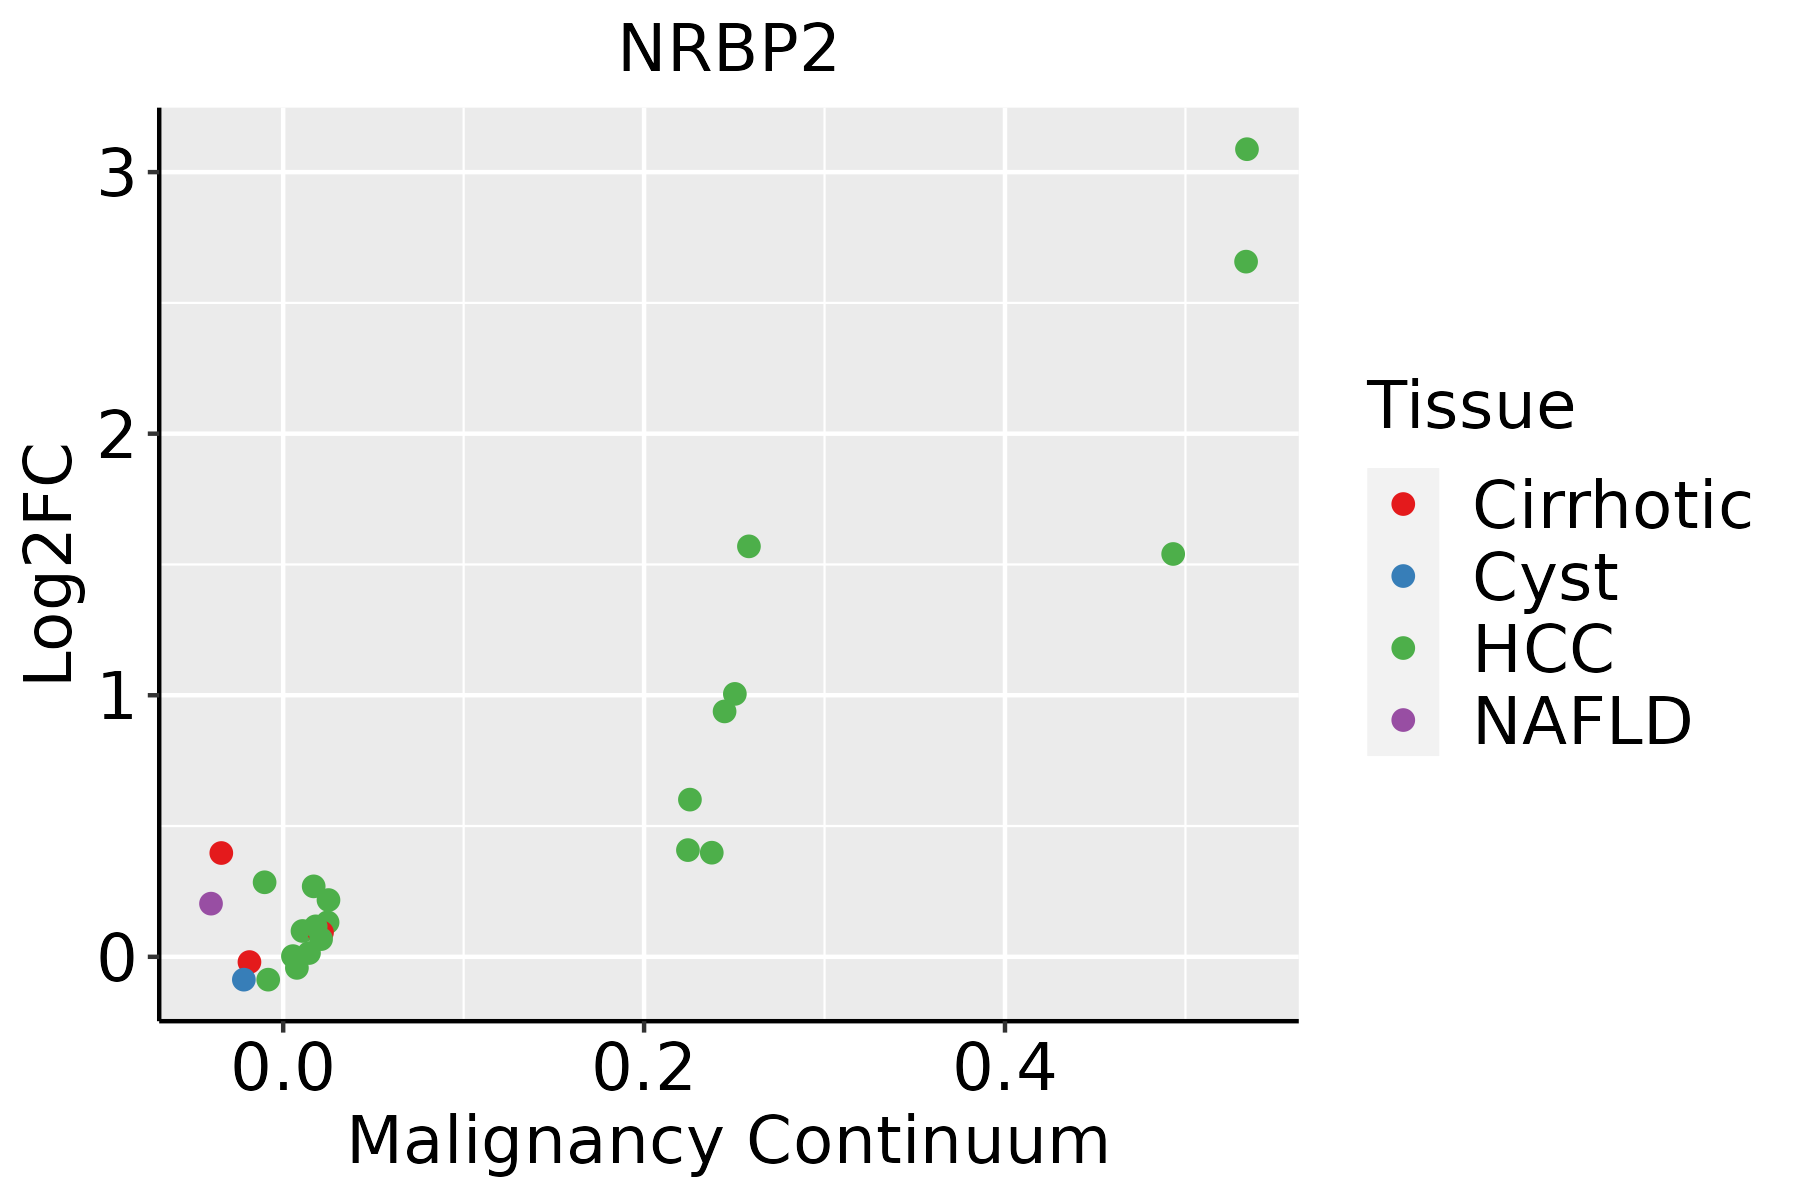 | HCC: Hepatocellular carcinoma |
| NAFLD: Non-alcoholic fatty liver disease | ||
| Oral Cavity | 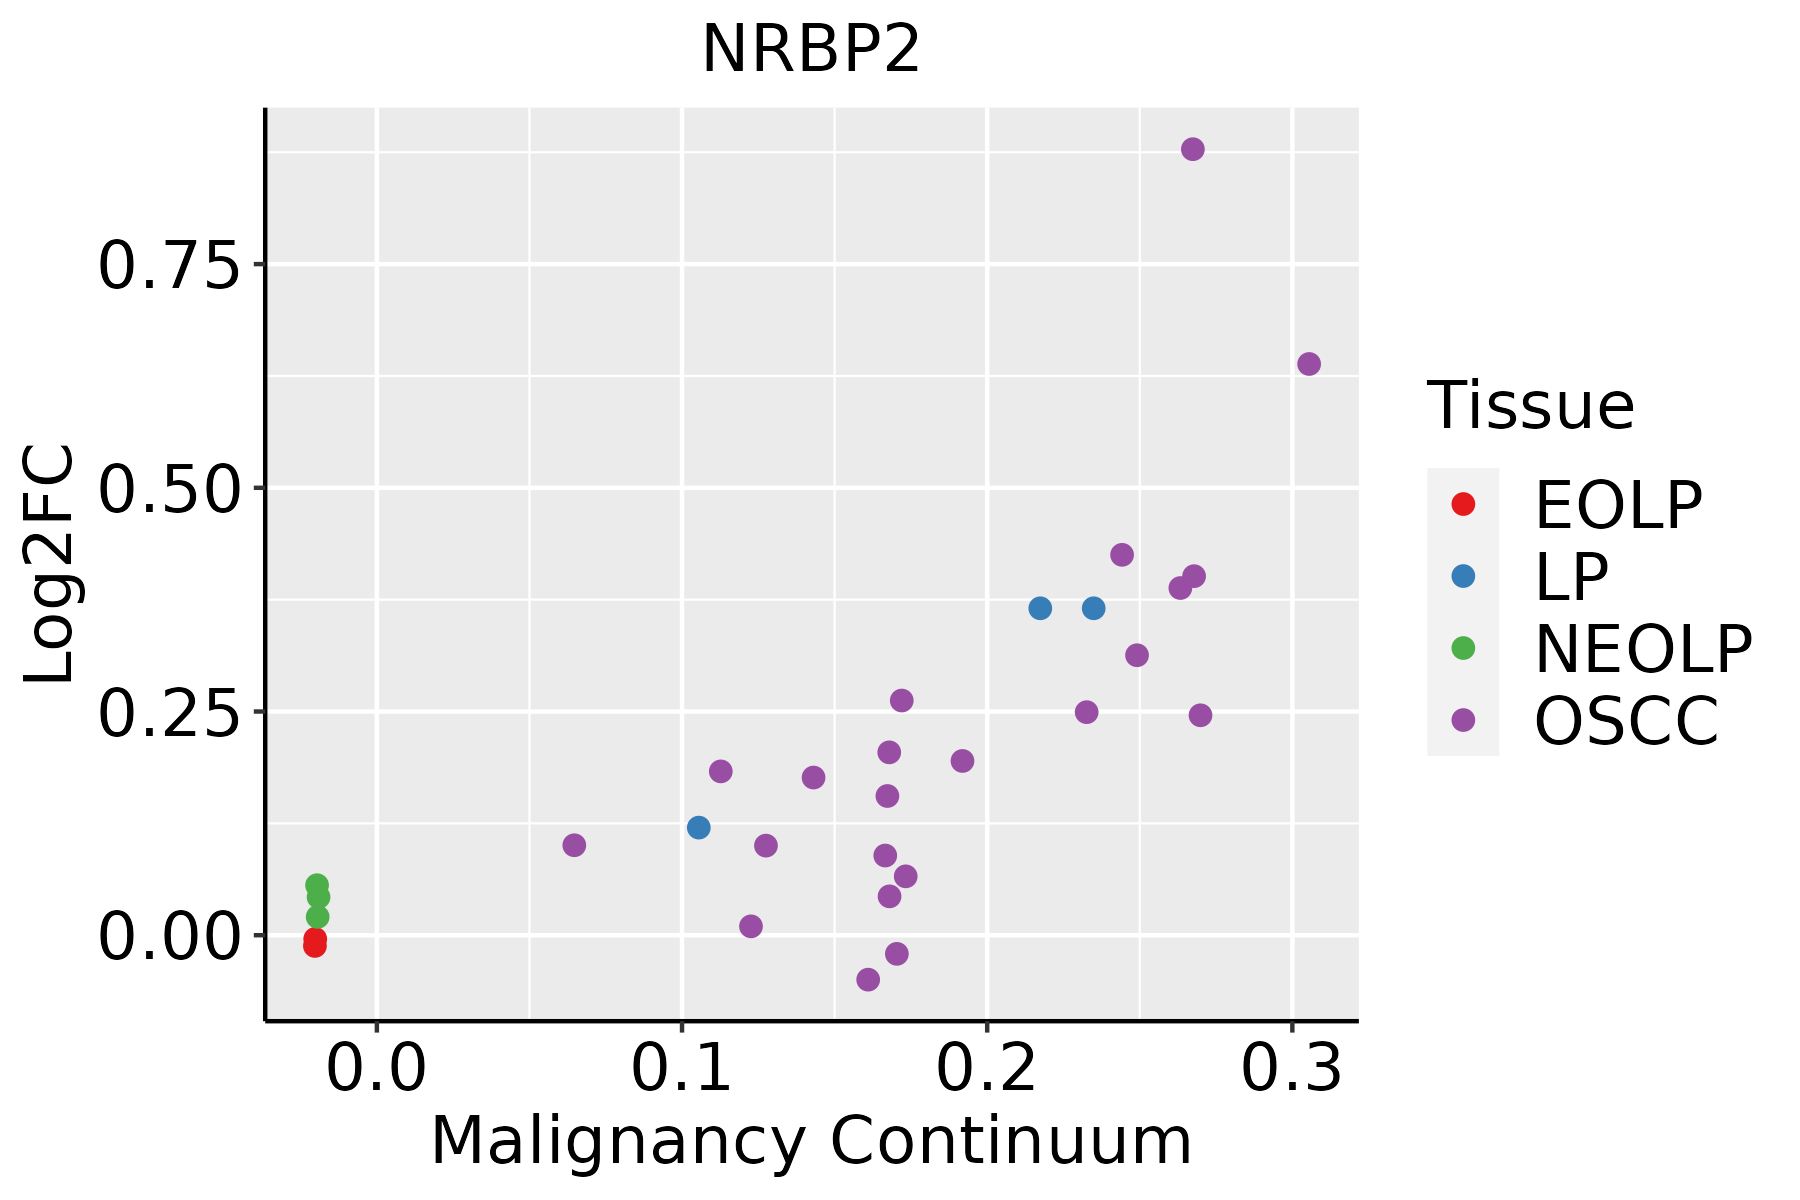 | EOLP: Erosive Oral lichen planus |
| LP: leukoplakia | ||
| NEOLP: Non-erosive oral lichen planus | ||
| OSCC: Oral squamous cell carcinoma | ||
| Thyroid | 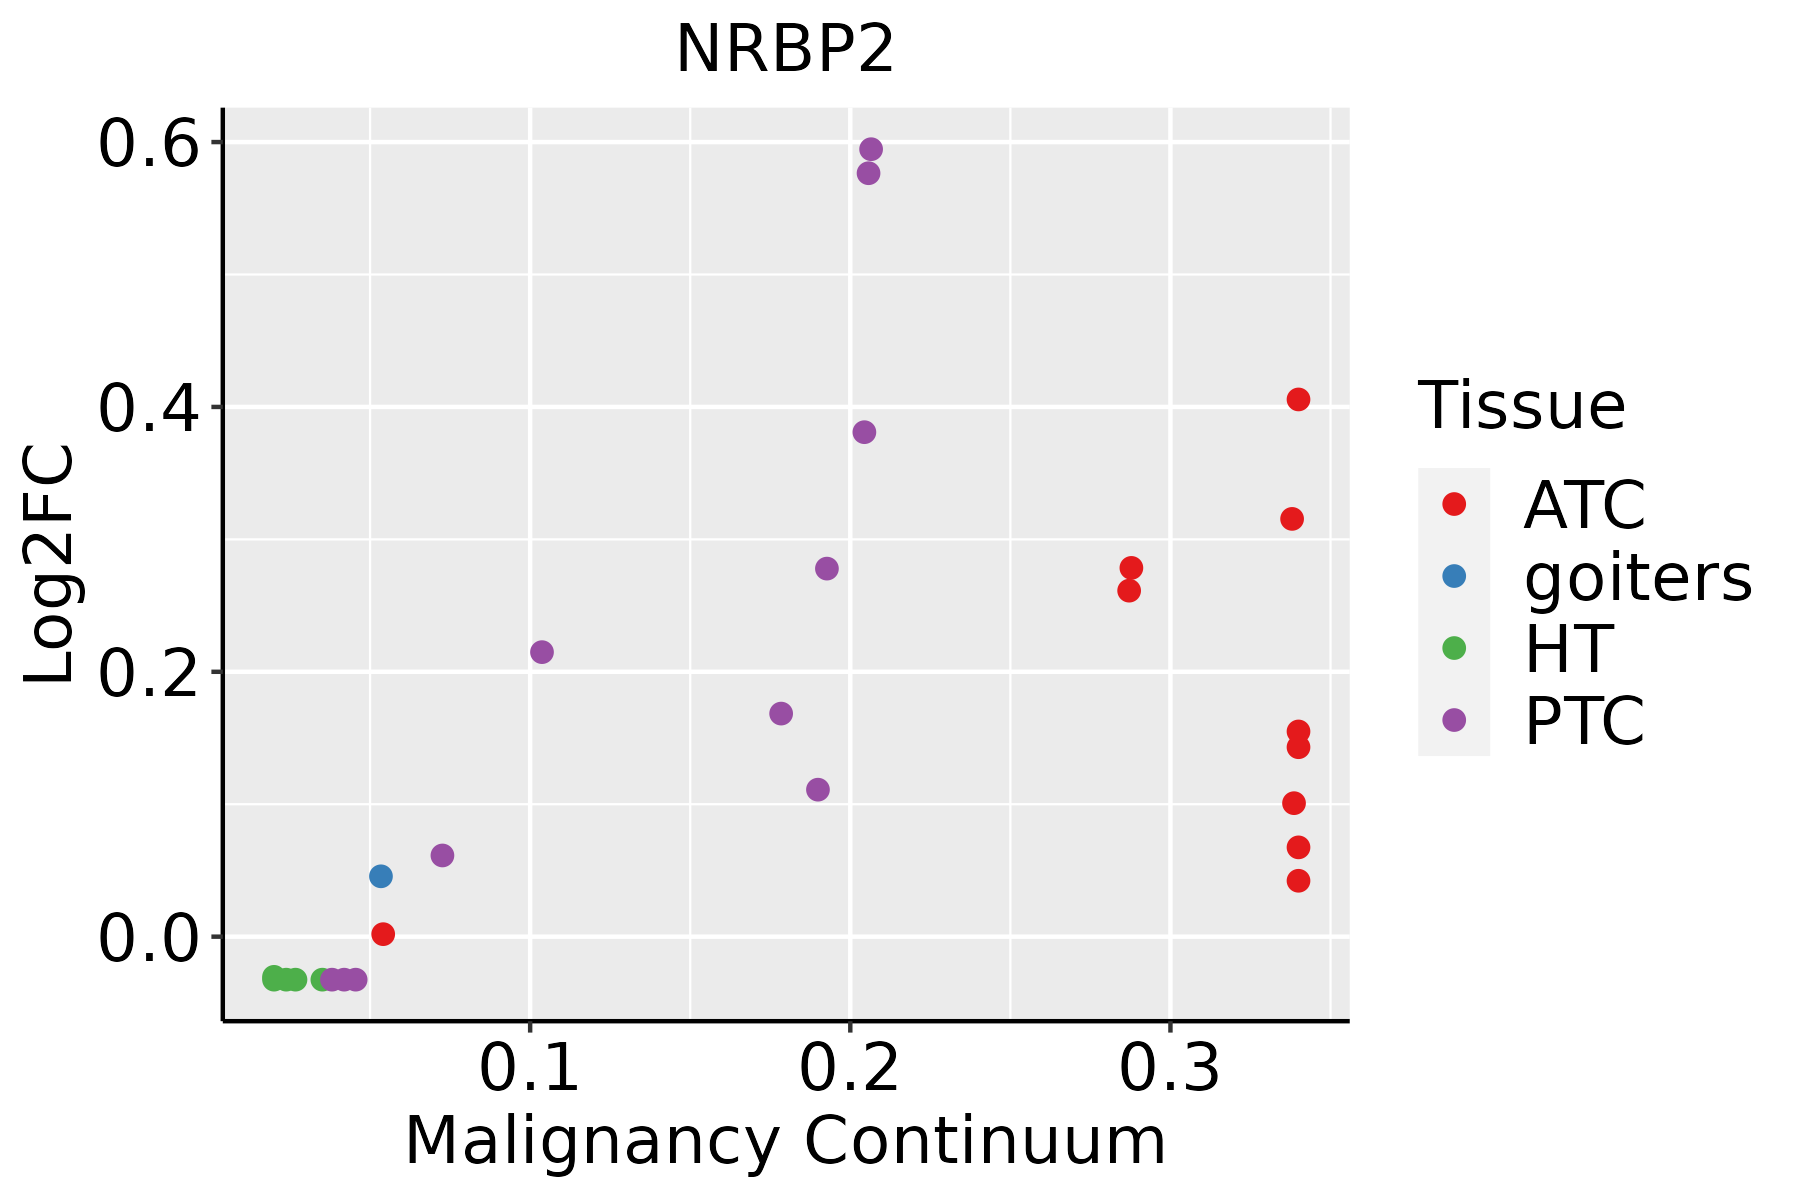 | ATC: Anaplastic thyroid cancer |
| HT: Hashimoto's thyroiditis | ||
| PTC: Papillary thyroid cancer |
| ∗log2FC in expression of this searched gene in stem-like cells from each diseased tissue sample relative to stem-like cells in normal samples in each tissue plotted against the malignancy continuum. Samples are colored based on if they are from different disease stage. |
Top |
Malignant transformation related pathway analysis |
| Find out the enriched GO biological processes and KEGG pathways involved in transition from healthy to precancer to cancer |
| Tissue | Disease Stage | Enriched GO biological Processes |
| Colorectum | AD |  |
| Colorectum | SER |  |
| Colorectum | MSS |  |
| Colorectum | MSI-H |  |
| Colorectum | FAP |  |
| ∗Top 15 enriched GO BP terms are showed in the bar plot of each disease state in each tissue. Each row represents a significant GO biological process which is colored according to the -log10(p.adjust). |
| Page: 1 2 3 4 5 6 7 8 9 |
| GO ID | Tissue | Disease Stage | Description | Gene Ratio | Bg Ratio | pvalue | p.adjust | Count |
| GO:004819321 | Liver | HCC | Golgi vesicle transport | 217/7958 | 296/18723 | 2.58e-27 | 1.02e-24 | 217 |
| GO:001623621 | Liver | HCC | macroautophagy | 204/7958 | 291/18723 | 8.66e-22 | 1.41e-19 | 204 |
| GO:001050621 | Liver | HCC | regulation of autophagy | 210/7958 | 317/18723 | 7.59e-18 | 8.45e-16 | 210 |
| GO:000688821 | Liver | HCC | endoplasmic reticulum to Golgi vesicle-mediated transport | 100/7958 | 130/18723 | 1.15e-15 | 8.67e-14 | 100 |
| GO:000989522 | Liver | HCC | negative regulation of catabolic process | 196/7958 | 320/18723 | 7.98e-12 | 3.35e-10 | 196 |
| GO:003133022 | Liver | HCC | negative regulation of cellular catabolic process | 164/7958 | 262/18723 | 3.52e-11 | 1.35e-09 | 164 |
| GO:001624111 | Liver | HCC | regulation of macroautophagy | 96/7958 | 141/18723 | 6.82e-10 | 2.14e-08 | 96 |
| GO:007099722 | Liver | HCC | neuron death | 202/7958 | 361/18723 | 1.44e-07 | 2.70e-06 | 202 |
| GO:190121412 | Liver | HCC | regulation of neuron death | 179/7958 | 319/18723 | 5.65e-07 | 9.01e-06 | 179 |
| GO:00105074 | Liver | HCC | negative regulation of autophagy | 57/7958 | 85/18723 | 4.10e-06 | 5.27e-05 | 57 |
| GO:005140212 | Liver | HCC | neuron apoptotic process | 135/7958 | 246/18723 | 5.64e-05 | 5.26e-04 | 135 |
| GO:004352312 | Liver | HCC | regulation of neuron apoptotic process | 117/7958 | 212/18723 | 1.25e-04 | 1.03e-03 | 117 |
| GO:0016242 | Liver | HCC | negative regulation of macroautophagy | 25/7958 | 34/18723 | 2.42e-04 | 1.81e-03 | 25 |
| GO:190121512 | Liver | HCC | negative regulation of neuron death | 113/7958 | 208/18723 | 3.68e-04 | 2.54e-03 | 113 |
| GO:004819315 | Oral cavity | OSCC | Golgi vesicle transport | 209/7305 | 296/18723 | 1.39e-28 | 6.30e-26 | 209 |
| GO:001623610 | Oral cavity | OSCC | macroautophagy | 192/7305 | 291/18723 | 7.01e-21 | 1.14e-18 | 192 |
| GO:001050610 | Oral cavity | OSCC | regulation of autophagy | 198/7305 | 317/18723 | 1.63e-17 | 1.51e-15 | 198 |
| GO:00068888 | Oral cavity | OSCC | endoplasmic reticulum to Golgi vesicle-mediated transport | 97/7305 | 130/18723 | 1.42e-16 | 1.15e-14 | 97 |
| GO:00162417 | Oral cavity | OSCC | regulation of macroautophagy | 96/7305 | 141/18723 | 2.33e-12 | 9.75e-11 | 96 |
| GO:007099720 | Oral cavity | OSCC | neuron death | 202/7305 | 361/18723 | 3.75e-11 | 1.23e-09 | 202 |
| Page: 1 2 3 |
| Pathway ID | Tissue | Disease Stage | Description | Gene Ratio | Bg Ratio | pvalue | p.adjust | qvalue | Count |
| Page: 1 |
Top |
Cell-cell communication analysis |
| Identification of potential cell-cell interactions between two cell types and their ligand-receptor pairs for different disease states |
| Ligand | Receptor | LRpair | Pathway | Tissue | Disease Stage |
| Page: 1 |
Top |
Single-cell gene regulatory network inference analysis |
| Find out the significant the regulons (TFs) and the target genes of each regulon across cell types for different disease states |
| TF | Cell Type | Tissue | Disease Stage | Target Gene | RSS | Regulon Activity |
| ∗The dot plots of a searched regulon are shown for all cell subpopulations in each disease state of each tissue based on the regulon specific score inferred using pySCENIC and by calculating the average expression. |
| Page: 1 |
Top |
Somatic mutation of malignant transformation related genes |
| Annotation of somatic variants for genes involved in malignant transformation |
| Hugo Symbol | Variant Class | Variant Classification | dbSNP RS | HGVSc | HGVSp | HGVSp Short | SWISSPROT | BIOTYPE | SIFT | PolyPhen | Tumor Sample Barcode | Tissue | Histology | Sex | Age | Stage | Therapy Types | Drugs | Outcome |
| NRBP2 | SNV | Missense_Mutation | novel | c.1096A>T | p.Met366Leu | p.M366L | Q9NSY0 | protein_coding | tolerated(1) | benign(0) | TCGA-A8-A093-01 | Breast | breast invasive carcinoma | Female | <65 | I/II | Hormone Therapy | tamoxiphen | SD |
| NRBP2 | SNV | Missense_Mutation | novel | c.1094T>G | p.Phe365Cys | p.F365C | Q9NSY0 | protein_coding | tolerated(0.2) | benign(0) | TCGA-A8-A093-01 | Breast | breast invasive carcinoma | Female | <65 | I/II | Hormone Therapy | tamoxiphen | SD |
| NRBP2 | SNV | Missense_Mutation | novel | c.1002N>T | p.Glu334Asp | p.E334D | Q9NSY0 | protein_coding | tolerated(0.14) | benign(0.068) | TCGA-AN-A046-01 | Breast | breast invasive carcinoma | Female | >=65 | I/II | Unknown | Unknown | SD |
| NRBP2 | SNV | Missense_Mutation | rs782214854 | c.1015N>G | p.Met339Val | p.M339V | Q9NSY0 | protein_coding | tolerated(0.48) | benign(0) | TCGA-E2-A15T-01 | Breast | breast invasive carcinoma | Female | >=65 | I/II | Hormone Therapy | arimidex | SD |
| NRBP2 | SNV | Missense_Mutation | rs782048488 | c.1049N>A | p.Arg350Gln | p.R350Q | Q9NSY0 | protein_coding | tolerated(0.19) | benign(0.029) | TCGA-2W-A8YY-01 | Cervix | cervical & endocervical cancer | Female | <65 | I/II | Chemotherapy | cisplatin | CR |
| NRBP2 | SNV | Missense_Mutation | rs782431907 | c.697N>A | p.Asp233Asn | p.D233N | Q9NSY0 | protein_coding | tolerated(0.34) | benign(0.061) | TCGA-2W-A8YY-01 | Cervix | cervical & endocervical cancer | Female | <65 | I/II | Chemotherapy | cisplatin | CR |
| NRBP2 | SNV | Missense_Mutation | novel | c.805N>G | p.Arg269Gly | p.R269G | Q9NSY0 | protein_coding | deleterious(0) | benign(0.44) | TCGA-C5-A902-01 | Cervix | cervical & endocervical cancer | Female | <65 | I/II | Chemotherapy | cisplatin | SD |
| NRBP2 | SNV | Missense_Mutation | rs146279016 | c.1054N>T | p.Arg352Cys | p.R352C | Q9NSY0 | protein_coding | tolerated(0.1) | benign(0.063) | TCGA-VS-A8EG-01 | Cervix | cervical & endocervical cancer | Female | <65 | I/II | Unknown | Unknown | SD |
| NRBP2 | insertion | Frame_Shift_Ins | novel | c.1155_1156insCTCTG | p.Ala386LeufsTer71 | p.A386Lfs*71 | Q9NSY0 | protein_coding | TCGA-DS-A1OA-01 | Cervix | cervical & endocervical cancer | Female | >=65 | I/II | Chemotherapy | carboplatin | PD | ||
| NRBP2 | insertion | Frame_Shift_Ins | novel | c.1155_1156insCTCTG | p.Ala386LeufsTer71 | p.A386Lfs*71 | Q9NSY0 | protein_coding | TCGA-DS-A1OB-01 | Cervix | cervical & endocervical cancer | Female | <65 | I/II | Chemotherapy | carboplatin | PD |
| Page: 1 2 3 4 |
Top |
Related drugs of malignant transformation related genes |
| Identification of chemicals and drugs interact with genes involved in malignant transfromation |
| (DGIdb 4.0) |
| Entrez ID | Symbol | Category | Interaction Types | Drug Claim Name | Drug Name | PMIDs |
| Page: 1 |

Copyright 2023-Present -The University of Texas Health Science Center at Houston |