
|
|||||
|
 | |
| |
| |
| |
| |
| |
|
Gene: NRBP1 |
Gene summary for NRBP1 |
| Gene information | Species | Human | Gene symbol | NRBP1 | Gene ID | 29959 |
| Gene name | nuclear receptor binding protein 1 | |
| Gene Alias | BCON3 | |
| Cytomap | 2p23.3 | |
| Gene Type | protein-coding | GO ID | GO:0006810 | UniProtAcc | Q9UHY1 |
Top |
Malignant transformation analysis |
| Identification of the aberrant gene expression in precancerous and cancerous lesions by comparing the gene expression of stem-like cells in diseased tissues with normal stem cells |
| Entrez ID | Symbol | Replicates | Species | Organ | Tissue | Adj P-value | Log2FC | Malignancy |
| 29959 | NRBP1 | HTA11_2487_2000001011 | Human | Colorectum | SER | 1.43e-04 | 3.35e-01 | -0.1808 |
| 29959 | NRBP1 | HTA11_1938_2000001011 | Human | Colorectum | AD | 1.09e-05 | 4.19e-01 | -0.0811 |
| 29959 | NRBP1 | HTA11_78_2000001011 | Human | Colorectum | AD | 4.50e-04 | 3.79e-01 | -0.1088 |
| 29959 | NRBP1 | HTA11_347_2000001011 | Human | Colorectum | AD | 1.78e-06 | 3.13e-01 | -0.1954 |
| 29959 | NRBP1 | HTA11_3361_2000001011 | Human | Colorectum | AD | 6.81e-03 | 3.58e-01 | -0.1207 |
| 29959 | NRBP1 | HTA11_83_2000001011 | Human | Colorectum | SER | 2.06e-04 | 4.51e-01 | -0.1526 |
| 29959 | NRBP1 | HTA11_696_2000001011 | Human | Colorectum | AD | 4.65e-11 | 4.80e-01 | -0.1464 |
| 29959 | NRBP1 | HTA11_866_2000001011 | Human | Colorectum | AD | 1.16e-02 | 2.50e-01 | -0.1001 |
| 29959 | NRBP1 | HTA11_1391_2000001011 | Human | Colorectum | AD | 7.42e-14 | 6.43e-01 | -0.059 |
| 29959 | NRBP1 | HTA11_866_3004761011 | Human | Colorectum | AD | 4.03e-06 | 3.22e-01 | 0.096 |
| 29959 | NRBP1 | HTA11_10711_2000001011 | Human | Colorectum | AD | 3.97e-02 | 2.78e-01 | 0.0338 |
| 29959 | NRBP1 | HTA11_7696_3000711011 | Human | Colorectum | AD | 7.38e-06 | 3.27e-01 | 0.0674 |
| 29959 | NRBP1 | HTA11_99999974143_84620 | Human | Colorectum | MSS | 9.78e-07 | 3.64e-01 | 0.3005 |
| 29959 | NRBP1 | A015-C-203 | Human | Colorectum | FAP | 2.27e-02 | -1.31e-03 | -0.1294 |
| 29959 | NRBP1 | A015-C-104 | Human | Colorectum | FAP | 2.07e-03 | 3.08e-03 | -0.1899 |
| 29959 | NRBP1 | A002-C-116 | Human | Colorectum | FAP | 5.92e-05 | -1.56e-01 | -0.0452 |
| 29959 | NRBP1 | LZE4T | Human | Esophagus | ESCC | 1.37e-30 | 1.22e+00 | 0.0811 |
| 29959 | NRBP1 | LZE5T | Human | Esophagus | ESCC | 1.74e-02 | 2.71e-01 | 0.0514 |
| 29959 | NRBP1 | LZE7T | Human | Esophagus | ESCC | 2.19e-16 | 6.00e-01 | 0.0667 |
| 29959 | NRBP1 | LZE8T | Human | Esophagus | ESCC | 1.82e-10 | 3.27e-01 | 0.067 |
| Page: 1 2 3 4 5 6 7 8 |
| Tissue | Expression Dynamics | Abbreviation |
| Colorectum (GSE201348) |  | FAP: Familial adenomatous polyposis |
| CRC: Colorectal cancer | ||
| Colorectum (HTA11) |  | AD: Adenomas |
| SER: Sessile serrated lesions | ||
| MSI-H: Microsatellite-high colorectal cancer | ||
| MSS: Microsatellite stable colorectal cancer | ||
| Esophagus |  | ESCC: Esophageal squamous cell carcinoma |
| HGIN: High-grade intraepithelial neoplasias | ||
| LGIN: Low-grade intraepithelial neoplasias | ||
| Liver |  | HCC: Hepatocellular carcinoma |
| NAFLD: Non-alcoholic fatty liver disease | ||
| Oral Cavity | 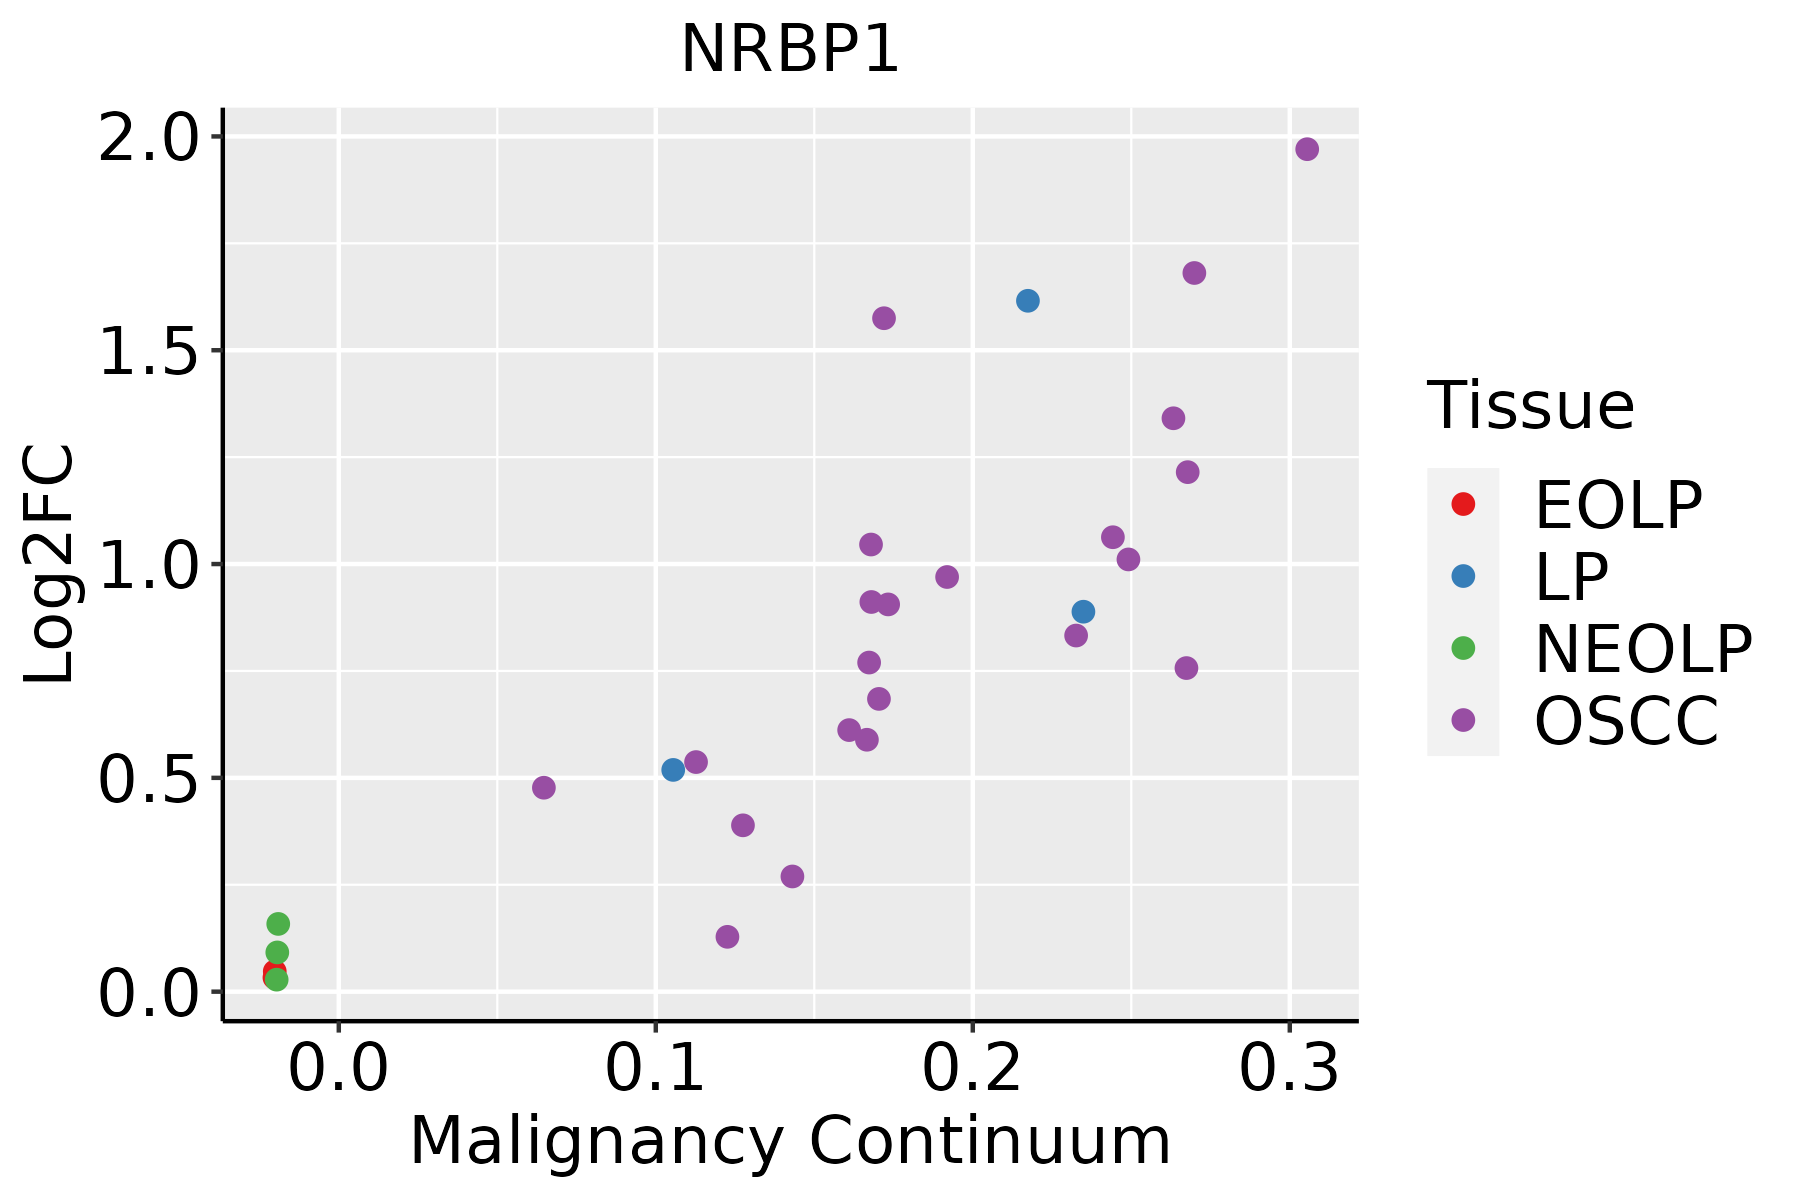 | EOLP: Erosive Oral lichen planus |
| LP: leukoplakia | ||
| NEOLP: Non-erosive oral lichen planus | ||
| OSCC: Oral squamous cell carcinoma | ||
| Skin | 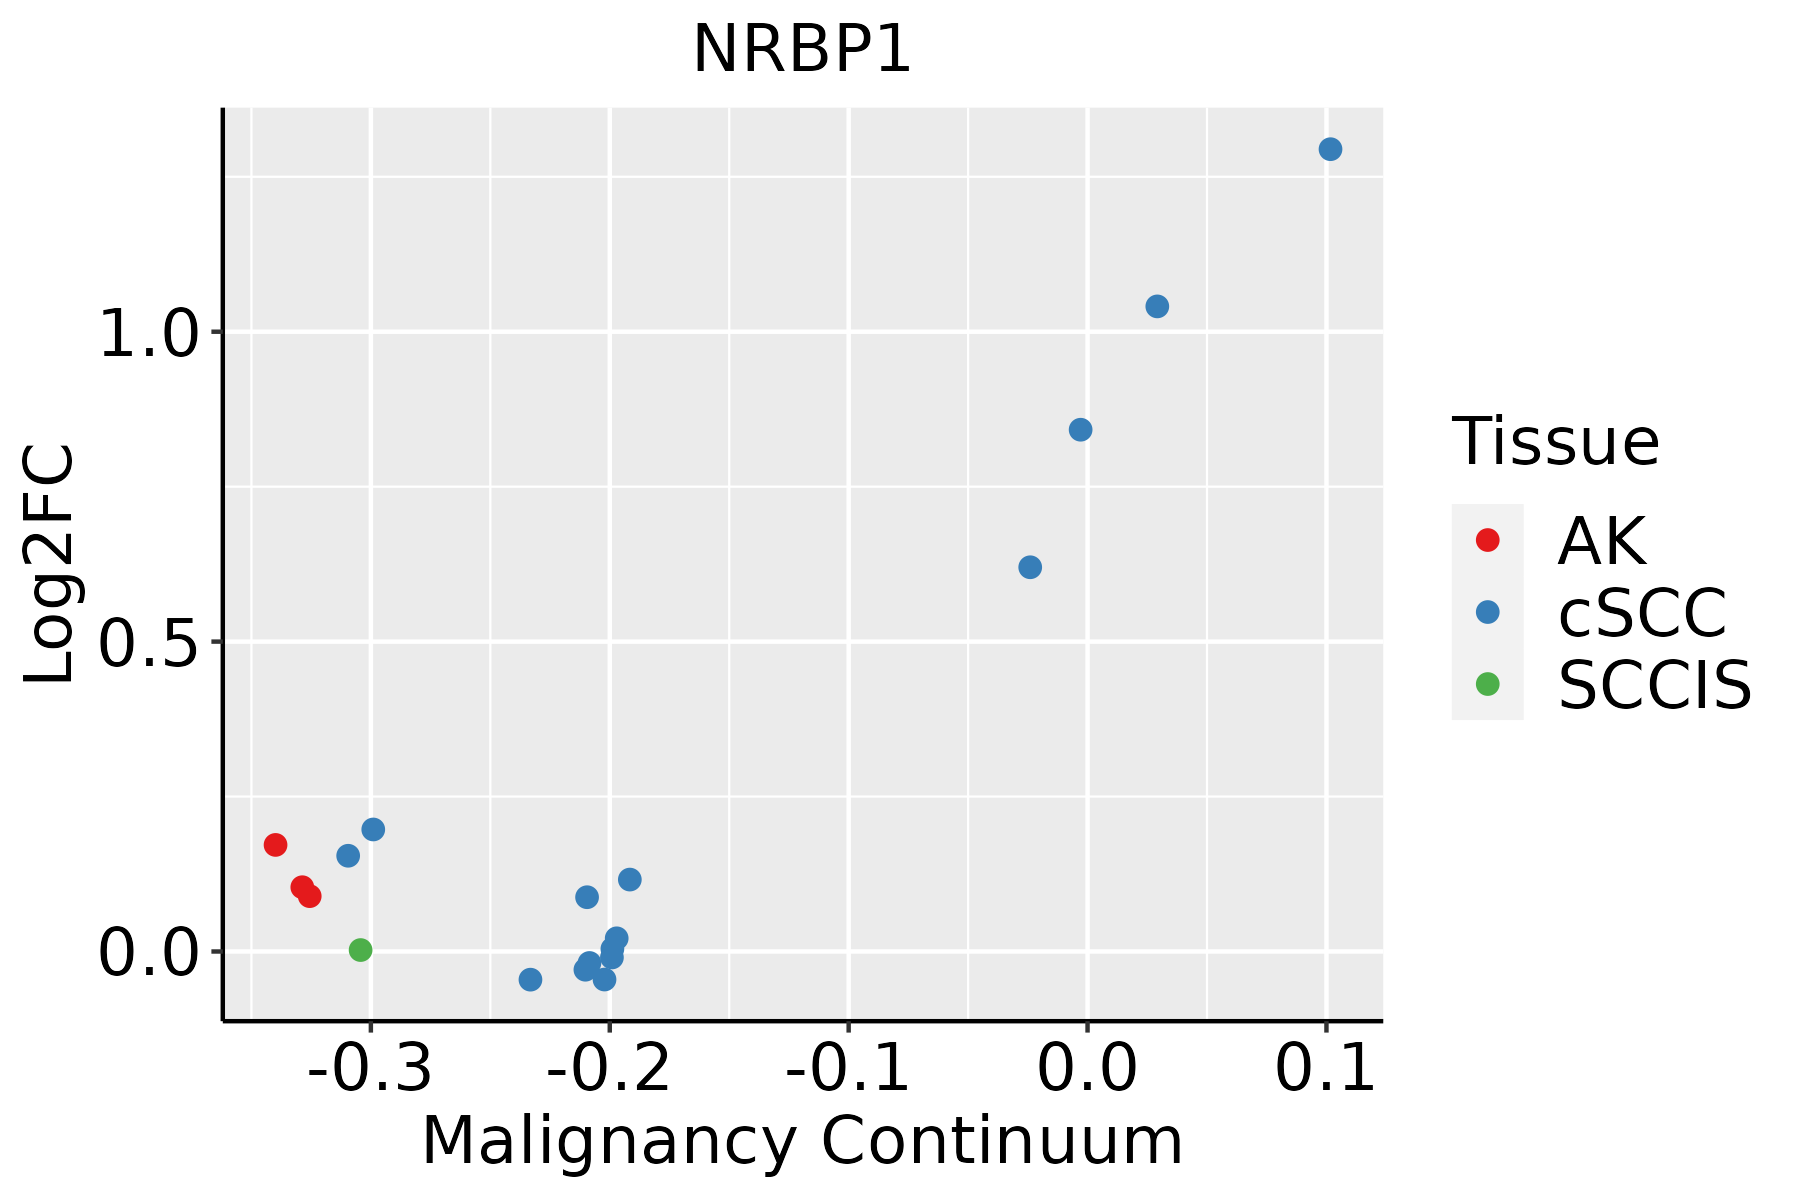 | AK: Actinic keratosis |
| cSCC: Cutaneous squamous cell carcinoma | ||
| SCCIS:squamous cell carcinoma in situ | ||
| Thyroid |  | ATC: Anaplastic thyroid cancer |
| HT: Hashimoto's thyroiditis | ||
| PTC: Papillary thyroid cancer |
| ∗log2FC in expression of this searched gene in stem-like cells from each diseased tissue sample relative to stem-like cells in normal samples in each tissue plotted against the malignancy continuum. Samples are colored based on if they are from different disease stage. |
Top |
Malignant transformation related pathway analysis |
| Find out the enriched GO biological processes and KEGG pathways involved in transition from healthy to precancer to cancer |
| Tissue | Disease Stage | Enriched GO biological Processes |
| Colorectum | AD |  |
| Colorectum | SER |  |
| Colorectum | MSS |  |
| Colorectum | MSI-H |  |
| Colorectum | FAP |  |
| ∗Top 15 enriched GO BP terms are showed in the bar plot of each disease state in each tissue. Each row represents a significant GO biological process which is colored according to the -log10(p.adjust). |
| Page: 1 2 3 4 5 6 7 8 9 |
| GO ID | Tissue | Disease Stage | Description | Gene Ratio | Bg Ratio | pvalue | p.adjust | Count |
| GO:0048193 | Colorectum | AD | Golgi vesicle transport | 109/3918 | 296/18723 | 1.80e-10 | 1.68e-08 | 109 |
| GO:0006888 | Colorectum | AD | endoplasmic reticulum to Golgi vesicle-mediated transport | 44/3918 | 130/18723 | 4.13e-04 | 4.68e-03 | 44 |
| GO:00481931 | Colorectum | SER | Golgi vesicle transport | 79/2897 | 296/18723 | 4.20e-07 | 2.15e-05 | 79 |
| GO:00068881 | Colorectum | SER | endoplasmic reticulum to Golgi vesicle-mediated transport | 34/2897 | 130/18723 | 1.13e-03 | 1.29e-02 | 34 |
| GO:00481932 | Colorectum | MSS | Golgi vesicle transport | 101/3467 | 296/18723 | 9.09e-11 | 9.77e-09 | 101 |
| GO:00068882 | Colorectum | MSS | endoplasmic reticulum to Golgi vesicle-mediated transport | 44/3467 | 130/18723 | 2.17e-05 | 4.60e-04 | 44 |
| GO:00481934 | Colorectum | FAP | Golgi vesicle transport | 77/2622 | 296/18723 | 2.86e-08 | 2.62e-06 | 77 |
| GO:00068884 | Colorectum | FAP | endoplasmic reticulum to Golgi vesicle-mediated transport | 30/2622 | 130/18723 | 3.51e-03 | 2.53e-02 | 30 |
| GO:004819317 | Esophagus | HGIN | Golgi vesicle transport | 83/2587 | 296/18723 | 8.59e-11 | 8.89e-09 | 83 |
| GO:00068889 | Esophagus | HGIN | endoplasmic reticulum to Golgi vesicle-mediated transport | 40/2587 | 130/18723 | 4.67e-07 | 2.07e-05 | 40 |
| GO:004819318 | Esophagus | ESCC | Golgi vesicle transport | 231/8552 | 296/18723 | 1.82e-30 | 9.63e-28 | 231 |
| GO:000688815 | Esophagus | ESCC | endoplasmic reticulum to Golgi vesicle-mediated transport | 102/8552 | 130/18723 | 1.73e-14 | 9.22e-13 | 102 |
| GO:004819311 | Liver | Cirrhotic | Golgi vesicle transport | 153/4634 | 296/18723 | 1.02e-23 | 6.43e-21 | 153 |
| GO:000688811 | Liver | Cirrhotic | endoplasmic reticulum to Golgi vesicle-mediated transport | 77/4634 | 130/18723 | 5.78e-17 | 7.56e-15 | 77 |
| GO:004819321 | Liver | HCC | Golgi vesicle transport | 217/7958 | 296/18723 | 2.58e-27 | 1.02e-24 | 217 |
| GO:000688821 | Liver | HCC | endoplasmic reticulum to Golgi vesicle-mediated transport | 100/7958 | 130/18723 | 1.15e-15 | 8.67e-14 | 100 |
| GO:004819315 | Oral cavity | OSCC | Golgi vesicle transport | 209/7305 | 296/18723 | 1.39e-28 | 6.30e-26 | 209 |
| GO:00068888 | Oral cavity | OSCC | endoplasmic reticulum to Golgi vesicle-mediated transport | 97/7305 | 130/18723 | 1.42e-16 | 1.15e-14 | 97 |
| GO:004819316 | Oral cavity | LP | Golgi vesicle transport | 141/4623 | 296/18723 | 6.11e-18 | 1.06e-15 | 141 |
| GO:000688814 | Oral cavity | LP | endoplasmic reticulum to Golgi vesicle-mediated transport | 67/4623 | 130/18723 | 3.74e-11 | 2.39e-09 | 67 |
| Page: 1 2 |
| Pathway ID | Tissue | Disease Stage | Description | Gene Ratio | Bg Ratio | pvalue | p.adjust | qvalue | Count |
| Page: 1 |
Top |
Cell-cell communication analysis |
| Identification of potential cell-cell interactions between two cell types and their ligand-receptor pairs for different disease states |
| Ligand | Receptor | LRpair | Pathway | Tissue | Disease Stage |
| Page: 1 |
Top |
Single-cell gene regulatory network inference analysis |
| Find out the significant the regulons (TFs) and the target genes of each regulon across cell types for different disease states |
| TF | Cell Type | Tissue | Disease Stage | Target Gene | RSS | Regulon Activity |
| ∗The dot plots of a searched regulon are shown for all cell subpopulations in each disease state of each tissue based on the regulon specific score inferred using pySCENIC and by calculating the average expression. |
| Page: 1 |
Top |
Somatic mutation of malignant transformation related genes |
| Annotation of somatic variants for genes involved in malignant transformation |
| Hugo Symbol | Variant Class | Variant Classification | dbSNP RS | HGVSc | HGVSp | HGVSp Short | SWISSPROT | BIOTYPE | SIFT | PolyPhen | Tumor Sample Barcode | Tissue | Histology | Sex | Age | Stage | Therapy Types | Drugs | Outcome |
| NRBP1 | SNV | Missense_Mutation | novel | c.472N>G | p.Leu158Val | p.L158V | protein_coding | tolerated(0.06) | possibly_damaging(0.873) | TCGA-AC-A5XS-01 | Breast | breast invasive carcinoma | Female | >=65 | I/II | Hormone Therapy | femara | SD | |
| NRBP1 | SNV | Missense_Mutation | c.1207G>C | p.Glu403Gln | p.E403Q | protein_coding | deleterious(0.02) | probably_damaging(0.994) | TCGA-BH-A18U-01 | Breast | breast invasive carcinoma | Female | >=65 | III/IV | Unknown | Unknown | SD | ||
| NRBP1 | deletion | Frame_Shift_Del | c.430delG | p.Ala144ProfsTer15 | p.A144Pfs*15 | protein_coding | TCGA-A2-A0CU-01 | Breast | breast invasive carcinoma | Female | >=65 | I/II | Hormone Therapy | tamoxiphen | SD | ||||
| NRBP1 | deletion | Frame_Shift_Del | c.591delC | p.Ile198SerfsTer6 | p.I198Sfs*6 | protein_coding | TCGA-BH-A18G-01 | Breast | breast invasive carcinoma | Female | >=65 | I/II | Unknown | Unknown | SD | ||||
| NRBP1 | SNV | Missense_Mutation | novel | c.1078G>A | p.Ala360Thr | p.A360T | protein_coding | tolerated(0.3) | benign(0.119) | TCGA-2W-A8YY-01 | Cervix | cervical & endocervical cancer | Female | <65 | I/II | Chemotherapy | cisplatin | CR | |
| NRBP1 | SNV | Missense_Mutation | c.1174C>G | p.Gln392Glu | p.Q392E | protein_coding | tolerated(0.76) | benign(0.029) | TCGA-EK-A2PG-01 | Cervix | cervical & endocervical cancer | Female | >=65 | I/II | Unknown | Unknown | SD | ||
| NRBP1 | SNV | Missense_Mutation | c.292N>C | p.Glu98Gln | p.E98Q | protein_coding | deleterious(0) | probably_damaging(0.966) | TCGA-LP-A4AV-01 | Cervix | cervical & endocervical cancer | Female | <65 | I/II | Unknown | Unknown | SD | ||
| NRBP1 | SNV | Missense_Mutation | novel | c.1064N>C | p.Met355Thr | p.M355T | protein_coding | tolerated(0.16) | benign(0.113) | TCGA-VS-A9UJ-01 | Cervix | cervical & endocervical cancer | Female | <65 | I/II | Unknown | Unknown | PD | |
| NRBP1 | SNV | Missense_Mutation | c.968G>A | p.Arg323Lys | p.R323K | protein_coding | deleterious(0) | probably_damaging(0.966) | TCGA-A6-4105-01 | Colorectum | colon adenocarcinoma | Male | >=65 | I/II | Unknown | Unknown | PD | ||
| NRBP1 | SNV | Missense_Mutation | c.1292C>A | p.Pro431His | p.P431H | protein_coding | deleterious(0) | probably_damaging(0.981) | TCGA-AA-3663-01 | Colorectum | colon adenocarcinoma | Male | <65 | I/II | Unknown | Unknown | SD |
| Page: 1 2 3 4 5 6 |
Top |
Related drugs of malignant transformation related genes |
| Identification of chemicals and drugs interact with genes involved in malignant transfromation |
| (DGIdb 4.0) |
| Entrez ID | Symbol | Category | Interaction Types | Drug Claim Name | Drug Name | PMIDs |
| Page: 1 |

Copyright 2023-Present -The University of Texas Health Science Center at Houston |