
|
|||||
|
 | |
| |
| |
| |
| |
| |
|
Gene: NRAS |
Gene summary for NRAS |
| Gene information | Species | Human | Gene symbol | NRAS | Gene ID | 4893 |
| Gene name | NRAS proto-oncogene, GTPase | |
| Gene Alias | ALPS4 | |
| Cytomap | 1p13.2 | |
| Gene Type | protein-coding | GO ID | GO:0000165 | UniProtAcc | P01111 |
Top |
Malignant transformation analysis |
| Identification of the aberrant gene expression in precancerous and cancerous lesions by comparing the gene expression of stem-like cells in diseased tissues with normal stem cells |
| Entrez ID | Symbol | Replicates | Species | Organ | Tissue | Adj P-value | Log2FC | Malignancy |
| 4893 | NRAS | LZE4T | Human | Esophagus | ESCC | 1.13e-12 | 3.03e-01 | 0.0811 |
| 4893 | NRAS | LZE7T | Human | Esophagus | ESCC | 7.14e-07 | 2.21e-01 | 0.0667 |
| 4893 | NRAS | LZE8T | Human | Esophagus | ESCC | 2.05e-02 | -1.79e-02 | 0.067 |
| 4893 | NRAS | LZE20T | Human | Esophagus | ESCC | 3.42e-05 | 1.89e-01 | 0.0662 |
| 4893 | NRAS | LZE24T | Human | Esophagus | ESCC | 1.00e-13 | 2.29e-01 | 0.0596 |
| 4893 | NRAS | LZE6T | Human | Esophagus | ESCC | 2.57e-04 | 1.92e-01 | 0.0845 |
| 4893 | NRAS | P1T-E | Human | Esophagus | ESCC | 3.24e-10 | 1.51e-01 | 0.0875 |
| 4893 | NRAS | P2T-E | Human | Esophagus | ESCC | 8.73e-28 | 3.95e-01 | 0.1177 |
| 4893 | NRAS | P4T-E | Human | Esophagus | ESCC | 2.62e-19 | 4.57e-01 | 0.1323 |
| 4893 | NRAS | P5T-E | Human | Esophagus | ESCC | 7.09e-16 | 3.15e-01 | 0.1327 |
| 4893 | NRAS | P8T-E | Human | Esophagus | ESCC | 3.31e-18 | 2.24e-01 | 0.0889 |
| 4893 | NRAS | P9T-E | Human | Esophagus | ESCC | 1.29e-08 | 1.94e-01 | 0.1131 |
| 4893 | NRAS | P10T-E | Human | Esophagus | ESCC | 8.48e-25 | 3.48e-01 | 0.116 |
| 4893 | NRAS | P11T-E | Human | Esophagus | ESCC | 5.41e-10 | 4.45e-01 | 0.1426 |
| 4893 | NRAS | P12T-E | Human | Esophagus | ESCC | 3.14e-11 | 3.54e-01 | 0.1122 |
| 4893 | NRAS | P15T-E | Human | Esophagus | ESCC | 3.79e-14 | 1.01e-01 | 0.1149 |
| 4893 | NRAS | P16T-E | Human | Esophagus | ESCC | 3.36e-18 | 1.59e-01 | 0.1153 |
| 4893 | NRAS | P17T-E | Human | Esophagus | ESCC | 1.64e-06 | 4.35e-01 | 0.1278 |
| 4893 | NRAS | P19T-E | Human | Esophagus | ESCC | 3.43e-02 | 5.59e-01 | 0.1662 |
| 4893 | NRAS | P20T-E | Human | Esophagus | ESCC | 2.30e-18 | 2.80e-01 | 0.1124 |
| Page: 1 2 3 4 5 6 |
| Tissue | Expression Dynamics | Abbreviation |
| Esophagus | 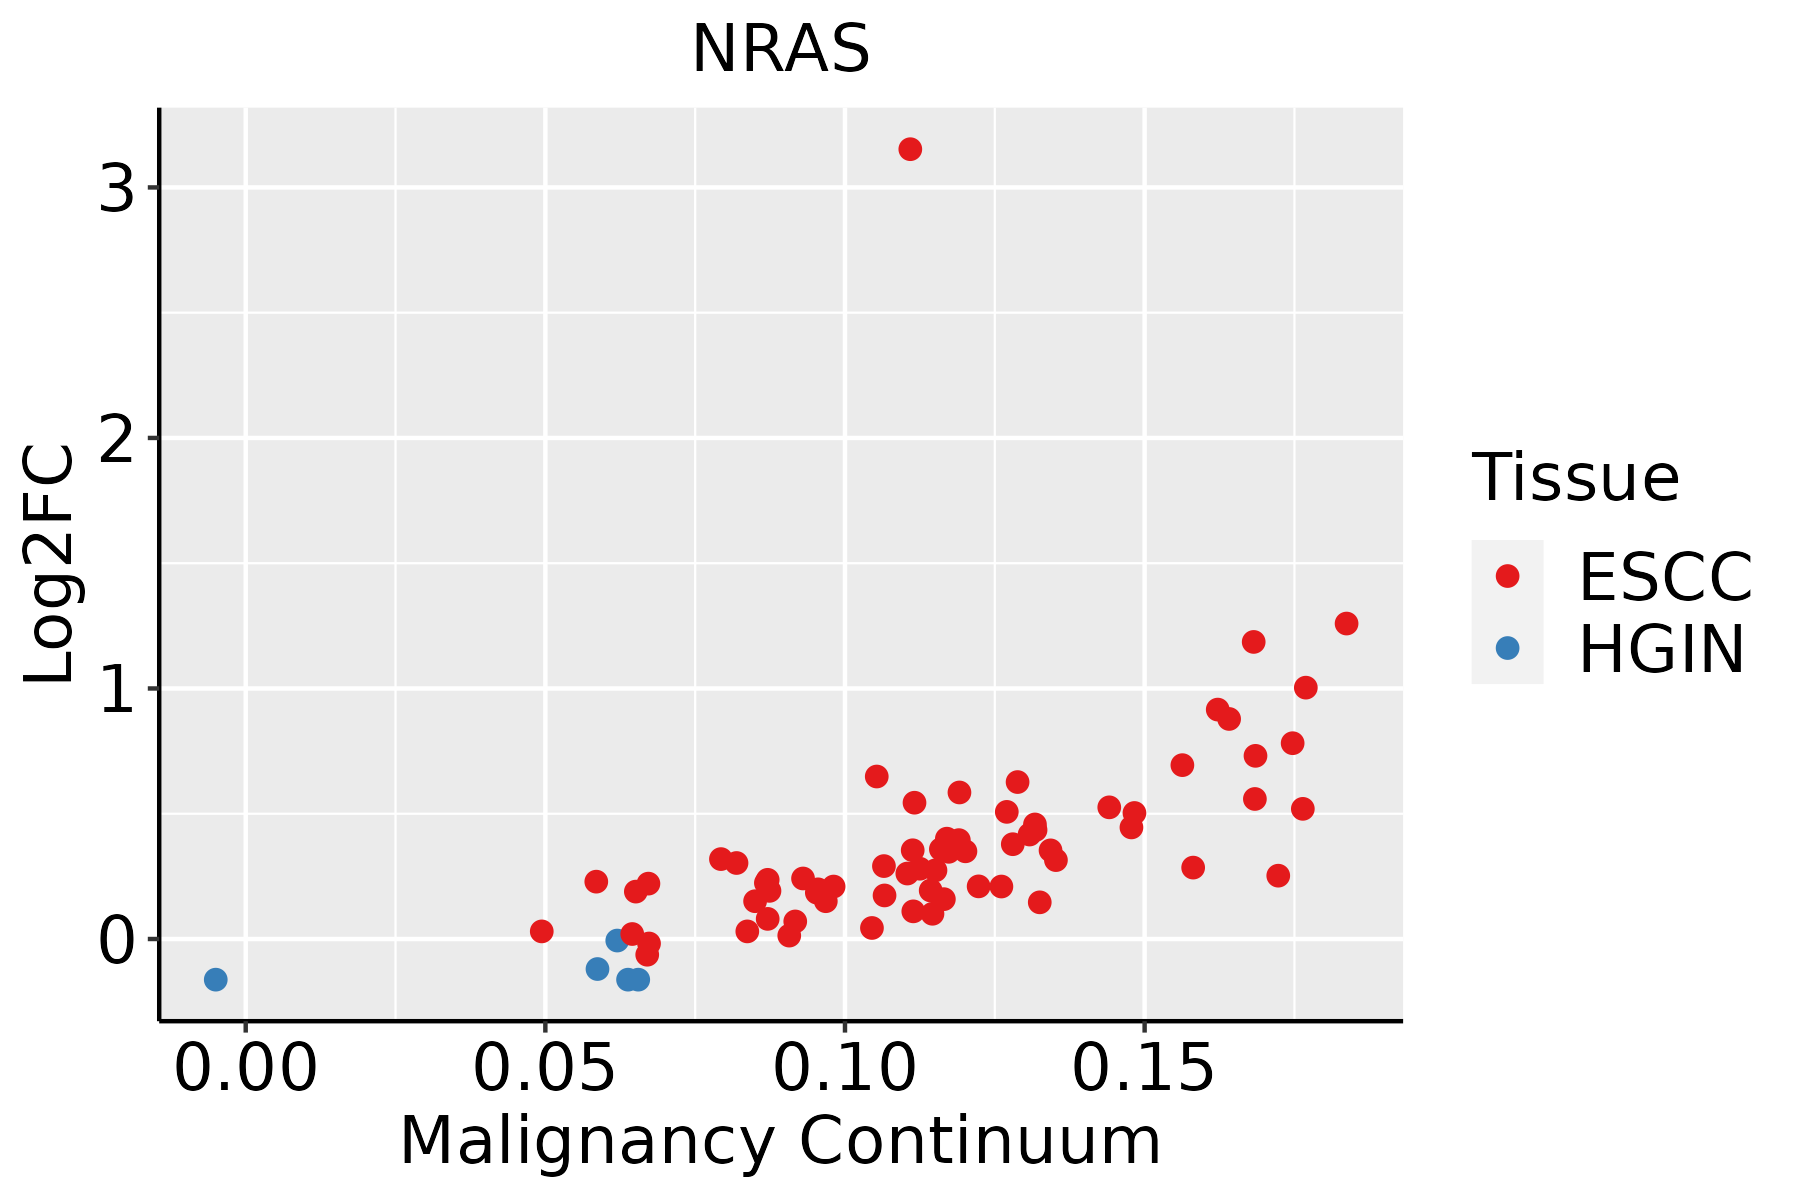 | ESCC: Esophageal squamous cell carcinoma |
| HGIN: High-grade intraepithelial neoplasias | ||
| LGIN: Low-grade intraepithelial neoplasias | ||
| Liver | 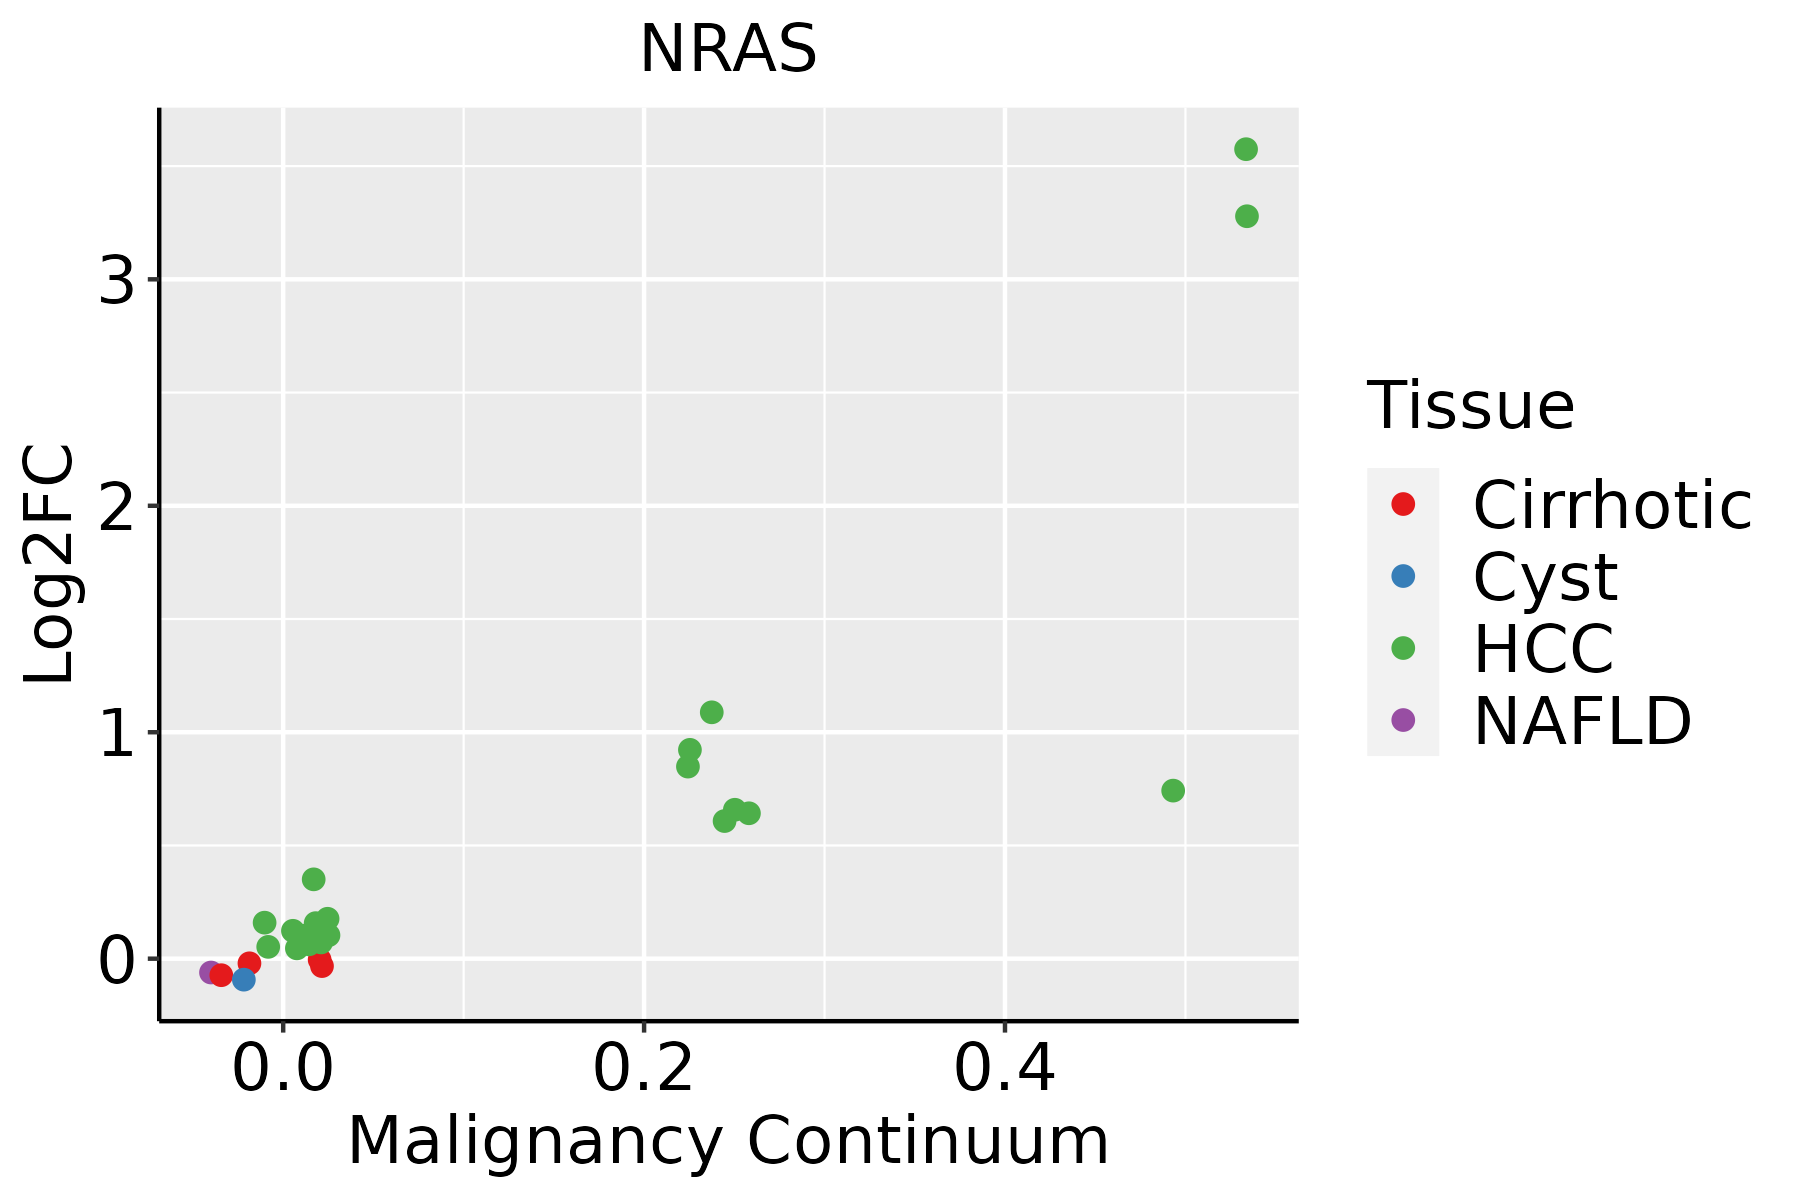 | HCC: Hepatocellular carcinoma |
| NAFLD: Non-alcoholic fatty liver disease | ||
| Oral Cavity | 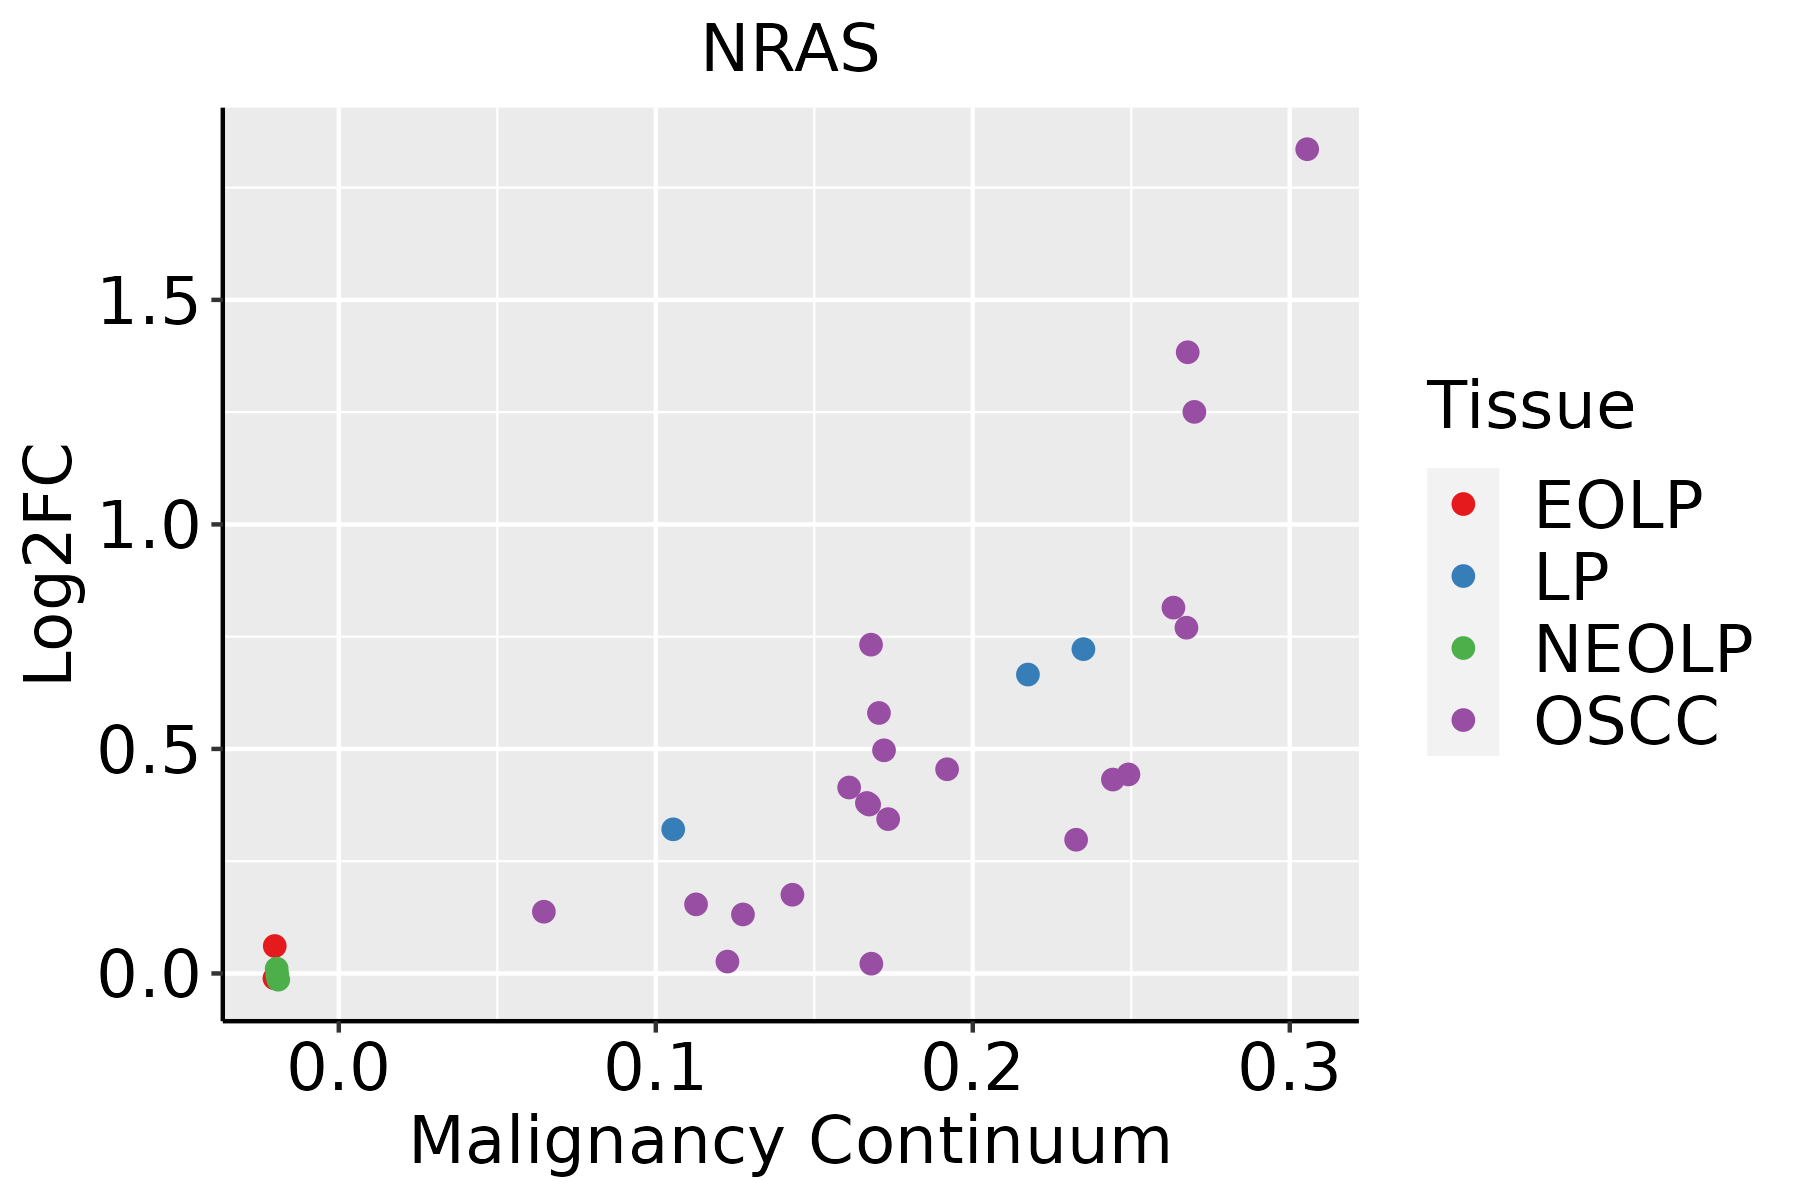 | EOLP: Erosive Oral lichen planus |
| LP: leukoplakia | ||
| NEOLP: Non-erosive oral lichen planus | ||
| OSCC: Oral squamous cell carcinoma | ||
| Skin |  | AK: Actinic keratosis |
| cSCC: Cutaneous squamous cell carcinoma | ||
| SCCIS:squamous cell carcinoma in situ | ||
| Thyroid | 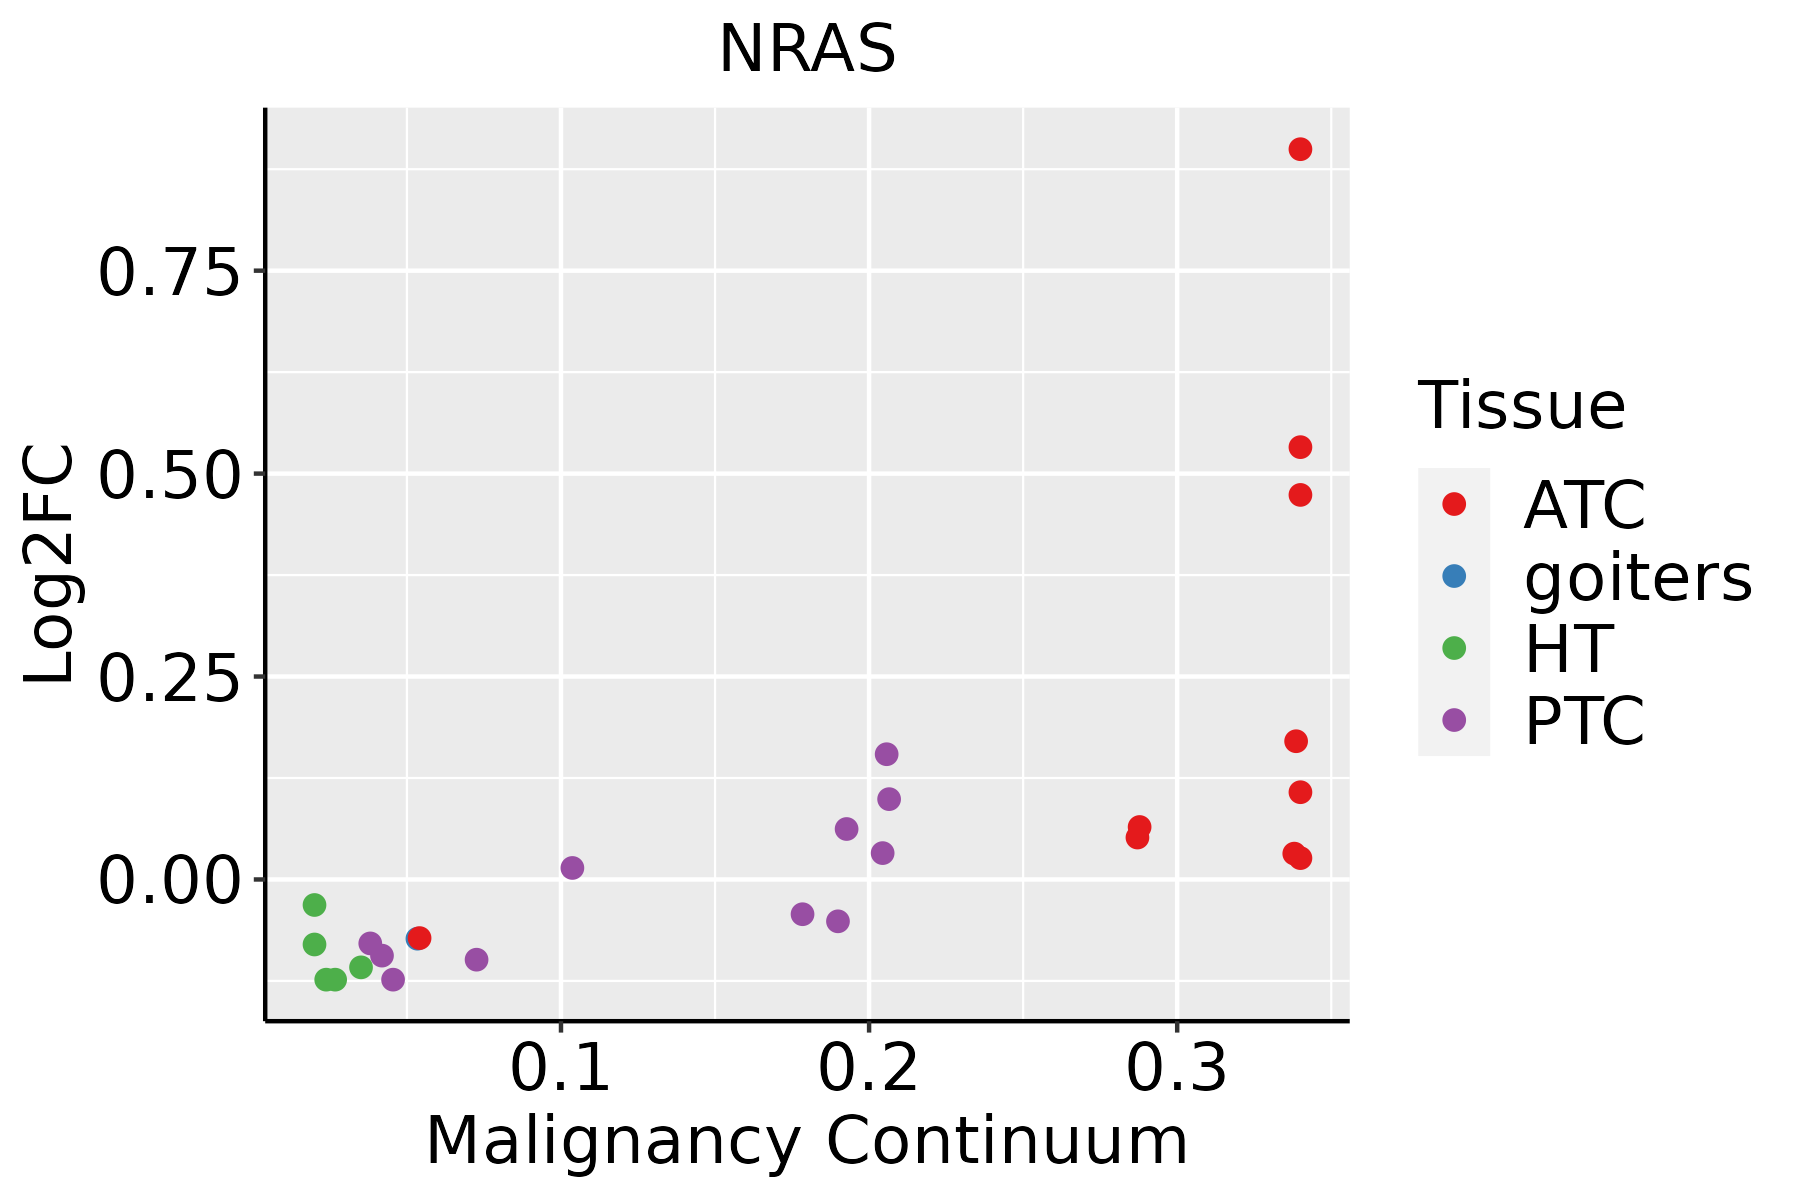 | ATC: Anaplastic thyroid cancer |
| HT: Hashimoto's thyroiditis | ||
| PTC: Papillary thyroid cancer |
| ∗log2FC in expression of this searched gene in stem-like cells from each diseased tissue sample relative to stem-like cells in normal samples in each tissue plotted against the malignancy continuum. Samples are colored based on if they are from different disease stage. |
Top |
Malignant transformation related pathway analysis |
| Find out the enriched GO biological processes and KEGG pathways involved in transition from healthy to precancer to cancer |
| Tissue | Disease Stage | Enriched GO biological Processes |
| Colorectum | AD |  |
| Colorectum | SER |  |
| Colorectum | MSS |  |
| Colorectum | MSI-H |  |
| Colorectum | FAP |  |
| ∗Top 15 enriched GO BP terms are showed in the bar plot of each disease state in each tissue. Each row represents a significant GO biological process which is colored according to the -log10(p.adjust). |
| Page: 1 2 3 4 5 6 7 8 9 |
| GO ID | Tissue | Disease Stage | Description | Gene Ratio | Bg Ratio | pvalue | p.adjust | Count |
| GO:000726510 | Esophagus | ESCC | Ras protein signal transduction | 201/8552 | 337/18723 | 1.44e-07 | 2.30e-06 | 201 |
| GO:005067318 | Esophagus | ESCC | epithelial cell proliferation | 238/8552 | 437/18723 | 1.19e-04 | 8.20e-04 | 238 |
| GO:005067817 | Esophagus | ESCC | regulation of epithelial cell proliferation | 206/8552 | 381/18723 | 5.51e-04 | 3.02e-03 | 206 |
| GO:000726521 | Liver | HCC | Ras protein signal transduction | 187/7958 | 337/18723 | 8.89e-07 | 1.35e-05 | 187 |
| GO:00072659 | Oral cavity | OSCC | Ras protein signal transduction | 185/7305 | 337/18723 | 1.95e-09 | 4.60e-08 | 185 |
| GO:005067310 | Oral cavity | OSCC | epithelial cell proliferation | 212/7305 | 437/18723 | 2.82e-05 | 2.61e-04 | 212 |
| GO:005067810 | Oral cavity | OSCC | regulation of epithelial cell proliferation | 180/7305 | 381/18723 | 5.88e-04 | 3.35e-03 | 180 |
| GO:000726515 | Oral cavity | LP | Ras protein signal transduction | 109/4623 | 337/18723 | 8.44e-04 | 7.36e-03 | 109 |
| GO:000726523 | Skin | cSCC | Ras protein signal transduction | 132/4864 | 337/18723 | 6.17e-08 | 1.57e-06 | 132 |
| GO:005067324 | Skin | cSCC | epithelial cell proliferation | 144/4864 | 437/18723 | 6.07e-04 | 4.38e-03 | 144 |
| GO:000726519 | Thyroid | PTC | Ras protein signal transduction | 162/5968 | 337/18723 | 3.16e-10 | 1.02e-08 | 162 |
| GO:000726524 | Thyroid | ATC | Ras protein signal transduction | 172/6293 | 337/18723 | 2.25e-11 | 7.96e-10 | 172 |
| GO:0050673111 | Thyroid | ATC | epithelial cell proliferation | 174/6293 | 437/18723 | 3.49e-03 | 1.55e-02 | 174 |
| GO:0050678110 | Thyroid | ATC | regulation of epithelial cell proliferation | 151/6293 | 381/18723 | 7.47e-03 | 2.92e-02 | 151 |
| Page: 1 |
| Pathway ID | Tissue | Disease Stage | Description | Gene Ratio | Bg Ratio | pvalue | p.adjust | qvalue | Count |
| hsa05208211 | Esophagus | ESCC | Chemical carcinogenesis - reactive oxygen species | 168/4205 | 223/8465 | 1.83e-15 | 6.81e-14 | 3.49e-14 | 168 |
| hsa05022210 | Esophagus | ESCC | Pathways of neurodegeneration - multiple diseases | 318/4205 | 476/8465 | 6.10e-15 | 2.04e-13 | 1.05e-13 | 318 |
| hsa05010210 | Esophagus | ESCC | Alzheimer disease | 263/4205 | 384/8465 | 1.80e-14 | 5.47e-13 | 2.80e-13 | 263 |
| hsa05166211 | Esophagus | ESCC | Human T-cell leukemia virus 1 infection | 164/4205 | 222/8465 | 8.13e-14 | 2.09e-12 | 1.07e-12 | 164 |
| hsa0421829 | Esophagus | ESCC | Cellular senescence | 119/4205 | 156/8465 | 5.89e-12 | 9.40e-11 | 4.81e-11 | 119 |
| hsa04714211 | Esophagus | ESCC | Thermogenesis | 163/4205 | 232/8465 | 9.22e-11 | 1.14e-09 | 5.86e-10 | 163 |
| hsa0421027 | Esophagus | ESCC | Apoptosis | 102/4205 | 136/8465 | 1.05e-09 | 1.21e-08 | 6.21e-09 | 102 |
| hsa05170210 | Esophagus | ESCC | Human immunodeficiency virus 1 infection | 147/4205 | 212/8465 | 3.37e-09 | 3.53e-08 | 1.81e-08 | 147 |
| hsa0521020 | Esophagus | ESCC | Colorectal cancer | 69/4205 | 86/8465 | 4.06e-09 | 4.13e-08 | 2.11e-08 | 69 |
| hsa05167211 | Esophagus | ESCC | Kaposi sarcoma-associated herpesvirus infection | 136/4205 | 194/8465 | 4.28e-09 | 4.22e-08 | 2.16e-08 | 136 |
| hsa0516510 | Esophagus | ESCC | Human papillomavirus infection | 215/4205 | 331/8465 | 7.86e-09 | 7.12e-08 | 3.65e-08 | 215 |
| hsa0522020 | Esophagus | ESCC | Chronic myeloid leukemia | 61/4205 | 76/8465 | 3.20e-08 | 2.68e-07 | 1.37e-07 | 61 |
| hsa0414010 | Esophagus | ESCC | Autophagy - animal | 101/4205 | 141/8465 | 7.60e-08 | 6.21e-07 | 3.18e-07 | 101 |
| hsa0520529 | Esophagus | ESCC | Proteoglycans in cancer | 138/4205 | 205/8465 | 1.79e-07 | 1.40e-06 | 7.15e-07 | 138 |
| hsa0520325 | Esophagus | ESCC | Viral carcinogenesis | 137/4205 | 204/8465 | 2.47e-07 | 1.88e-06 | 9.62e-07 | 137 |
| hsa05417211 | Esophagus | ESCC | Lipid and atherosclerosis | 143/4205 | 215/8465 | 3.30e-07 | 2.45e-06 | 1.26e-06 | 143 |
| hsa05163210 | Esophagus | ESCC | Human cytomegalovirus infection | 148/4205 | 225/8465 | 5.73e-07 | 4.00e-06 | 2.05e-06 | 148 |
| hsa0521516 | Esophagus | ESCC | Prostate cancer | 72/4205 | 97/8465 | 6.12e-07 | 4.10e-06 | 2.10e-06 | 72 |
| hsa051609 | Esophagus | ESCC | Hepatitis C | 107/4205 | 157/8465 | 1.75e-06 | 1.08e-05 | 5.55e-06 | 107 |
| hsa0521910 | Esophagus | ESCC | Bladder cancer | 35/4205 | 41/8465 | 1.91e-06 | 1.15e-05 | 5.87e-06 | 35 |
| Page: 1 2 3 4 5 6 7 8 9 10 11 12 13 14 15 16 17 |
Top |
Cell-cell communication analysis |
| Identification of potential cell-cell interactions between two cell types and their ligand-receptor pairs for different disease states |
| Ligand | Receptor | LRpair | Pathway | Tissue | Disease Stage |
| Page: 1 |
Top |
Single-cell gene regulatory network inference analysis |
| Find out the significant the regulons (TFs) and the target genes of each regulon across cell types for different disease states |
| TF | Cell Type | Tissue | Disease Stage | Target Gene | RSS | Regulon Activity |
| ∗The dot plots of a searched regulon are shown for all cell subpopulations in each disease state of each tissue based on the regulon specific score inferred using pySCENIC and by calculating the average expression. |
| Page: 1 |
Top |
Somatic mutation of malignant transformation related genes |
| Annotation of somatic variants for genes involved in malignant transformation |
| Hugo Symbol | Variant Class | Variant Classification | dbSNP RS | HGVSc | HGVSp | HGVSp Short | SWISSPROT | BIOTYPE | SIFT | PolyPhen | Tumor Sample Barcode | Tissue | Histology | Sex | Age | Stage | Therapy Types | Drugs | Outcome |
| NRAS | SNV | Missense_Mutation | c.170N>C | p.Asp57Ala | p.D57A | P01111 | protein_coding | deleterious(0) | probably_damaging(0.966) | TCGA-AO-A128-01 | Breast | breast invasive carcinoma | Female | <65 | I/II | Chemotherapy | doxorubicin | SD | |
| NRAS | SNV | Missense_Mutation | c.523N>A | p.Asp175Asn | p.D175N | P01111 | protein_coding | tolerated(0.39) | benign(0) | TCGA-E2-A1IN-01 | Breast | breast invasive carcinoma | Female | <65 | I/II | Hormone Therapy | arimidex | SD | |
| NRAS | SNV | Missense_Mutation | rs758669528 | c.491G>A | p.Arg164His | p.R164H | P01111 | protein_coding | deleterious(0.01) | benign(0.041) | TCGA-2W-A8YY-01 | Cervix | cervical & endocervical cancer | Female | <65 | I/II | Chemotherapy | cisplatin | CR |
| NRAS | SNV | Missense_Mutation | c.436G>T | p.Ala146Ser | p.A146S | P01111 | protein_coding | deleterious(0.02) | probably_damaging(0.993) | TCGA-2W-A8YY-01 | Cervix | cervical & endocervical cancer | Female | <65 | I/II | Chemotherapy | cisplatin | CR | |
| NRAS | SNV | Missense_Mutation | c.216N>A | p.Met72Ile | p.M72I | P01111 | protein_coding | tolerated(0.12) | possibly_damaging(0.562) | TCGA-LP-A4AV-01 | Cervix | cervical & endocervical cancer | Female | <65 | I/II | Unknown | Unknown | SD | |
| NRAS | SNV | Missense_Mutation | rs121913237 | c.35G>A | p.Gly12Asp | p.G12D | P01111 | protein_coding | deleterious(0) | benign(0.339) | TCGA-3L-AA1B-01 | Colorectum | colon adenocarcinoma | Female | <65 | I/II | Unknown | Unknown | SD |
| NRAS | SNV | Missense_Mutation | rs121913254 | c.181N>A | p.Gln61Lys | p.Q61K | P01111 | protein_coding | deleterious(0.01) | possibly_damaging(0.709) | TCGA-AA-3509-01 | Colorectum | colon adenocarcinoma | Female | <65 | I/II | Unknown | Unknown | SD |
| NRAS | SNV | Missense_Mutation | rs121913254 | c.181N>A | p.Gln61Lys | p.Q61K | P01111 | protein_coding | deleterious(0.01) | possibly_damaging(0.709) | TCGA-AA-3666-01 | Colorectum | colon adenocarcinoma | Male | >=65 | III/IV | Unknown | Unknown | PD |
| NRAS | SNV | Missense_Mutation | rs11554290 | c.182N>T | p.Gln61Leu | p.Q61L | P01111 | protein_coding | deleterious(0) | possibly_damaging(0.861) | TCGA-AA-3819-01 | Colorectum | colon adenocarcinoma | Female | <65 | I/II | Unknown | Unknown | SD |
| NRAS | SNV | Missense_Mutation | rs121913237 | c.35N>C | p.Gly12Ala | p.G12A | P01111 | protein_coding | deleterious(0.02) | possibly_damaging(0.525) | TCGA-AA-3850-01 | Colorectum | colon adenocarcinoma | Male | >=65 | I/II | Unknown | Unknown | PD |
| Page: 1 2 3 4 5 6 7 8 9 10 11 12 |
Top |
Related drugs of malignant transformation related genes |
| Identification of chemicals and drugs interact with genes involved in malignant transfromation |
| (DGIdb 4.0) |
| Entrez ID | Symbol | Category | Interaction Types | Drug Claim Name | Drug Name | PMIDs |
| 4893 | NRAS | CLINICALLY ACTIONABLE, DRUG RESISTANCE, ENZYME | GI-4000 | |||
| 4893 | NRAS | CLINICALLY ACTIONABLE, DRUG RESISTANCE, ENZYME | Cetuximab | CETUXIMAB | 25838391,27002107,28179366,25605843 | |
| 4893 | NRAS | CLINICALLY ACTIONABLE, DRUG RESISTANCE, ENZYME | BYL719 | ALPELISIB | 24569456 | |
| 4893 | NRAS | CLINICALLY ACTIONABLE, DRUG RESISTANCE, ENZYME | Everolimus | EVEROLIMUS | 23629727 | |
| 4893 | NRAS | CLINICALLY ACTIONABLE, DRUG RESISTANCE, ENZYME | inhibitor | 249565704 | LONAFARNIB | |
| 4893 | NRAS | CLINICALLY ACTIONABLE, DRUG RESISTANCE, ENZYME | TRAMETINIB | TRAMETINIB | 25504439,23515407,25452114,23431193 | |
| 4893 | NRAS | CLINICALLY ACTIONABLE, DRUG RESISTANCE, ENZYME | MK2206 | MK-2206 | 21289267 | |
| 4893 | NRAS | CLINICALLY ACTIONABLE, DRUG RESISTANCE, ENZYME | EVEROLIMUS | EVEROLIMUS | 26821351 | |
| 4893 | NRAS | CLINICALLY ACTIONABLE, DRUG RESISTANCE, ENZYME | CC-90003 | |||
| 4893 | NRAS | CLINICALLY ACTIONABLE, DRUG RESISTANCE, ENZYME | Salirasib | SALIRASIB |
| Page: 1 2 3 4 5 6 7 8 9 10 11 |

Copyright 2023-Present -The University of Texas Health Science Center at Houston |