
|
|||||
|
 | |
| |
| |
| |
| |
| |
|
Gene: NR6A1 |
Gene summary for NR6A1 |
| Gene information | Species | Human | Gene symbol | NR6A1 | Gene ID | 2649 |
| Gene name | nuclear receptor subfamily 6 group A member 1 | |
| Gene Alias | CT150 | |
| Cytomap | 9q33.3 | |
| Gene Type | protein-coding | GO ID | GO:0000003 | UniProtAcc | F1DAM1 |
Top |
Malignant transformation analysis |
| Identification of the aberrant gene expression in precancerous and cancerous lesions by comparing the gene expression of stem-like cells in diseased tissues with normal stem cells |
| Entrez ID | Symbol | Replicates | Species | Organ | Tissue | Adj P-value | Log2FC | Malignancy |
| 2649 | NR6A1 | CCI_1 | Human | Cervix | CC | 7.22e-20 | 1.34e+00 | 0.528 |
| 2649 | NR6A1 | CCI_2 | Human | Cervix | CC | 9.04e-31 | 2.79e+00 | 0.5249 |
| 2649 | NR6A1 | CCI_3 | Human | Cervix | CC | 1.26e-28 | 1.49e+00 | 0.516 |
| 2649 | NR6A1 | HTA11_3410_2000001011 | Human | Colorectum | AD | 1.09e-22 | -5.66e-01 | 0.0155 |
| 2649 | NR6A1 | HTA11_2487_2000001011 | Human | Colorectum | SER | 2.21e-07 | -5.74e-01 | -0.1808 |
| 2649 | NR6A1 | HTA11_2112_2000001011 | Human | Colorectum | SER | 4.63e-07 | -1.05e+00 | -0.2196 |
| 2649 | NR6A1 | HTA11_3361_2000001011 | Human | Colorectum | AD | 1.44e-17 | -8.05e-01 | -0.1207 |
| 2649 | NR6A1 | HTA11_83_2000001011 | Human | Colorectum | SER | 3.30e-03 | -4.04e-01 | -0.1526 |
| 2649 | NR6A1 | HTA11_696_2000001011 | Human | Colorectum | AD | 9.03e-12 | -4.53e-01 | -0.1464 |
| 2649 | NR6A1 | HTA11_2992_2000001011 | Human | Colorectum | SER | 1.92e-03 | -6.88e-01 | -0.1706 |
| 2649 | NR6A1 | HTA11_5212_2000001011 | Human | Colorectum | AD | 5.52e-07 | -8.17e-01 | -0.2061 |
| 2649 | NR6A1 | HTA11_5216_2000001011 | Human | Colorectum | SER | 9.99e-07 | -9.05e-01 | -0.1462 |
| 2649 | NR6A1 | HTA11_9408_2000001011 | Human | Colorectum | AD | 5.82e-04 | -7.25e-01 | 0.0451 |
| 2649 | NR6A1 | HTA11_8622_2000001021 | Human | Colorectum | SER | 3.05e-03 | -4.07e-01 | 0.0528 |
| 2649 | NR6A1 | HTA11_7696_3000711011 | Human | Colorectum | AD | 2.10e-10 | -4.86e-01 | 0.0674 |
| 2649 | NR6A1 | HTA11_99999970781_79442 | Human | Colorectum | MSS | 2.44e-20 | -6.02e-01 | 0.294 |
| 2649 | NR6A1 | HTA11_99999965062_69753 | Human | Colorectum | MSI-H | 4.48e-02 | 6.68e-01 | 0.3487 |
| 2649 | NR6A1 | HTA11_99999965104_69814 | Human | Colorectum | MSS | 1.23e-15 | 1.05e+00 | 0.281 |
| 2649 | NR6A1 | HTA11_99999971662_82457 | Human | Colorectum | MSS | 4.28e-02 | 3.89e-01 | 0.3859 |
| 2649 | NR6A1 | HTA11_99999974143_84620 | Human | Colorectum | MSS | 3.12e-06 | -3.13e-01 | 0.3005 |
| Page: 1 2 3 4 |
| Tissue | Expression Dynamics | Abbreviation |
| Cervix | 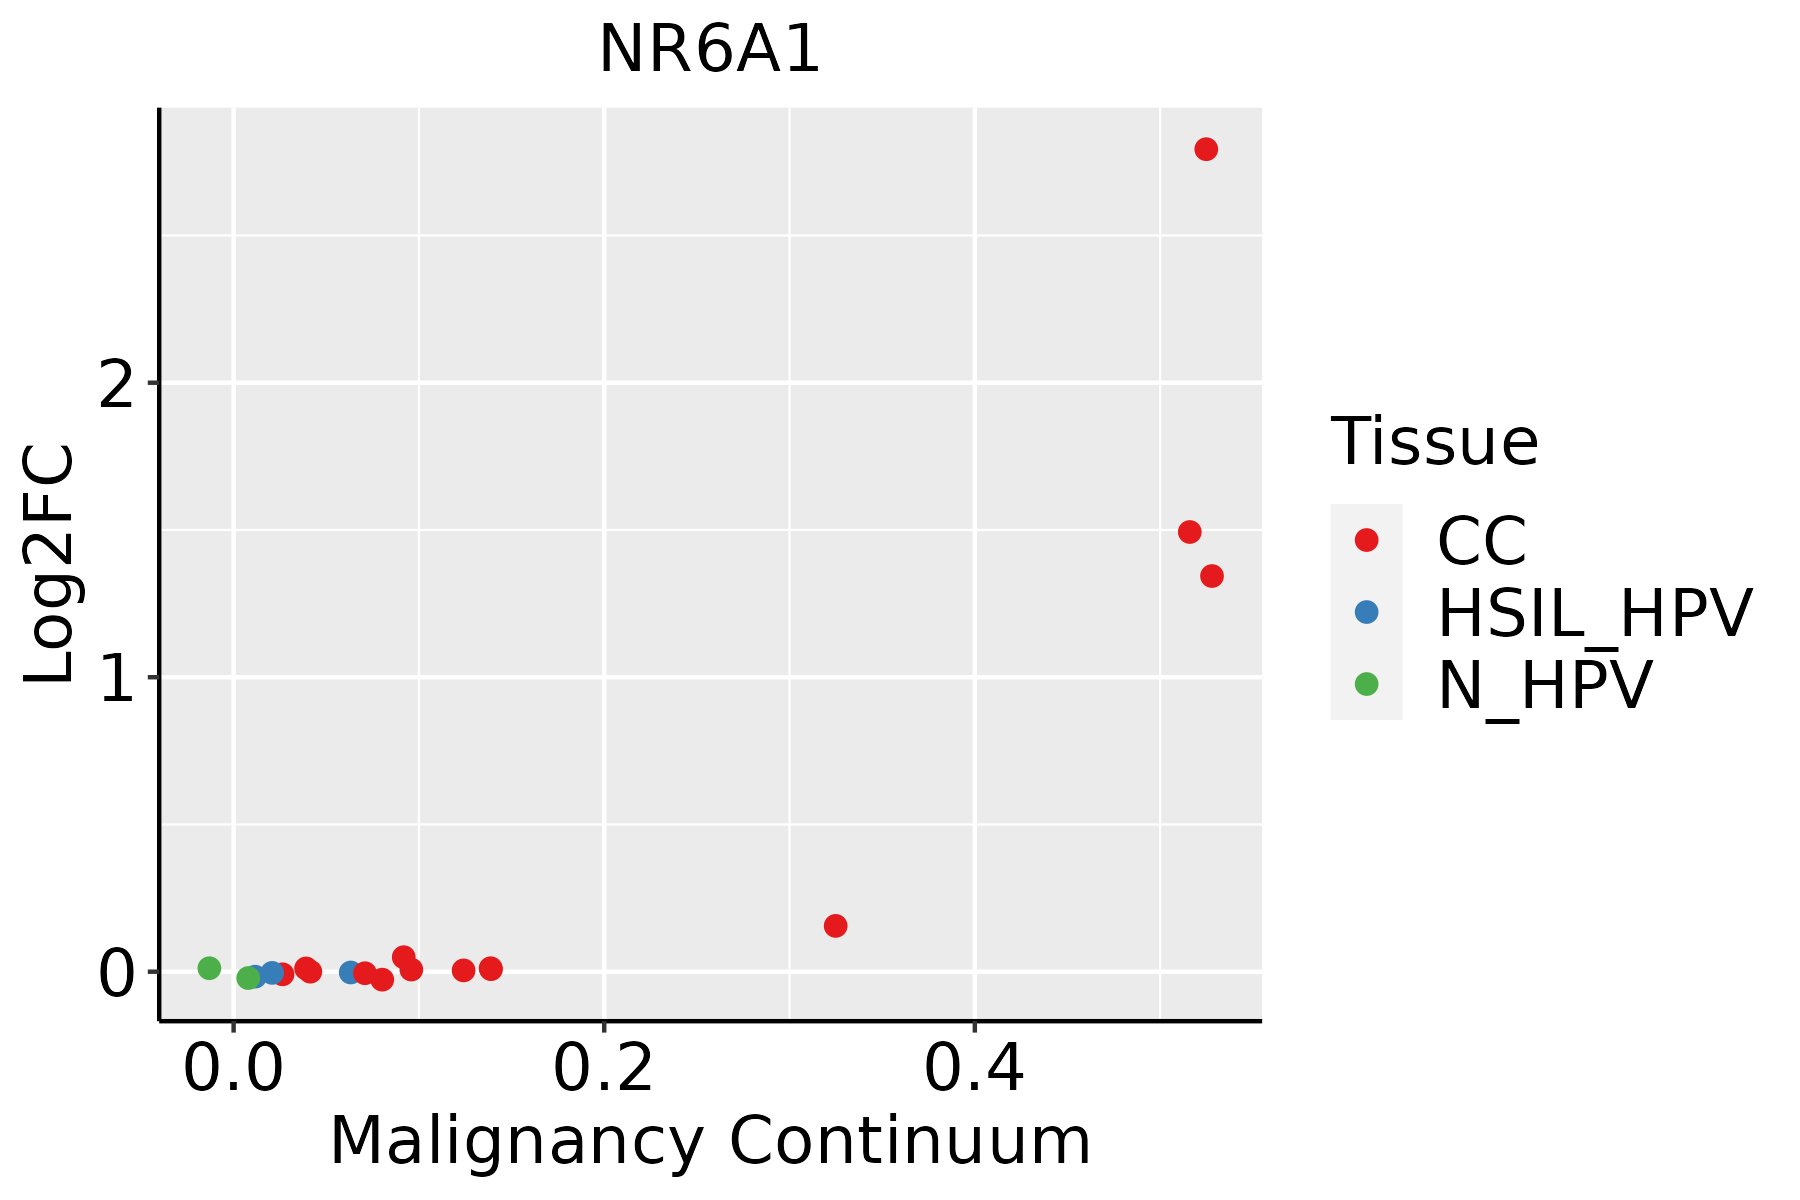 | CC: Cervix cancer |
| HSIL_HPV: HPV-infected high-grade squamous intraepithelial lesions | ||
| N_HPV: HPV-infected normal cervix | ||
| Colorectum (GSE201348) |  | FAP: Familial adenomatous polyposis |
| CRC: Colorectal cancer | ||
| Colorectum (HTA11) |  | AD: Adenomas |
| SER: Sessile serrated lesions | ||
| MSI-H: Microsatellite-high colorectal cancer | ||
| MSS: Microsatellite stable colorectal cancer | ||
| Endometrium |  | AEH: Atypical endometrial hyperplasia |
| EEC: Endometrioid Cancer | ||
| Liver | 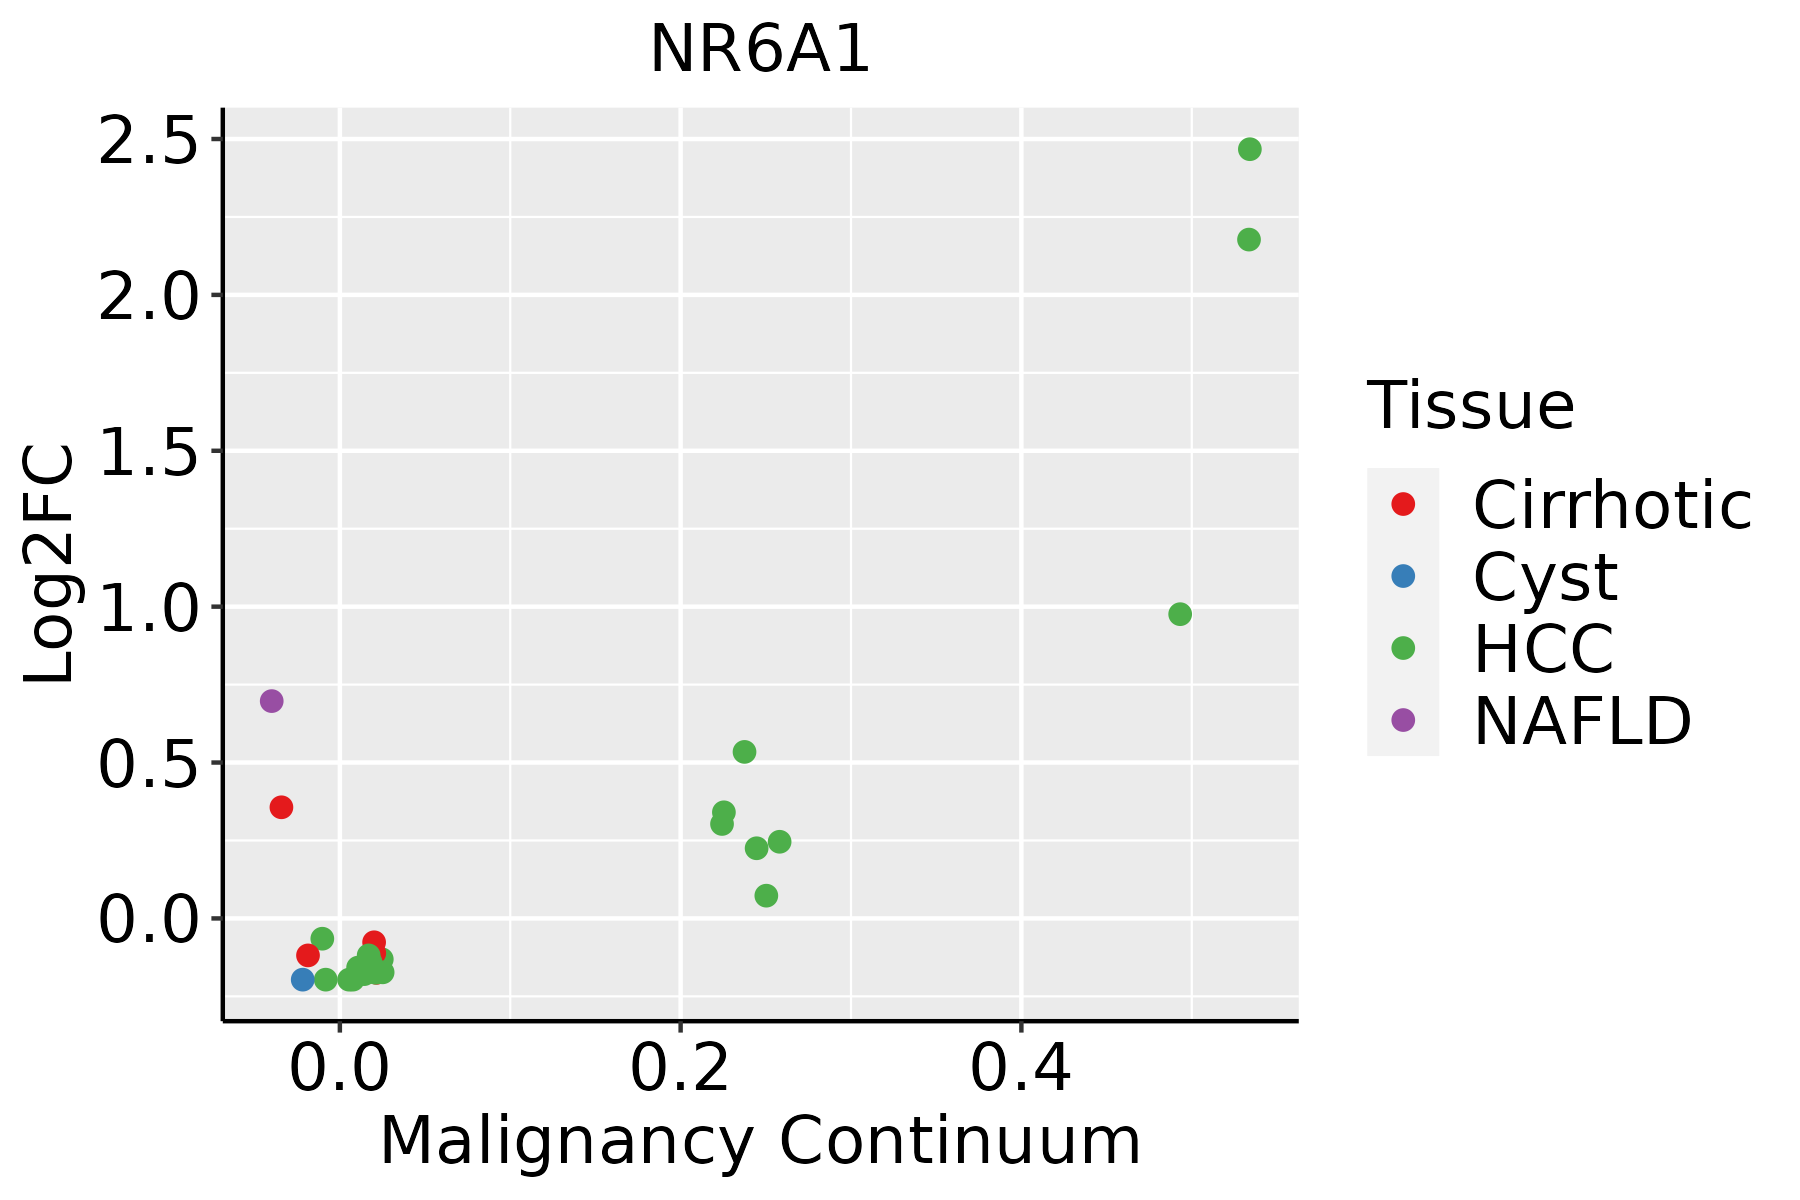 | HCC: Hepatocellular carcinoma |
| NAFLD: Non-alcoholic fatty liver disease | ||
| Lung | 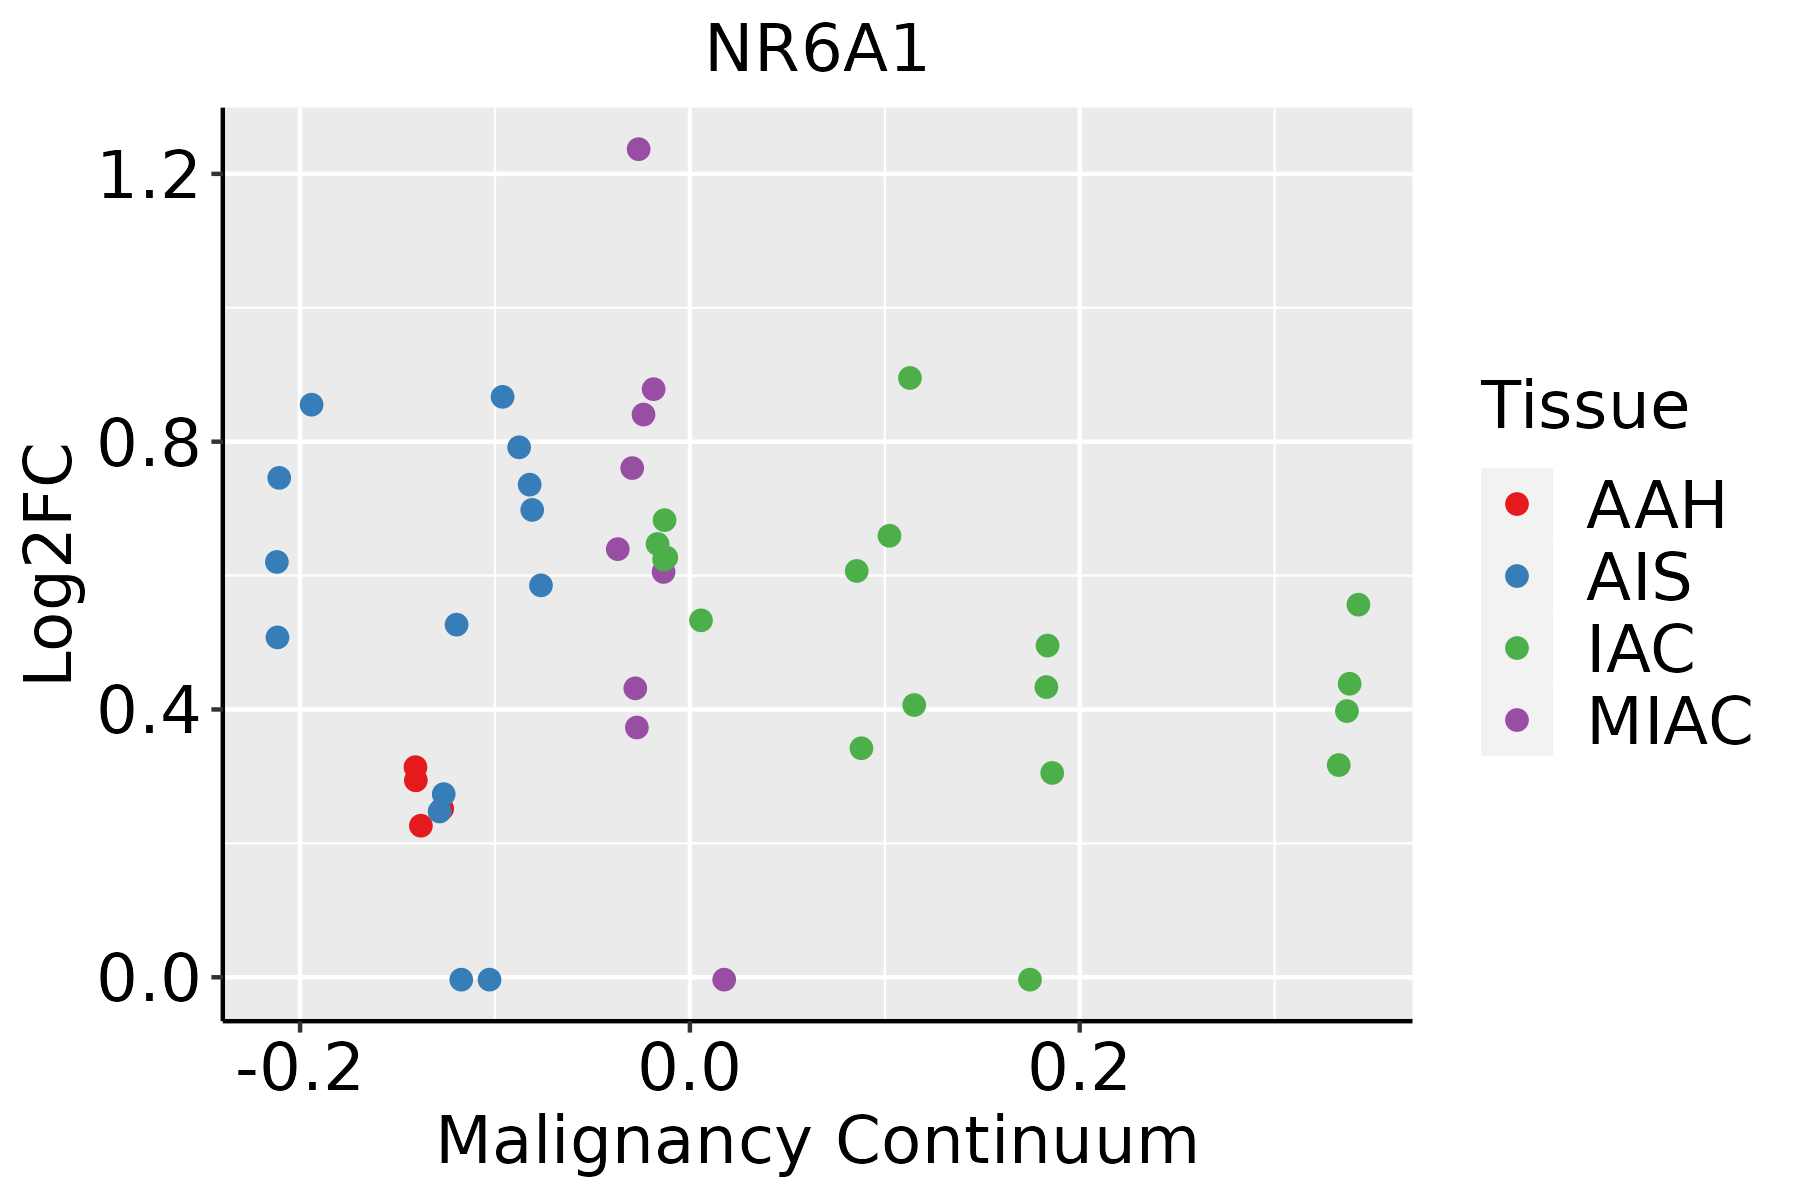 | AAH: Atypical adenomatous hyperplasia |
| AIS: Adenocarcinoma in situ | ||
| IAC: Invasive lung adenocarcinoma | ||
| MIA: Minimally invasive adenocarcinoma |
| ∗log2FC in expression of this searched gene in stem-like cells from each diseased tissue sample relative to stem-like cells in normal samples in each tissue plotted against the malignancy continuum. Samples are colored based on if they are from different disease stage. |
Top |
Malignant transformation related pathway analysis |
| Find out the enriched GO biological processes and KEGG pathways involved in transition from healthy to precancer to cancer |
| Tissue | Disease Stage | Enriched GO biological Processes |
| Colorectum | AD |  |
| Colorectum | SER |  |
| Colorectum | MSS |  |
| Colorectum | MSI-H |  |
| Colorectum | FAP |  |
| ∗Top 15 enriched GO BP terms are showed in the bar plot of each disease state in each tissue. Each row represents a significant GO biological process which is colored according to the -log10(p.adjust). |
| Page: 1 2 3 4 5 6 7 8 9 |
| GO ID | Tissue | Disease Stage | Description | Gene Ratio | Bg Ratio | pvalue | p.adjust | Count |
| GO:00305229 | Cervix | CC | intracellular receptor signaling pathway | 60/2311 | 265/18723 | 1.89e-06 | 5.97e-05 | 60 |
| GO:0030522 | Colorectum | AD | intracellular receptor signaling pathway | 87/3918 | 265/18723 | 3.69e-06 | 1.03e-04 | 87 |
| GO:00305221 | Colorectum | SER | intracellular receptor signaling pathway | 63/2897 | 265/18723 | 2.47e-04 | 4.20e-03 | 63 |
| GO:00305222 | Colorectum | MSS | intracellular receptor signaling pathway | 84/3467 | 265/18723 | 1.47e-07 | 6.79e-06 | 84 |
| GO:00305223 | Colorectum | FAP | intracellular receptor signaling pathway | 67/2622 | 265/18723 | 6.84e-07 | 3.28e-05 | 67 |
| GO:00305224 | Colorectum | CRC | intracellular receptor signaling pathway | 61/2078 | 265/18723 | 2.00e-08 | 3.23e-06 | 61 |
| GO:003052210 | Endometrium | AEH | intracellular receptor signaling pathway | 60/2100 | 265/18723 | 7.16e-08 | 3.77e-06 | 60 |
| GO:003052215 | Endometrium | EEC | intracellular receptor signaling pathway | 65/2168 | 265/18723 | 2.52e-09 | 1.96e-07 | 65 |
| GO:00305226 | Liver | NAFLD | intracellular receptor signaling pathway | 55/1882 | 265/18723 | 1.39e-07 | 1.03e-05 | 55 |
| GO:003052222 | Liver | HCC | intracellular receptor signaling pathway | 171/7958 | 265/18723 | 3.00e-13 | 1.61e-11 | 171 |
| GO:00305227 | Lung | IAC | intracellular receptor signaling pathway | 59/2061 | 265/18723 | 8.88e-08 | 8.50e-06 | 59 |
| GO:003052213 | Lung | AIS | intracellular receptor signaling pathway | 53/1849 | 265/18723 | 4.57e-07 | 3.55e-05 | 53 |
| GO:003052223 | Lung | MIAC | intracellular receptor signaling pathway | 27/967 | 265/18723 | 6.08e-04 | 1.50e-02 | 27 |
| Page: 1 |
| Pathway ID | Tissue | Disease Stage | Description | Gene Ratio | Bg Ratio | pvalue | p.adjust | qvalue | Count |
| Page: 1 |
Top |
Cell-cell communication analysis |
| Identification of potential cell-cell interactions between two cell types and their ligand-receptor pairs for different disease states |
| Ligand | Receptor | LRpair | Pathway | Tissue | Disease Stage |
| Page: 1 |
Top |
Single-cell gene regulatory network inference analysis |
| Find out the significant the regulons (TFs) and the target genes of each regulon across cell types for different disease states |
| TF | Cell Type | Tissue | Disease Stage | Target Gene | RSS | Regulon Activity |
| NR6A1 | STM | Breast | ADJ | PPP4R4,AC092747.4,PPP1R12C, etc. | 2.27e-02 |  |
| NR6A1 | GLIA | Colorectum | CRC | SMARCD1,CADM2,ZNF460-AS1, etc. | 3.20e-02 |  |
| NR6A1 | GLIA | Colorectum | FAP | SMARCD1,CADM2,ZNF460-AS1, etc. | 6.69e-02 |  |
| NR6A1 | GLIA | Colorectum | Healthy | SMARCD1,CADM2,ZNF460-AS1, etc. | 2.45e-01 |  |
| NR6A1 | PLA | Lung | AAH | TBC1D4,PLEKHA5,ZC3H7B, etc. | 2.54e-02 |  |
| ∗The dot plots of a searched regulon are shown for all cell subpopulations in each disease state of each tissue based on the regulon specific score inferred using pySCENIC and by calculating the average expression. |
| Page: 1 |
Top |
Somatic mutation of malignant transformation related genes |
| Annotation of somatic variants for genes involved in malignant transformation |
| Hugo Symbol | Variant Class | Variant Classification | dbSNP RS | HGVSc | HGVSp | HGVSp Short | SWISSPROT | BIOTYPE | SIFT | PolyPhen | Tumor Sample Barcode | Tissue | Histology | Sex | Age | Stage | Therapy Types | Drugs | Outcome |
| NR6A1 | SNV | Missense_Mutation | c.366G>C | p.Gln122His | p.Q122H | Q15406 | protein_coding | deleterious(0.02) | benign(0.309) | TCGA-A2-A04R-01 | Breast | breast invasive carcinoma | Female | <65 | I/II | Chemotherapy | taxol | SD | |
| NR6A1 | SNV | Missense_Mutation | rs760817530 | c.460N>A | p.Glu154Lys | p.E154K | Q15406 | protein_coding | tolerated(0.63) | benign(0.06) | TCGA-AN-A046-01 | Breast | breast invasive carcinoma | Female | >=65 | I/II | Unknown | Unknown | SD |
| NR6A1 | SNV | Missense_Mutation | rs771035345 | c.197N>A | p.Arg66His | p.R66H | Q15406 | protein_coding | deleterious(0) | probably_damaging(0.996) | TCGA-AO-A124-01 | Breast | breast invasive carcinoma | Female | <65 | I/II | Chemotherapy | doxorubicin | SD |
| NR6A1 | SNV | Missense_Mutation | novel | c.614N>G | p.Asn205Ser | p.N205S | Q15406 | protein_coding | tolerated(0.54) | benign(0.001) | TCGA-B6-A0IK-01 | Breast | breast invasive carcinoma | Female | <65 | III/IV | Unknown | Unknown | PD |
| NR6A1 | SNV | Missense_Mutation | novel | c.1025N>A | p.Gly342Glu | p.G342E | Q15406 | protein_coding | deleterious(0.04) | possibly_damaging(0.836) | TCGA-BH-A0GZ-01 | Breast | breast invasive carcinoma | Female | <65 | I/II | Hormone Therapy | arimidex | SD |
| NR6A1 | SNV | Missense_Mutation | novel | c.317N>A | p.Arg106Gln | p.R106Q | Q15406 | protein_coding | deleterious(0.01) | possibly_damaging(0.845) | TCGA-GI-A2C9-01 | Breast | breast invasive carcinoma | Female | <65 | I/II | Unspecific | SD | |
| NR6A1 | insertion | In_Frame_Ins | novel | c.611_612insAGCCTGGTGGCATGTGACCACTTTAAGTGCAGGCTT | p.Leu204_Asn205insAlaTrpTrpHisValThrThrLeuSerAlaGlyLeu | p.L204_N205insAWWHVTTLSAGL | Q15406 | protein_coding | TCGA-B6-A0IK-01 | Breast | breast invasive carcinoma | Female | <65 | III/IV | Unknown | Unknown | PD | ||
| NR6A1 | SNV | Missense_Mutation | novel | c.1078N>G | p.Arg360Gly | p.R360G | Q15406 | protein_coding | tolerated(0.38) | benign(0.012) | TCGA-2W-A8YY-01 | Cervix | cervical & endocervical cancer | Female | <65 | I/II | Chemotherapy | cisplatin | CR |
| NR6A1 | SNV | Missense_Mutation | c.813N>C | p.Leu271Phe | p.L271F | Q15406 | protein_coding | tolerated(0.11) | possibly_damaging(0.851) | TCGA-DS-A0VM-01 | Cervix | cervical & endocervical cancer | Female | <65 | I/II | Chemotherapy | cisplatin | PD | |
| NR6A1 | SNV | Missense_Mutation | c.1166A>G | p.Tyr389Cys | p.Y389C | Q15406 | protein_coding | deleterious(0) | probably_damaging(0.994) | TCGA-A6-2672-01 | Colorectum | colon adenocarcinoma | Female | >=65 | III/IV | Unknown | Unknown | SD |
| Page: 1 2 3 4 |
Top |
Related drugs of malignant transformation related genes |
| Identification of chemicals and drugs interact with genes involved in malignant transfromation |
| (DGIdb 4.0) |
| Entrez ID | Symbol | Category | Interaction Types | Drug Claim Name | Drug Name | PMIDs |
| 2649 | NR6A1 | TRANSCRIPTION FACTOR COMPLEX, NUCLEAR HORMONE RECEPTOR, DRUGGABLE GENOME | ANTISERUM | 15273870,12606326 |
| Page: 1 |

Copyright 2023-Present -The University of Texas Health Science Center at Houston |