
|
|||||
|
 | |
| |
| |
| |
| |
| |
|
Gene: NR5A2 |
Gene summary for NR5A2 |
| Gene information | Species | Human | Gene symbol | NR5A2 | Gene ID | 2494 |
| Gene name | nuclear receptor subfamily 5 group A member 2 | |
| Gene Alias | B1F | |
| Cytomap | 1q32.1 | |
| Gene Type | protein-coding | GO ID | GO:0006082 | UniProtAcc | O00482 |
Top |
Malignant transformation analysis |
| Identification of the aberrant gene expression in precancerous and cancerous lesions by comparing the gene expression of stem-like cells in diseased tissues with normal stem cells |
| Entrez ID | Symbol | Replicates | Species | Organ | Tissue | Adj P-value | Log2FC | Malignancy |
| 2494 | NR5A2 | HTA11_3410_2000001011 | Human | Colorectum | AD | 5.81e-44 | -1.06e+00 | 0.0155 |
| 2494 | NR5A2 | HTA11_2951_2000001011 | Human | Colorectum | AD | 6.80e-08 | -1.05e+00 | 0.0216 |
| 2494 | NR5A2 | HTA11_1938_2000001011 | Human | Colorectum | AD | 8.63e-07 | -6.47e-01 | -0.0811 |
| 2494 | NR5A2 | HTA11_78_2000001011 | Human | Colorectum | AD | 8.29e-03 | -4.96e-01 | -0.1088 |
| 2494 | NR5A2 | HTA11_347_2000001011 | Human | Colorectum | AD | 6.25e-11 | 6.23e-01 | -0.1954 |
| 2494 | NR5A2 | HTA11_3361_2000001011 | Human | Colorectum | AD | 3.54e-13 | -8.08e-01 | -0.1207 |
| 2494 | NR5A2 | HTA11_696_2000001011 | Human | Colorectum | AD | 7.64e-13 | -5.21e-01 | -0.1464 |
| 2494 | NR5A2 | HTA11_866_2000001011 | Human | Colorectum | AD | 1.88e-12 | -5.74e-01 | -0.1001 |
| 2494 | NR5A2 | HTA11_9341_2000001011 | Human | Colorectum | SER | 9.28e-05 | -9.25e-01 | -0.00410000000000005 |
| 2494 | NR5A2 | HTA11_866_3004761011 | Human | Colorectum | AD | 1.76e-38 | -1.04e+00 | 0.096 |
| 2494 | NR5A2 | HTA11_9408_2000001011 | Human | Colorectum | AD | 1.23e-06 | -1.13e+00 | 0.0451 |
| 2494 | NR5A2 | HTA11_8622_2000001021 | Human | Colorectum | SER | 1.76e-08 | -7.86e-01 | 0.0528 |
| 2494 | NR5A2 | HTA11_10711_2000001011 | Human | Colorectum | AD | 3.27e-23 | -1.03e+00 | 0.0338 |
| 2494 | NR5A2 | HTA11_7696_3000711011 | Human | Colorectum | AD | 6.87e-55 | -1.08e+00 | 0.0674 |
| 2494 | NR5A2 | HTA11_6818_2000001011 | Human | Colorectum | AD | 2.82e-10 | -7.56e-01 | 0.0112 |
| 2494 | NR5A2 | HTA11_7469_2000001011 | Human | Colorectum | AD | 2.37e-02 | -5.33e-01 | -0.0124 |
| 2494 | NR5A2 | HTA11_11156_2000001011 | Human | Colorectum | AD | 3.55e-05 | -1.01e+00 | 0.0397 |
| 2494 | NR5A2 | HTA11_6818_2000001021 | Human | Colorectum | AD | 2.41e-24 | -1.17e+00 | 0.0588 |
| 2494 | NR5A2 | HTA11_99999970781_79442 | Human | Colorectum | MSS | 1.70e-78 | -1.23e+00 | 0.294 |
| 2494 | NR5A2 | HTA11_99999965062_69753 | Human | Colorectum | MSI-H | 1.89e-02 | -9.30e-01 | 0.3487 |
| Page: 1 2 3 4 |
| Tissue | Expression Dynamics | Abbreviation |
| Colorectum (GSE201348) |  | FAP: Familial adenomatous polyposis |
| CRC: Colorectal cancer | ||
| Colorectum (HTA11) |  | AD: Adenomas |
| SER: Sessile serrated lesions | ||
| MSI-H: Microsatellite-high colorectal cancer | ||
| MSS: Microsatellite stable colorectal cancer | ||
| Endometrium | 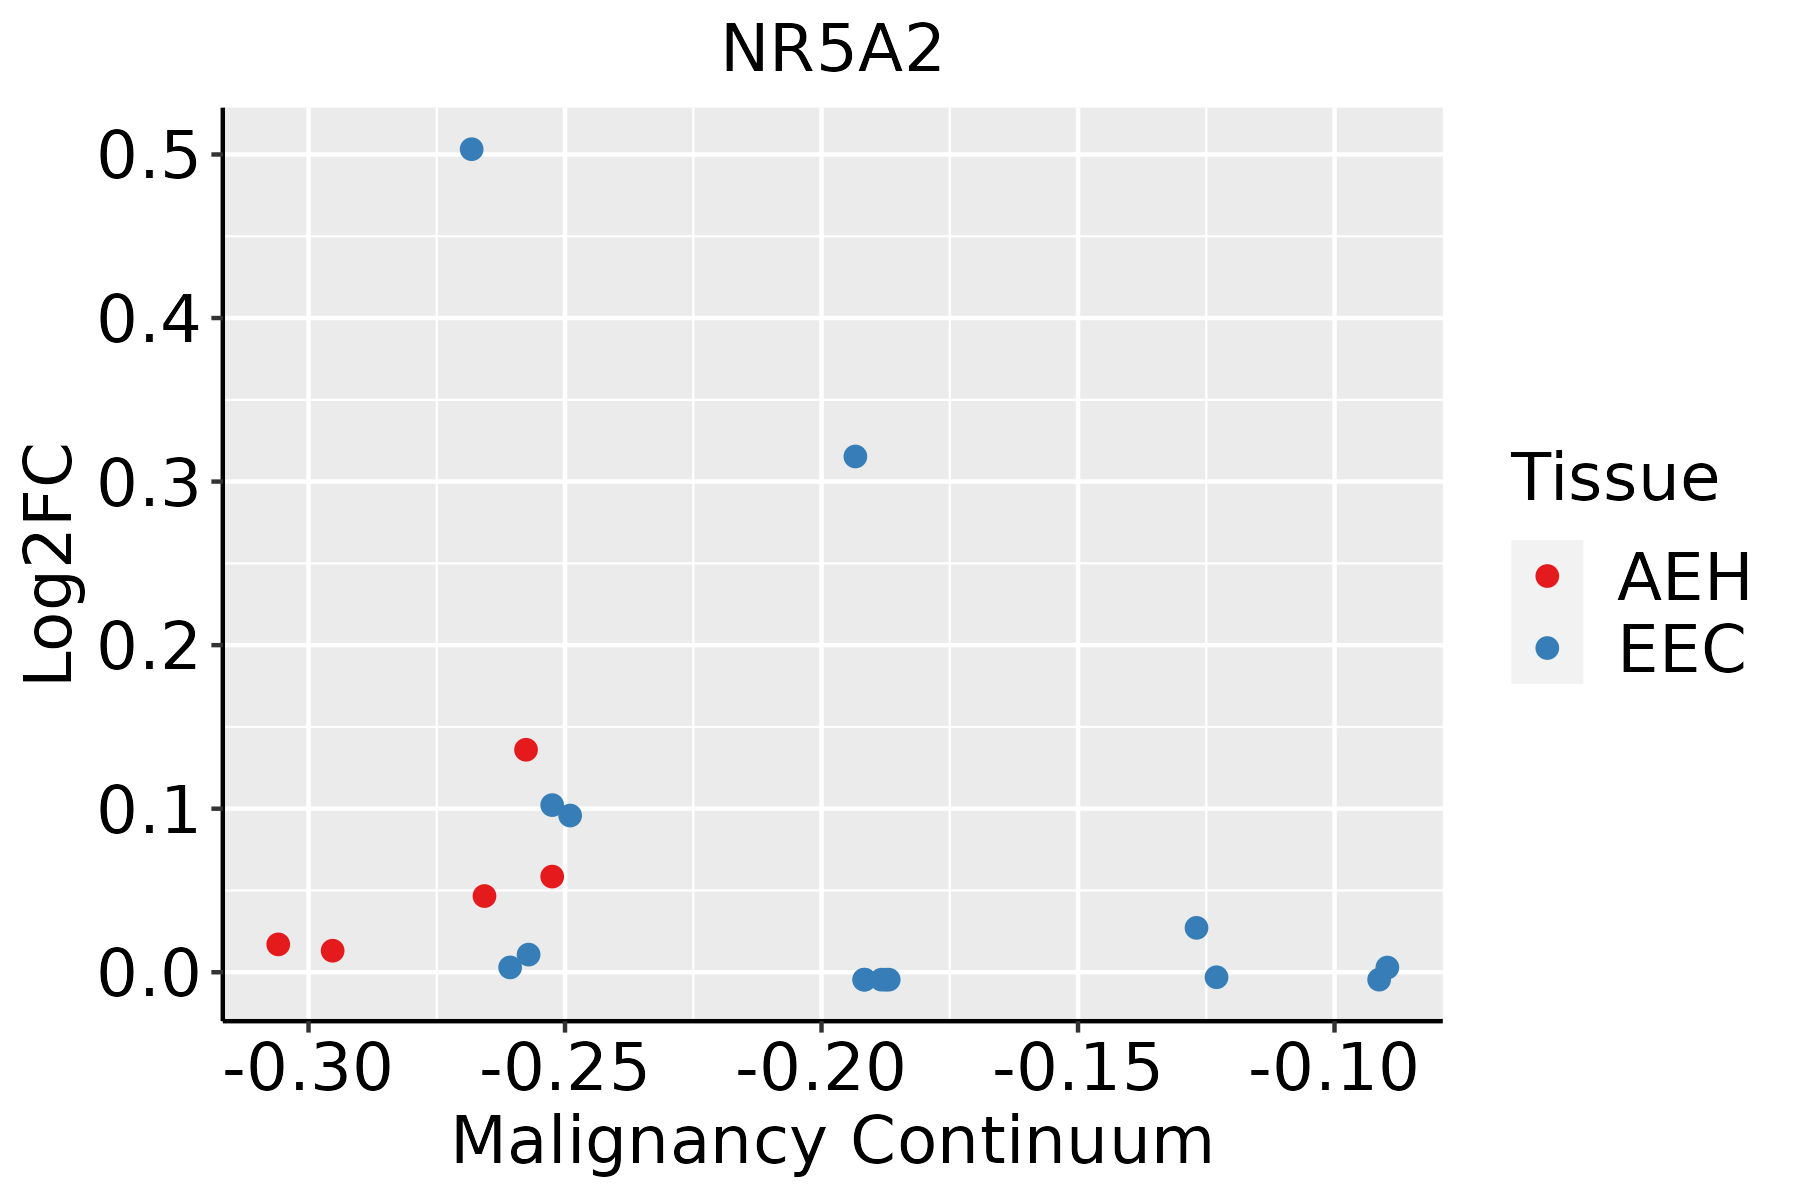 | AEH: Atypical endometrial hyperplasia |
| EEC: Endometrioid Cancer | ||
| Liver |  | HCC: Hepatocellular carcinoma |
| NAFLD: Non-alcoholic fatty liver disease |
| ∗log2FC in expression of this searched gene in stem-like cells from each diseased tissue sample relative to stem-like cells in normal samples in each tissue plotted against the malignancy continuum. Samples are colored based on if they are from different disease stage. |
Top |
Malignant transformation related pathway analysis |
| Find out the enriched GO biological processes and KEGG pathways involved in transition from healthy to precancer to cancer |
| Tissue | Disease Stage | Enriched GO biological Processes |
| Colorectum | AD |  |
| Colorectum | SER |  |
| Colorectum | MSS |  |
| Colorectum | MSI-H |  |
| Colorectum | FAP |  |
| ∗Top 15 enriched GO BP terms are showed in the bar plot of each disease state in each tissue. Each row represents a significant GO biological process which is colored according to the -log10(p.adjust). |
| Page: 1 2 3 4 5 6 7 8 9 |
| GO ID | Tissue | Disease Stage | Description | Gene Ratio | Bg Ratio | pvalue | p.adjust | Count |
| GO:0016032 | Colorectum | AD | viral process | 168/3918 | 415/18723 | 4.67e-20 | 3.66e-17 | 168 |
| GO:0019058 | Colorectum | AD | viral life cycle | 119/3918 | 317/18723 | 6.18e-12 | 8.23e-10 | 119 |
| GO:0048524 | Colorectum | AD | positive regulation of viral process | 31/3918 | 65/18723 | 1.33e-06 | 4.23e-05 | 31 |
| GO:0019079 | Colorectum | AD | viral genome replication | 51/3918 | 131/18723 | 1.83e-06 | 5.51e-05 | 51 |
| GO:0030522 | Colorectum | AD | intracellular receptor signaling pathway | 87/3918 | 265/18723 | 3.69e-06 | 1.03e-04 | 87 |
| GO:0050792 | Colorectum | AD | regulation of viral process | 59/3918 | 164/18723 | 5.95e-06 | 1.52e-04 | 59 |
| GO:0009755 | Colorectum | AD | hormone-mediated signaling pathway | 64/3918 | 190/18723 | 2.78e-05 | 5.24e-04 | 64 |
| GO:1903900 | Colorectum | AD | regulation of viral life cycle | 51/3918 | 148/18723 | 9.01e-05 | 1.38e-03 | 51 |
| GO:0045069 | Colorectum | AD | regulation of viral genome replication | 32/3918 | 85/18723 | 2.97e-04 | 3.60e-03 | 32 |
| GO:0045070 | Colorectum | AD | positive regulation of viral genome replication | 14/3918 | 30/18723 | 1.43e-03 | 1.22e-02 | 14 |
| GO:0008202 | Colorectum | AD | steroid metabolic process | 85/3918 | 319/18723 | 8.07e-03 | 4.75e-02 | 85 |
| GO:00160321 | Colorectum | SER | viral process | 118/2897 | 415/18723 | 8.36e-12 | 1.65e-09 | 118 |
| GO:00190581 | Colorectum | SER | viral life cycle | 87/2897 | 317/18723 | 2.82e-08 | 1.94e-06 | 87 |
| GO:00190791 | Colorectum | SER | viral genome replication | 37/2897 | 131/18723 | 1.36e-04 | 2.72e-03 | 37 |
| GO:00097551 | Colorectum | SER | hormone-mediated signaling pathway | 49/2897 | 190/18723 | 1.54e-04 | 3.00e-03 | 49 |
| GO:00305221 | Colorectum | SER | intracellular receptor signaling pathway | 63/2897 | 265/18723 | 2.47e-04 | 4.20e-03 | 63 |
| GO:00507921 | Colorectum | SER | regulation of viral process | 43/2897 | 164/18723 | 2.57e-04 | 4.31e-03 | 43 |
| GO:00485241 | Colorectum | SER | positive regulation of viral process | 21/2897 | 65/18723 | 5.39e-04 | 7.57e-03 | 21 |
| GO:19039001 | Colorectum | SER | regulation of viral life cycle | 38/2897 | 148/18723 | 8.76e-04 | 1.06e-02 | 38 |
| GO:00160322 | Colorectum | MSS | viral process | 157/3467 | 415/18723 | 7.94e-21 | 6.19e-18 | 157 |
| Page: 1 2 3 4 5 6 7 |
| Pathway ID | Tissue | Disease Stage | Description | Gene Ratio | Bg Ratio | pvalue | p.adjust | qvalue | Count |
| Page: 1 |
Top |
Cell-cell communication analysis |
| Identification of potential cell-cell interactions between two cell types and their ligand-receptor pairs for different disease states |
| Ligand | Receptor | LRpair | Pathway | Tissue | Disease Stage |
| Page: 1 |
Top |
Single-cell gene regulatory network inference analysis |
| Find out the significant the regulons (TFs) and the target genes of each regulon across cell types for different disease states |
| TF | Cell Type | Tissue | Disease Stage | Target Gene | RSS | Regulon Activity |
| NR5A2 | MVA | Breast | ADJ | SPARCL1,FAM101B,PLVAP, etc. | 2.51e-01 |  |
| NR5A2 | PVA | Breast | ADJ | SPARCL1,FAM101B,PLVAP, etc. | 2.58e-01 | |
| NR5A2 | MSC.ADIPO | Breast | DCIS | SPARCL1,FAM101B,PLVAP, etc. | 2.54e-01 |  |
| NR5A2 | PVA | Breast | DCIS | SPARCL1,FAM101B,PLVAP, etc. | 5.68e-02 | |
| NR5A2 | MVA | Breast | Healthy | SPARCL1,FAM101B,PLVAP, etc. | 1.37e-01 |  |
| NR5A2 | MSC.ADIPO | Breast | IDC | SPARCL1,FAM101B,PLVAP, etc. | 3.37e-01 |  |
| NR5A2 | LYMEND | Breast | IDC | SPARCL1,FAM101B,PLVAP, etc. | 2.66e-02 | |
| NR5A2 | MVA | Breast | Precancer | SPARCL1,FAM101B,PLVAP, etc. | 2.56e-01 |  |
| NR5A2 | PCV | Cervix | ADJ | VWF,NOSTRIN,KDR, etc. | 9.21e-02 |  |
| NR5A2 | MVA | Cervix | ADJ | VWF,NOSTRIN,KDR, etc. | 2.06e-01 | |
| ∗The dot plots of a searched regulon are shown for all cell subpopulations in each disease state of each tissue based on the regulon specific score inferred using pySCENIC and by calculating the average expression. |
| Page: 1 2 3 4 |
Top |
Somatic mutation of malignant transformation related genes |
| Annotation of somatic variants for genes involved in malignant transformation |
| Hugo Symbol | Variant Class | Variant Classification | dbSNP RS | HGVSc | HGVSp | HGVSp Short | SWISSPROT | BIOTYPE | SIFT | PolyPhen | Tumor Sample Barcode | Tissue | Histology | Sex | Age | Stage | Therapy Types | Drugs | Outcome |
| NR5A2 | SNV | Missense_Mutation | c.554N>A | p.Leu185His | p.L185H | O00482 | protein_coding | tolerated(0.05) | benign(0.106) | TCGA-A7-A0DA-01 | Breast | breast invasive carcinoma | Female | <65 | I/II | Chemotherapy | adriamycin | SD | |
| NR5A2 | SNV | Missense_Mutation | novel | c.557N>C | p.Ile186Thr | p.I186T | O00482 | protein_coding | tolerated(0.1) | possibly_damaging(0.521) | TCGA-A8-A094-01 | Breast | breast invasive carcinoma | Female | >=65 | I/II | Unknown | Unknown | SD |
| NR5A2 | SNV | Missense_Mutation | rs747092960 | c.1438G>A | p.Ala480Thr | p.A480T | O00482 | protein_coding | deleterious(0.05) | probably_damaging(0.946) | TCGA-AR-A2LR-01 | Breast | breast invasive carcinoma | Female | <65 | I/II | Chemotherapy | adriamycin | SD |
| NR5A2 | SNV | Missense_Mutation | c.409C>T | p.Arg137Cys | p.R137C | O00482 | protein_coding | deleterious(0) | probably_damaging(0.928) | TCGA-BH-A18G-01 | Breast | breast invasive carcinoma | Female | >=65 | I/II | Unknown | Unknown | SD | |
| NR5A2 | SNV | Missense_Mutation | c.1466A>G | p.Tyr489Cys | p.Y489C | O00482 | protein_coding | tolerated(0.06) | probably_damaging(0.996) | TCGA-BH-A18G-01 | Breast | breast invasive carcinoma | Female | >=65 | I/II | Unknown | Unknown | SD | |
| NR5A2 | SNV | Missense_Mutation | c.754N>T | p.His252Tyr | p.H252Y | O00482 | protein_coding | tolerated(0.18) | benign(0) | TCGA-EW-A1J5-01 | Breast | breast invasive carcinoma | Female | <65 | I/II | Chemotherapy | adriamycin | SD | |
| NR5A2 | deletion | Frame_Shift_Del | novel | c.1174delT | p.Tyr392ThrfsTer24 | p.Y392Tfs*24 | O00482 | protein_coding | TCGA-D8-A27V-01 | Breast | breast invasive carcinoma | Female | <65 | I/II | Hormone Therapy | tamoxiphen | SD | ||
| NR5A2 | SNV | Missense_Mutation | c.238N>A | p.Glu80Lys | p.E80K | O00482 | protein_coding | tolerated(0.2) | benign(0.104) | TCGA-DR-A0ZM-01 | Cervix | cervical & endocervical cancer | Female | <65 | III/IV | Unspecific | Cisplatin | SD | |
| NR5A2 | SNV | Missense_Mutation | c.238N>A | p.Glu80Lys | p.E80K | O00482 | protein_coding | tolerated(0.2) | benign(0.104) | TCGA-IR-A3LH-01 | Cervix | cervical & endocervical cancer | Female | <65 | I/II | Chemotherapy | cisplatin | CR | |
| NR5A2 | SNV | Missense_Mutation | rs762506535 | c.1315N>T | p.Arg439Cys | p.R439C | O00482 | protein_coding | deleterious(0.01) | probably_damaging(0.986) | TCGA-VS-A9UD-01 | Cervix | cervical & endocervical cancer | Female | >=65 | III/IV | Chemotherapy | cisplatin | CR |
| Page: 1 2 3 4 5 6 7 8 9 |
Top |
Related drugs of malignant transformation related genes |
| Identification of chemicals and drugs interact with genes involved in malignant transfromation |
| (DGIdb 4.0) |
| Entrez ID | Symbol | Category | Interaction Types | Drug Claim Name | Drug Name | PMIDs |
| 2494 | NR5A2 | DRUGGABLE GENOME, NUCLEAR HORMONE RECEPTOR, TRANSCRIPTION FACTOR | TDR79154 | CHEMBL597670 | ||
| 2494 | NR5A2 | DRUGGABLE GENOME, NUCLEAR HORMONE RECEPTOR, TRANSCRIPTION FACTOR | agonist | 385612243 | ||
| 2494 | NR5A2 | DRUGGABLE GENOME, NUCLEAR HORMONE RECEPTOR, TRANSCRIPTION FACTOR | GSK8470 | CHEMBL385911 | 17154495 | |
| 2494 | NR5A2 | DRUGGABLE GENOME, NUCLEAR HORMONE RECEPTOR, TRANSCRIPTION FACTOR | agonist | 385612242 |
| Page: 1 |

Copyright 2023-Present -The University of Texas Health Science Center at Houston |