
|
|||||
|
 | |
| |
| |
| |
| |
| |
|
Gene: NR4A2 |
Gene summary for NR4A2 |
| Gene information | Species | Human | Gene symbol | NR4A2 | Gene ID | 4929 |
| Gene name | nuclear receptor subfamily 4 group A member 2 | |
| Gene Alias | HZF-3 | |
| Cytomap | 2q24.1 | |
| Gene Type | protein-coding | GO ID | GO:0000122 | UniProtAcc | F1D8N6 |
Top |
Malignant transformation analysis |
| Identification of the aberrant gene expression in precancerous and cancerous lesions by comparing the gene expression of stem-like cells in diseased tissues with normal stem cells |
| Entrez ID | Symbol | Replicates | Species | Organ | Tissue | Adj P-value | Log2FC | Malignancy |
| 4929 | NR4A2 | GSM4909282 | Human | Breast | IDC | 2.79e-12 | 6.24e-01 | -0.0288 |
| 4929 | NR4A2 | GSM4909286 | Human | Breast | IDC | 5.57e-04 | 1.19e-01 | 0.1081 |
| 4929 | NR4A2 | GSM4909291 | Human | Breast | IDC | 2.96e-03 | 3.82e-01 | 0.1753 |
| 4929 | NR4A2 | GSM4909294 | Human | Breast | IDC | 2.27e-02 | -2.11e-01 | 0.2022 |
| 4929 | NR4A2 | GSM4909297 | Human | Breast | IDC | 7.30e-03 | -1.60e-01 | 0.1517 |
| 4929 | NR4A2 | GSM4909298 | Human | Breast | IDC | 2.71e-02 | -2.30e-01 | 0.1551 |
| 4929 | NR4A2 | GSM4909304 | Human | Breast | IDC | 2.07e-02 | -2.05e-01 | 0.1636 |
| 4929 | NR4A2 | GSM4909308 | Human | Breast | IDC | 2.11e-34 | 7.85e-01 | 0.158 |
| 4929 | NR4A2 | GSM4909311 | Human | Breast | IDC | 6.16e-11 | -2.79e-01 | 0.1534 |
| 4929 | NR4A2 | GSM4909313 | Human | Breast | IDC | 3.13e-02 | 3.03e-01 | 0.0391 |
| 4929 | NR4A2 | GSM4909319 | Human | Breast | IDC | 1.90e-09 | -2.39e-01 | 0.1563 |
| 4929 | NR4A2 | GSM4909320 | Human | Breast | IDC | 4.54e-03 | -3.17e-01 | 0.1575 |
| 4929 | NR4A2 | GSM4909321 | Human | Breast | IDC | 3.04e-03 | -2.14e-01 | 0.1559 |
| 4929 | NR4A2 | brca1 | Human | Breast | Precancer | 4.83e-06 | -2.88e-01 | -0.0338 |
| 4929 | NR4A2 | brca2 | Human | Breast | Precancer | 1.56e-05 | -2.67e-01 | -0.024 |
| 4929 | NR4A2 | brca3 | Human | Breast | Precancer | 1.10e-04 | -2.82e-01 | -0.0263 |
| 4929 | NR4A2 | brca10 | Human | Breast | Precancer | 1.20e-05 | -2.88e-01 | -0.0029 |
| 4929 | NR4A2 | NCCBC14 | Human | Breast | DCIS | 1.73e-06 | -2.86e-01 | 0.2021 |
| 4929 | NR4A2 | NCCBC3 | Human | Breast | DCIS | 1.44e-04 | -2.62e-01 | 0.1198 |
| 4929 | NR4A2 | NCCBC5 | Human | Breast | DCIS | 2.45e-04 | -1.96e-01 | 0.2046 |
| Page: 1 2 3 4 5 6 7 8 |
| Tissue | Expression Dynamics | Abbreviation |
| Breast | 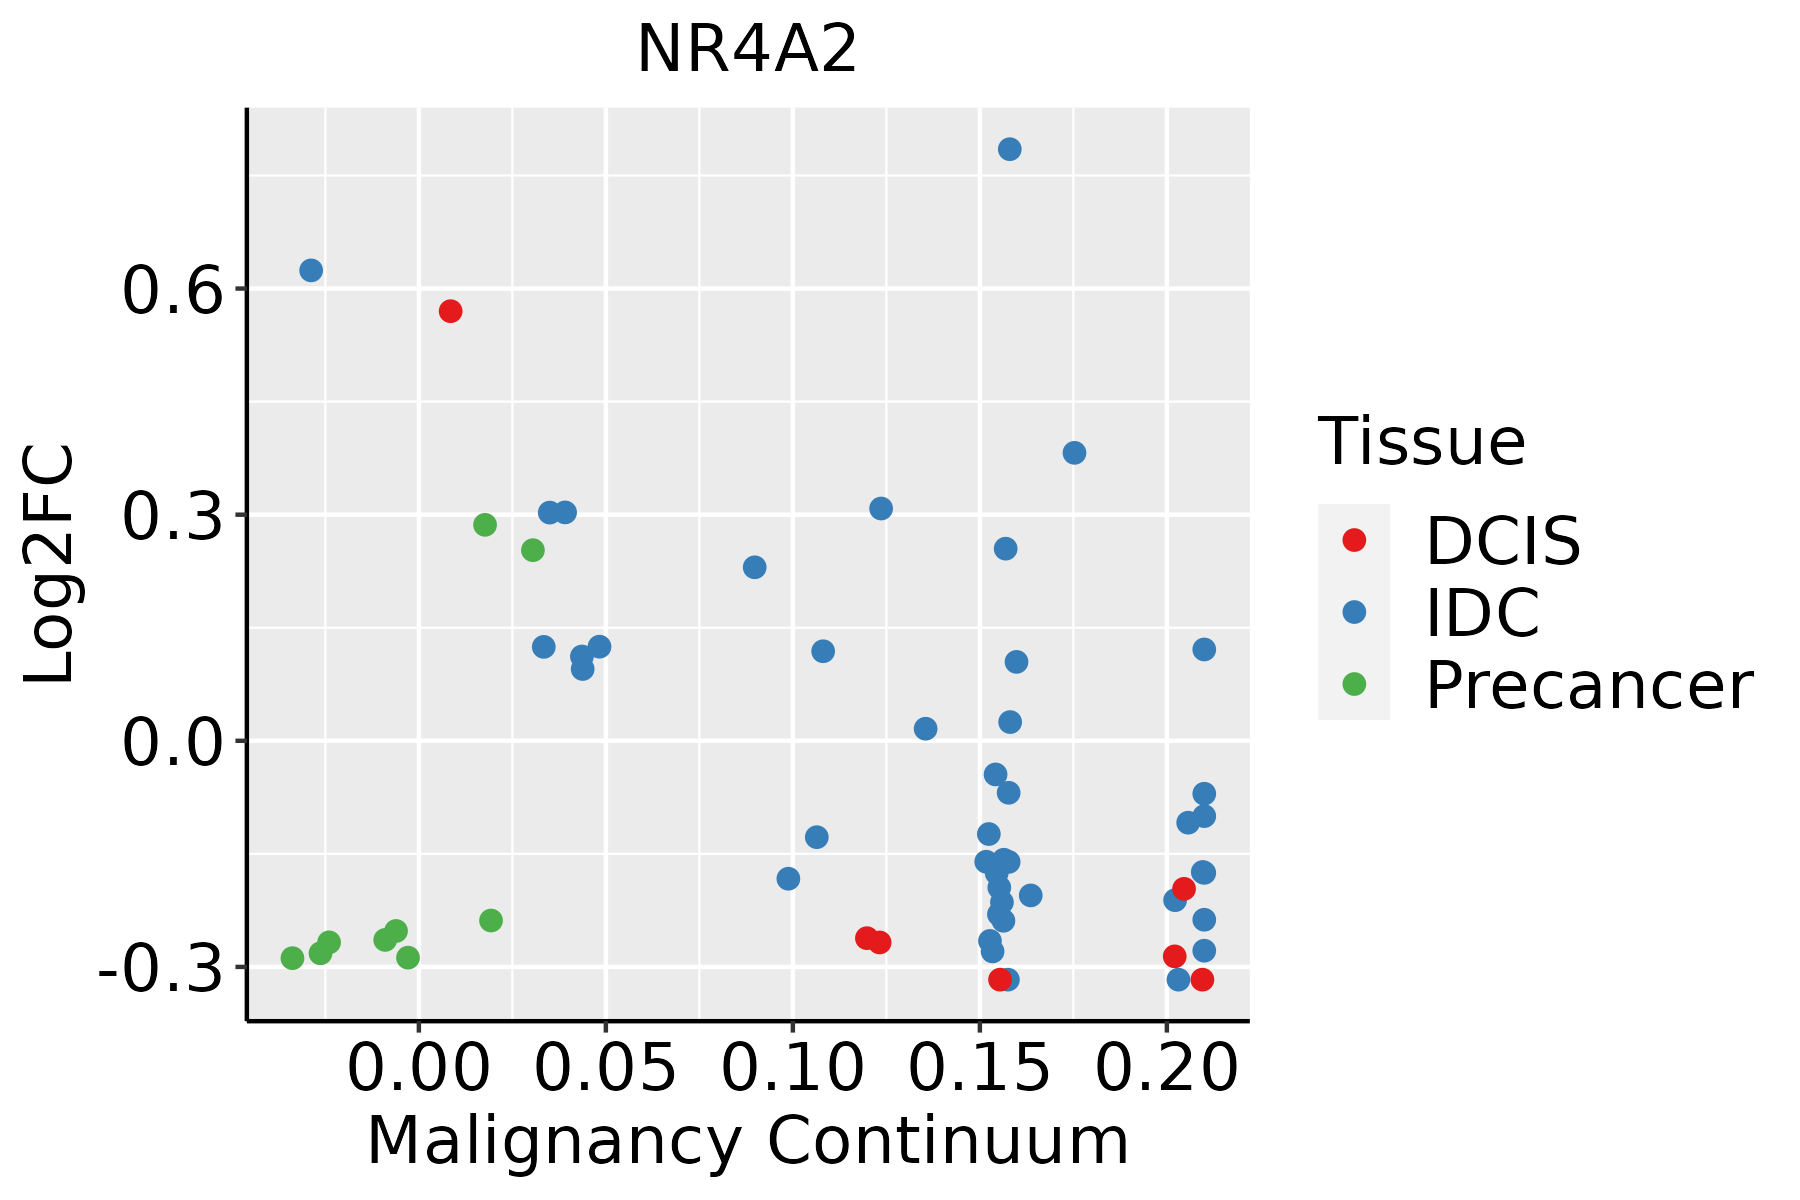 | IDC: Invasive ductal carcinoma |
| DCIS: Ductal carcinoma in situ | ||
| Precancer(BRCA1-mut): Precancerous lesion from BRCA1 mutation carriers | ||
| Cervix |  | CC: Cervix cancer |
| HSIL_HPV: HPV-infected high-grade squamous intraepithelial lesions | ||
| N_HPV: HPV-infected normal cervix | ||
| Esophagus | 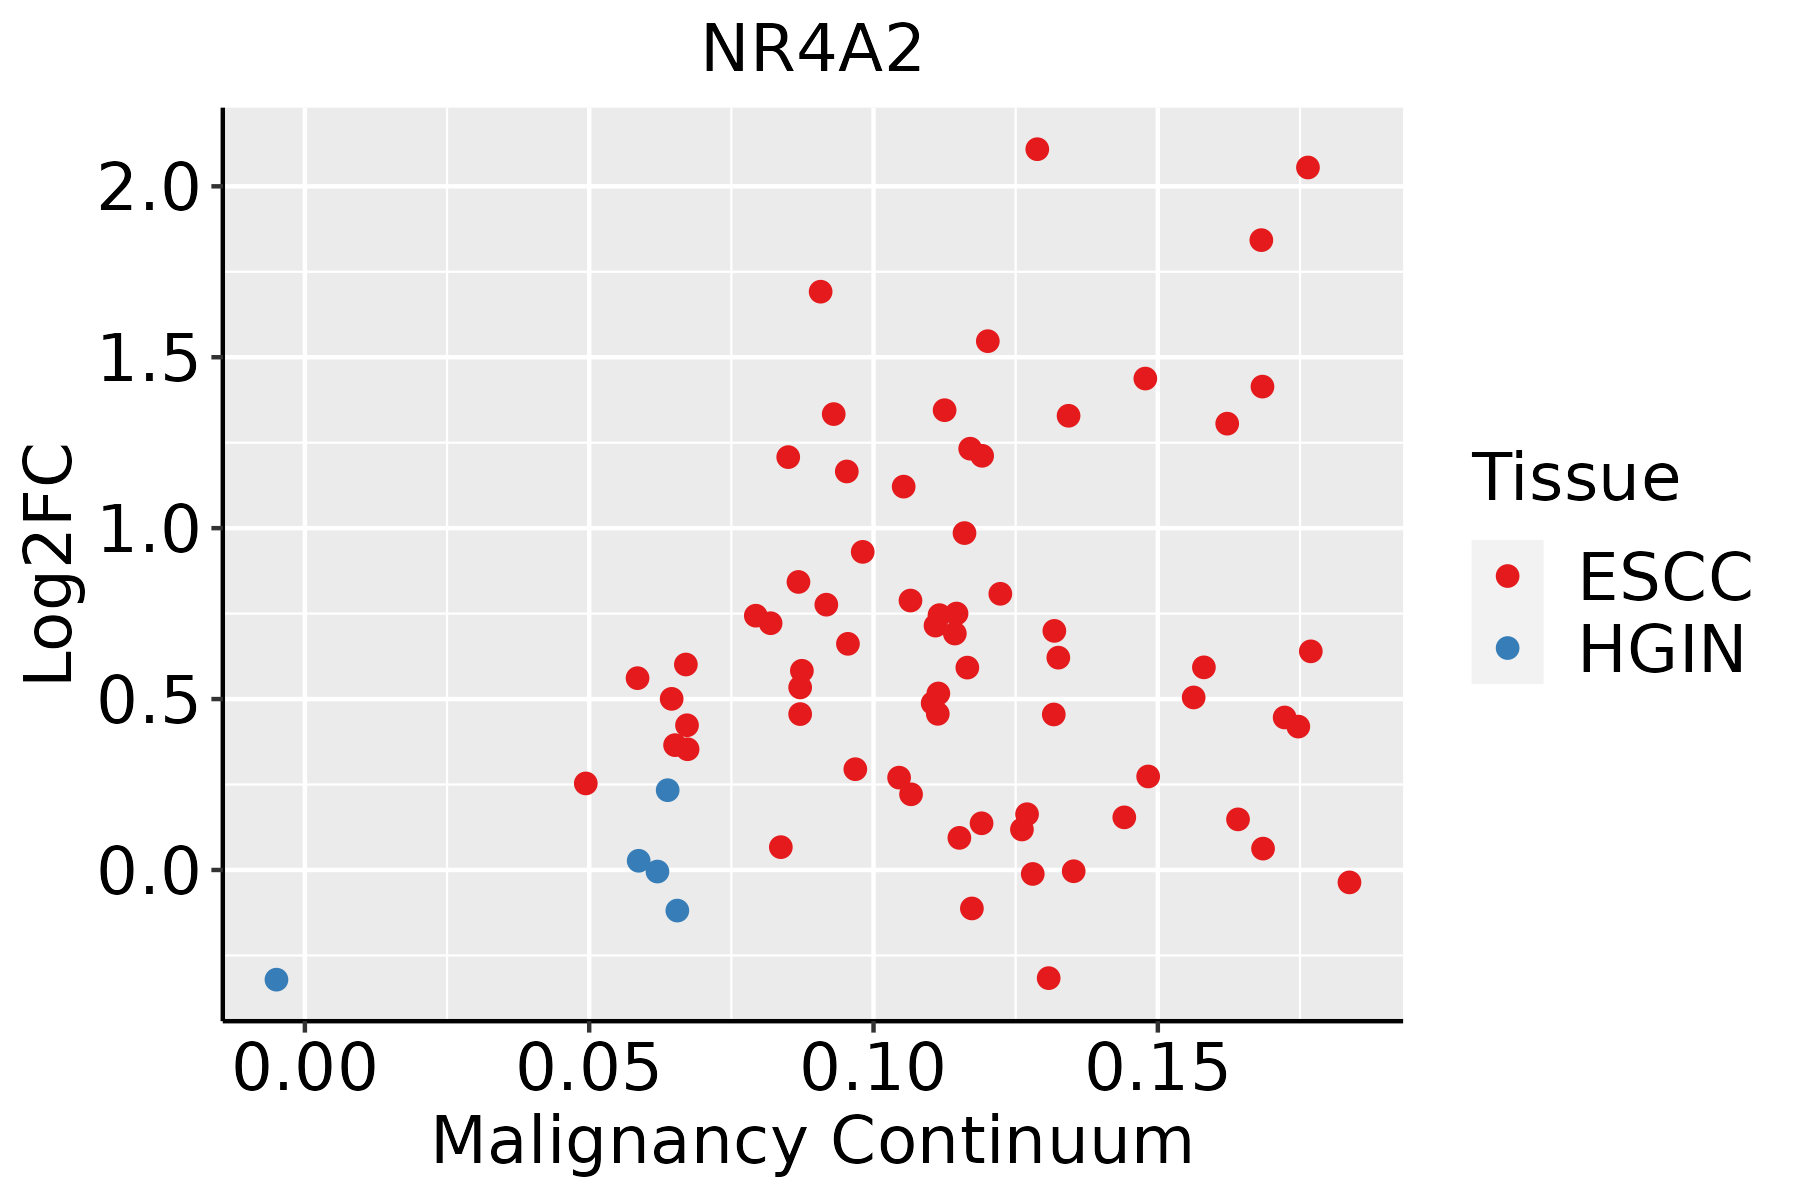 | ESCC: Esophageal squamous cell carcinoma |
| HGIN: High-grade intraepithelial neoplasias | ||
| LGIN: Low-grade intraepithelial neoplasias | ||
| Liver | 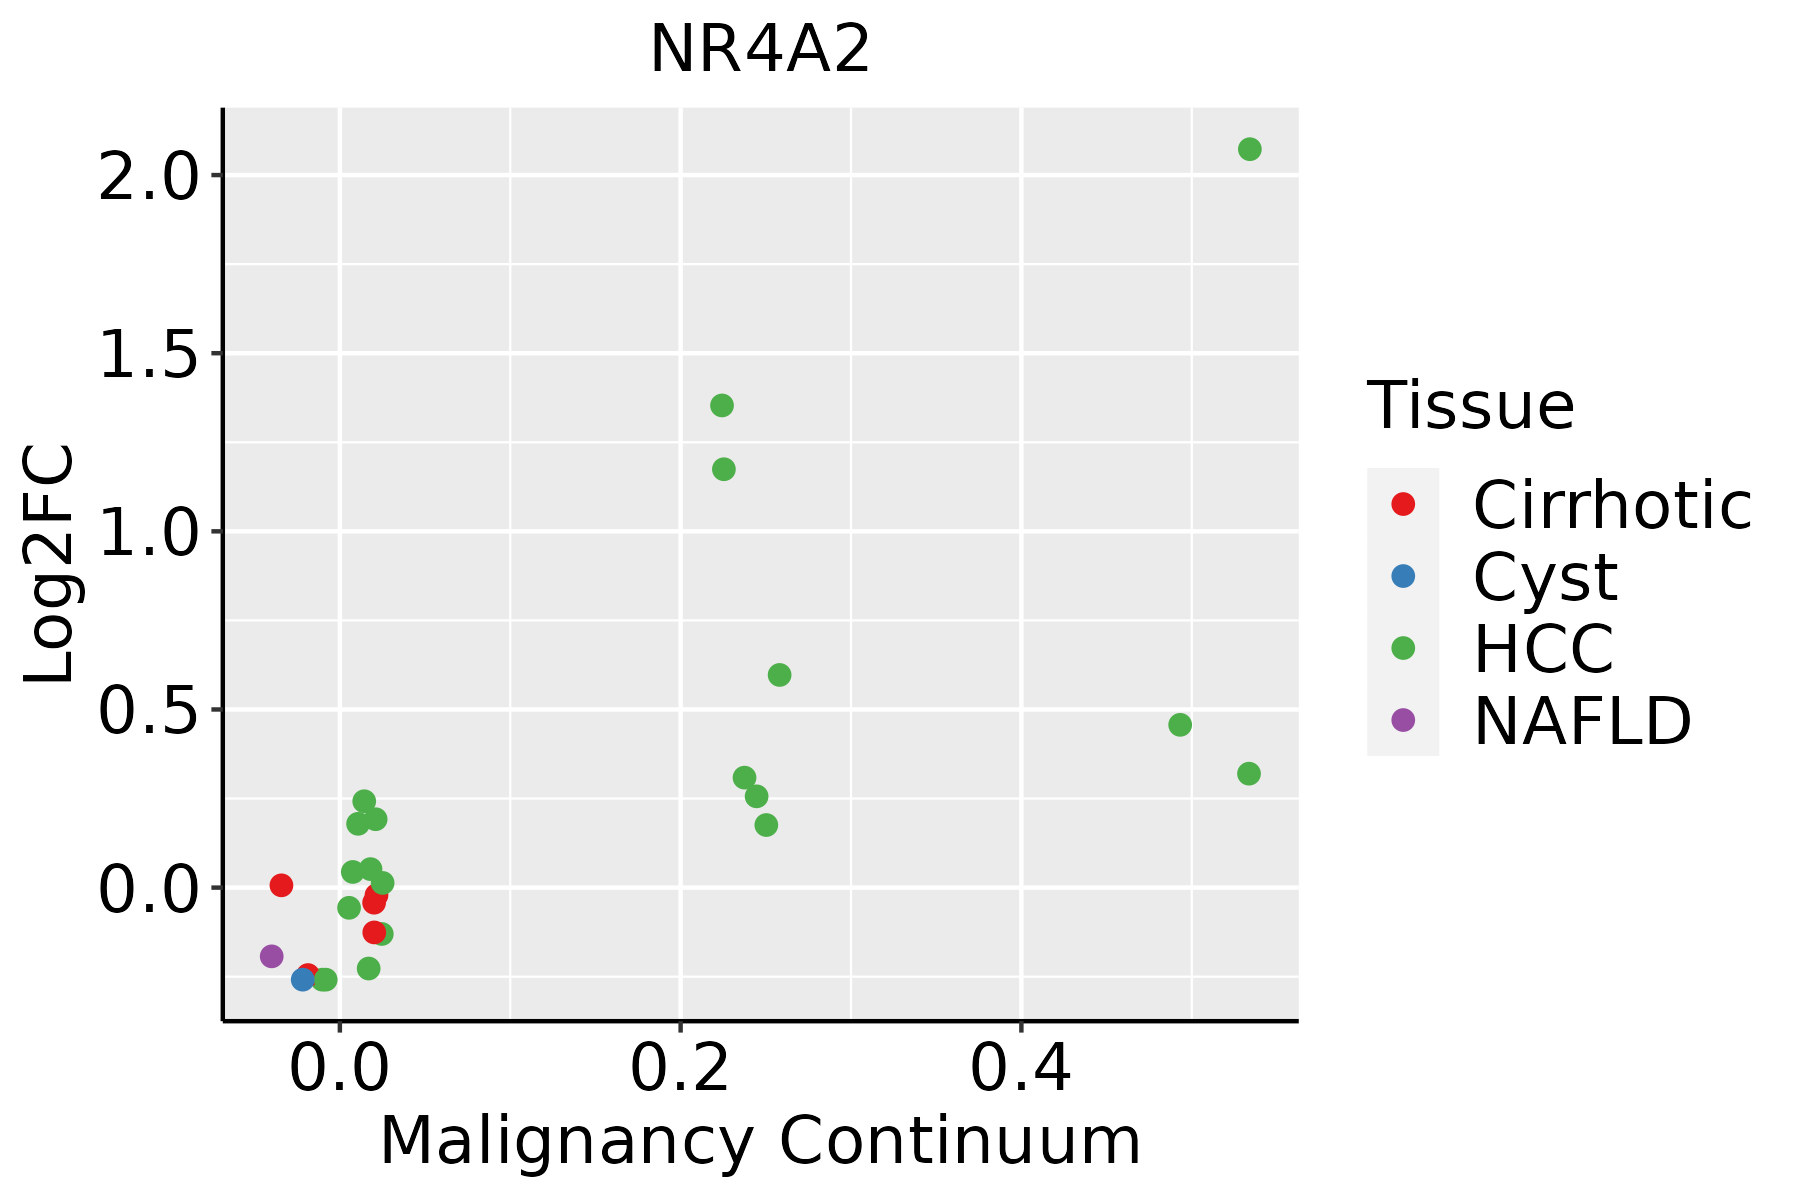 | HCC: Hepatocellular carcinoma |
| NAFLD: Non-alcoholic fatty liver disease | ||
| Lung | 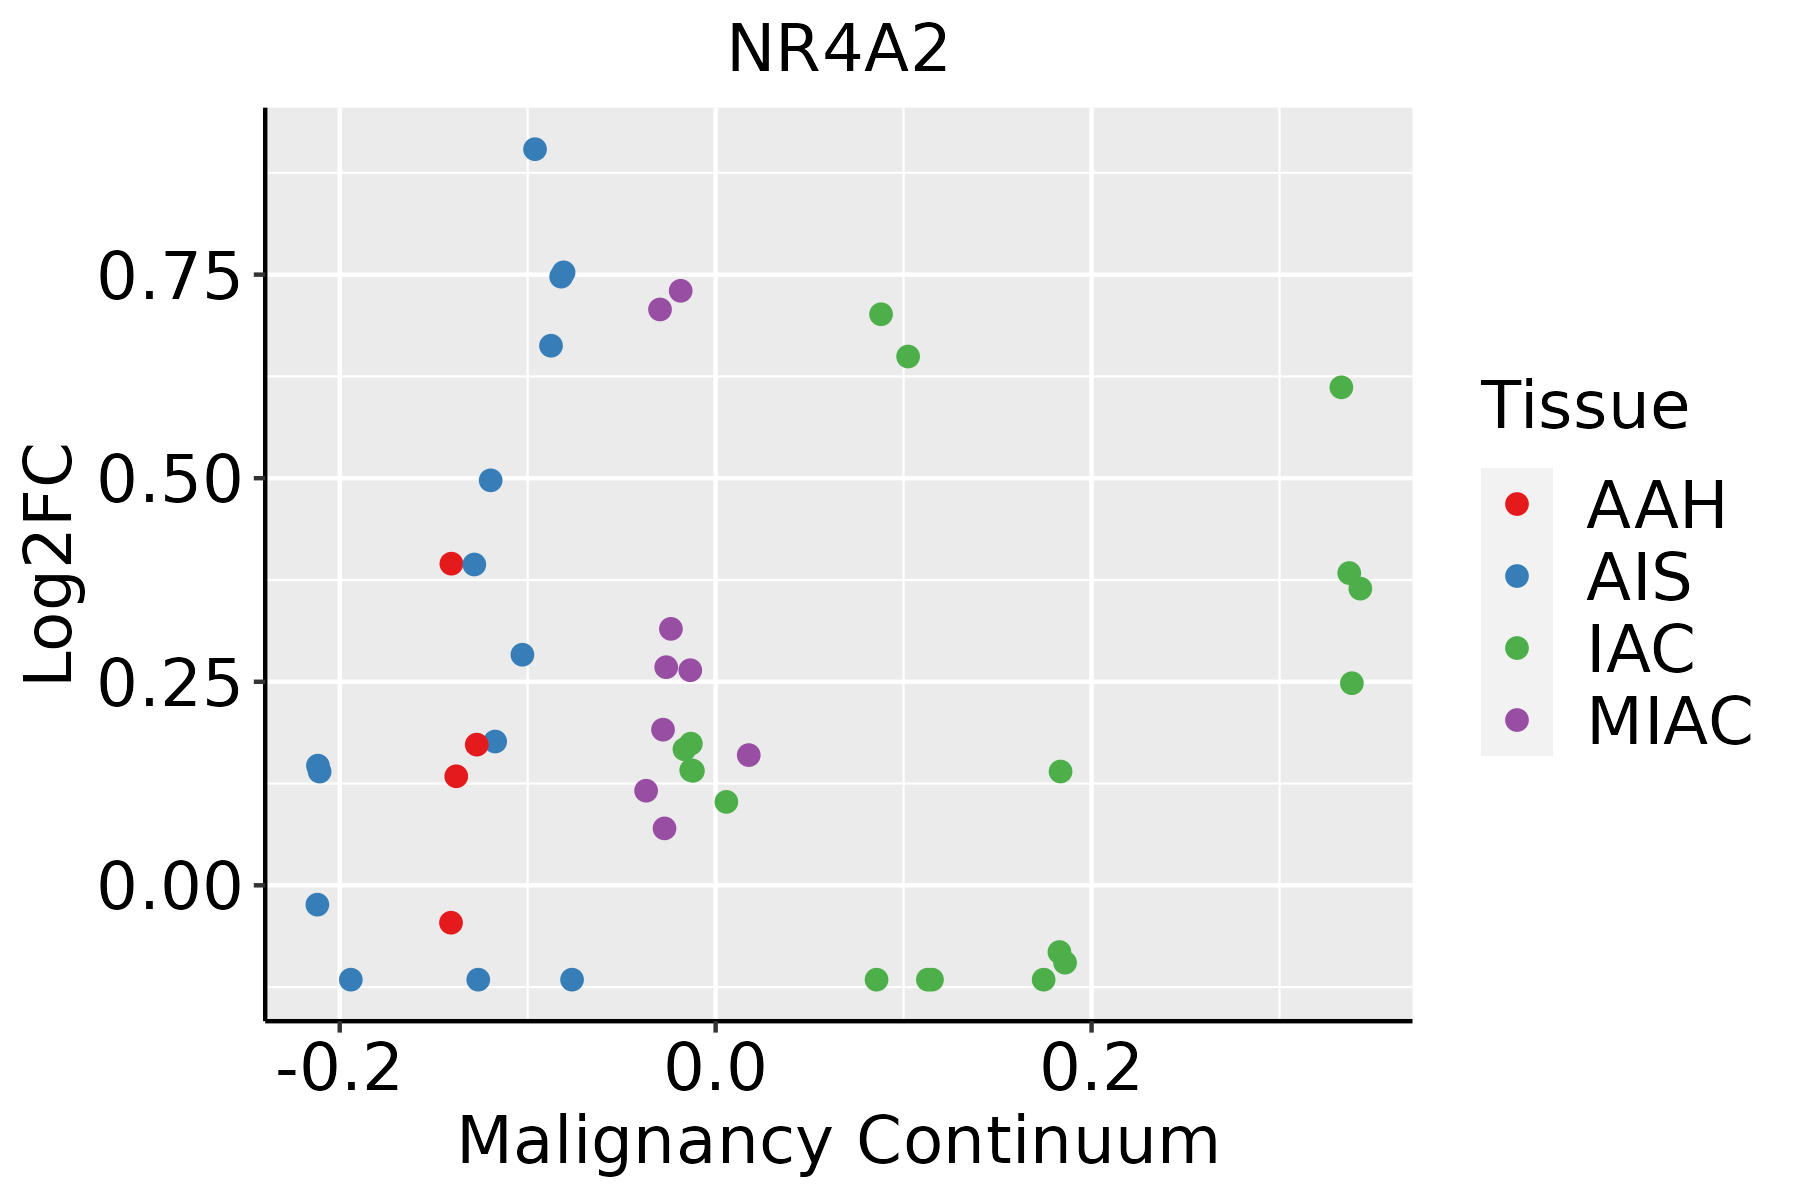 | AAH: Atypical adenomatous hyperplasia |
| AIS: Adenocarcinoma in situ | ||
| IAC: Invasive lung adenocarcinoma | ||
| MIA: Minimally invasive adenocarcinoma | ||
| Oral Cavity | 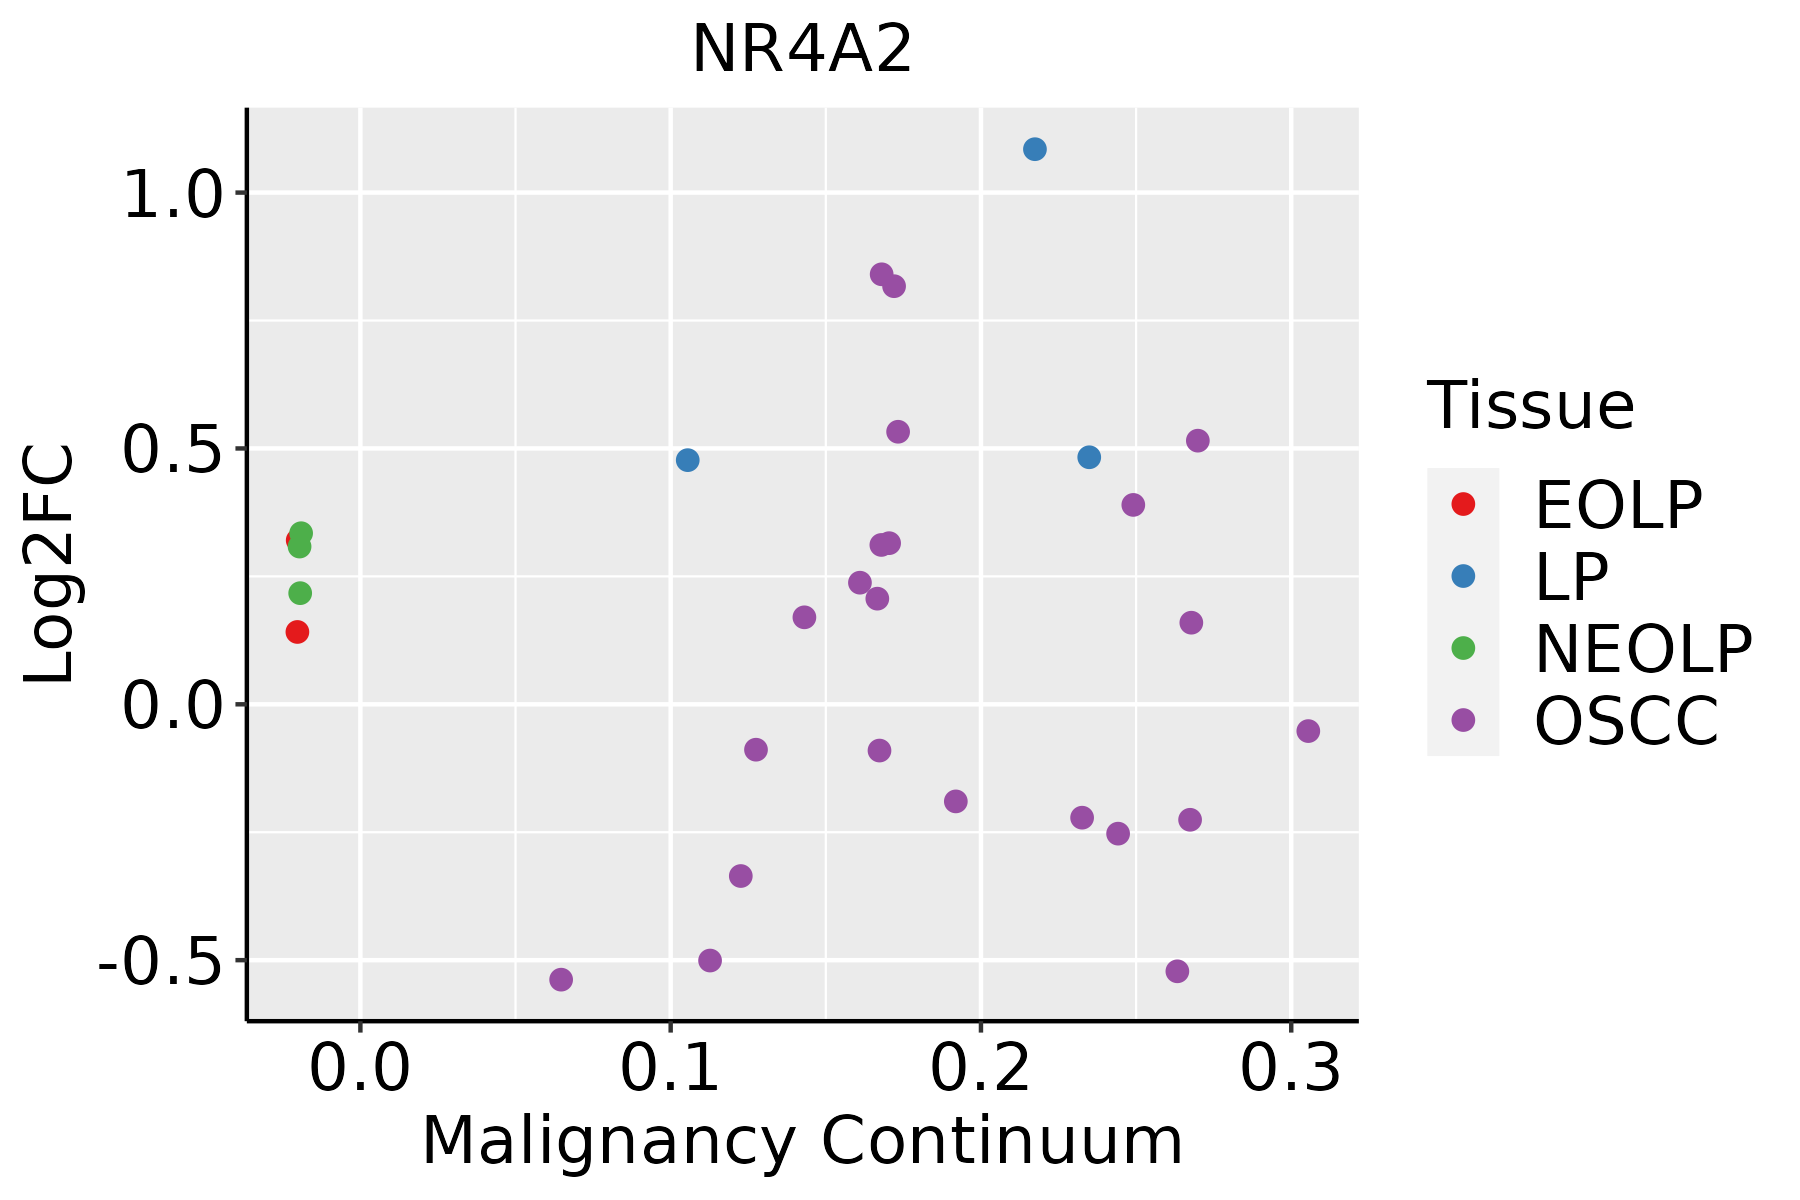 | EOLP: Erosive Oral lichen planus |
| LP: leukoplakia | ||
| NEOLP: Non-erosive oral lichen planus | ||
| OSCC: Oral squamous cell carcinoma | ||
| Prostate | 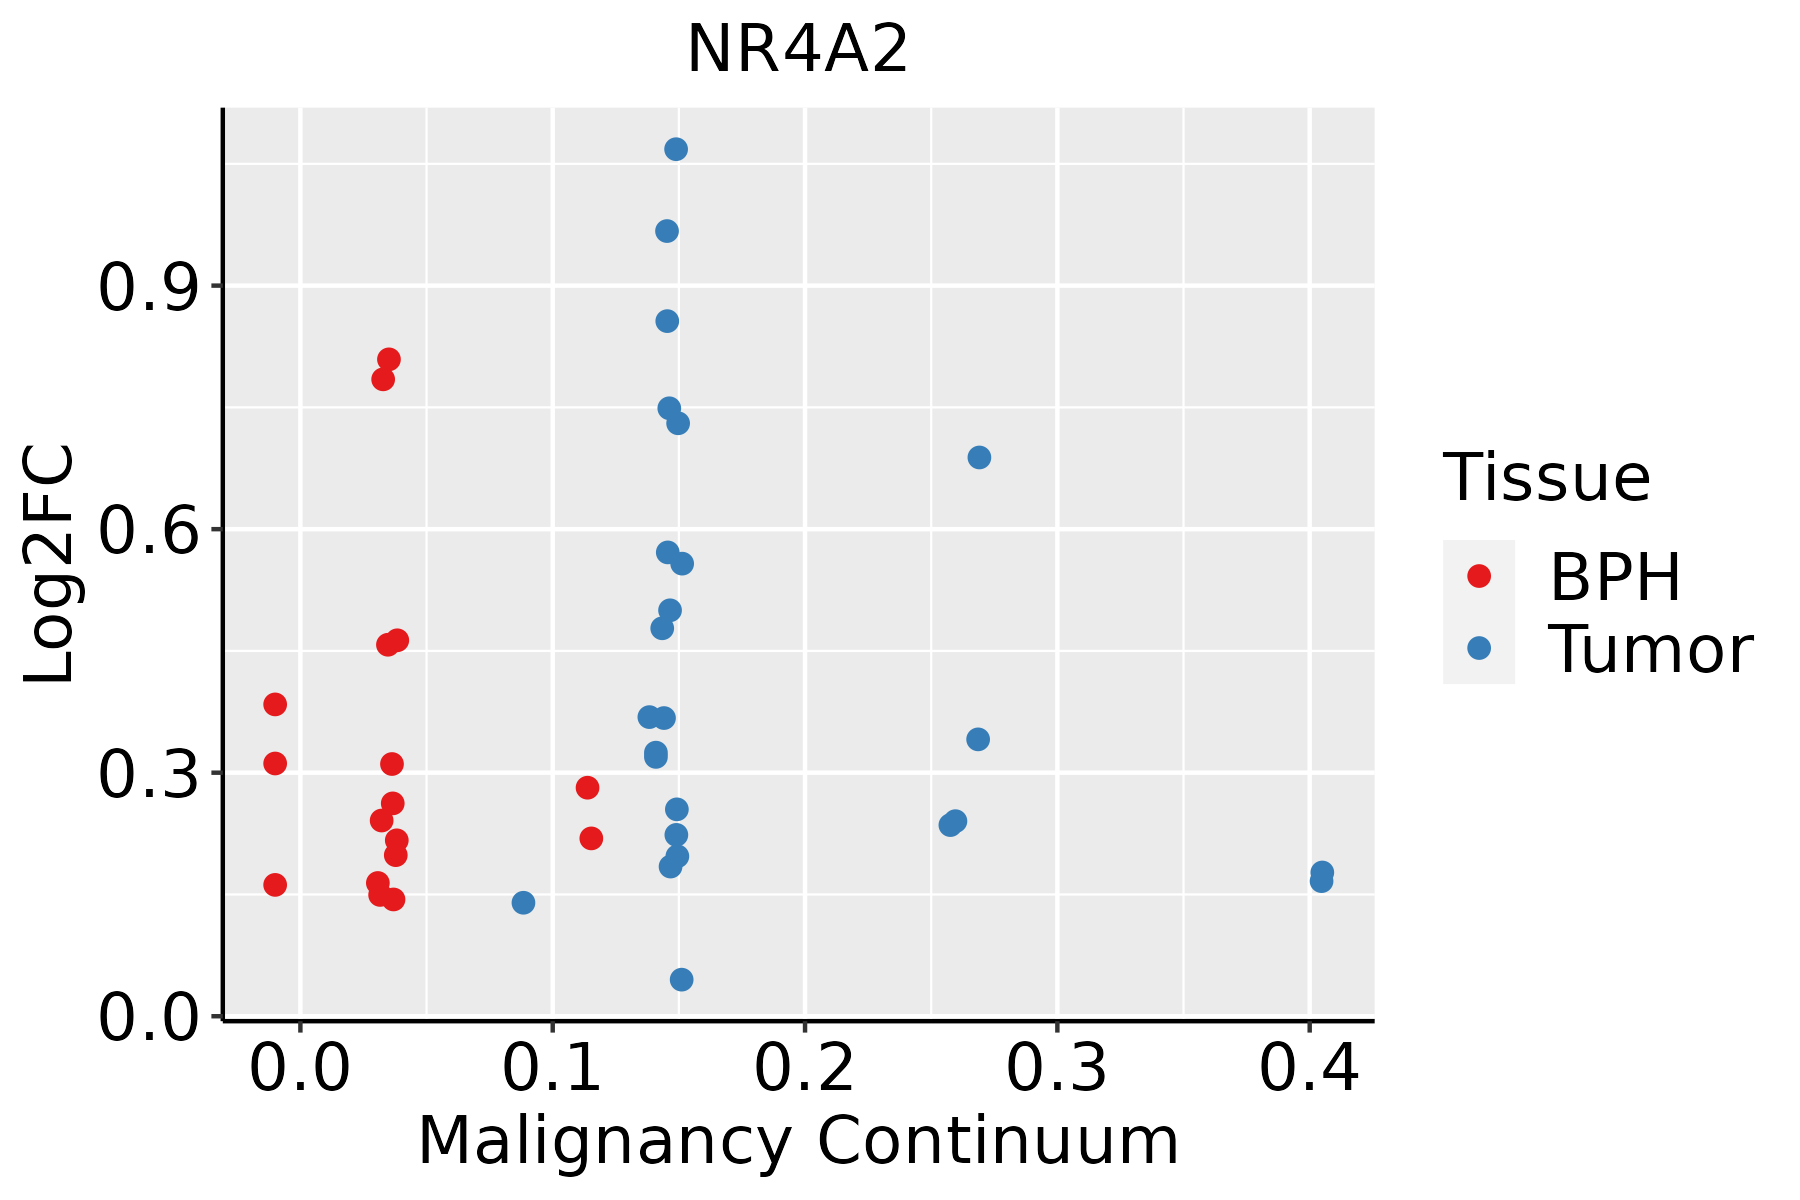 | BPH: Benign Prostatic Hyperplasia |
| Skin | 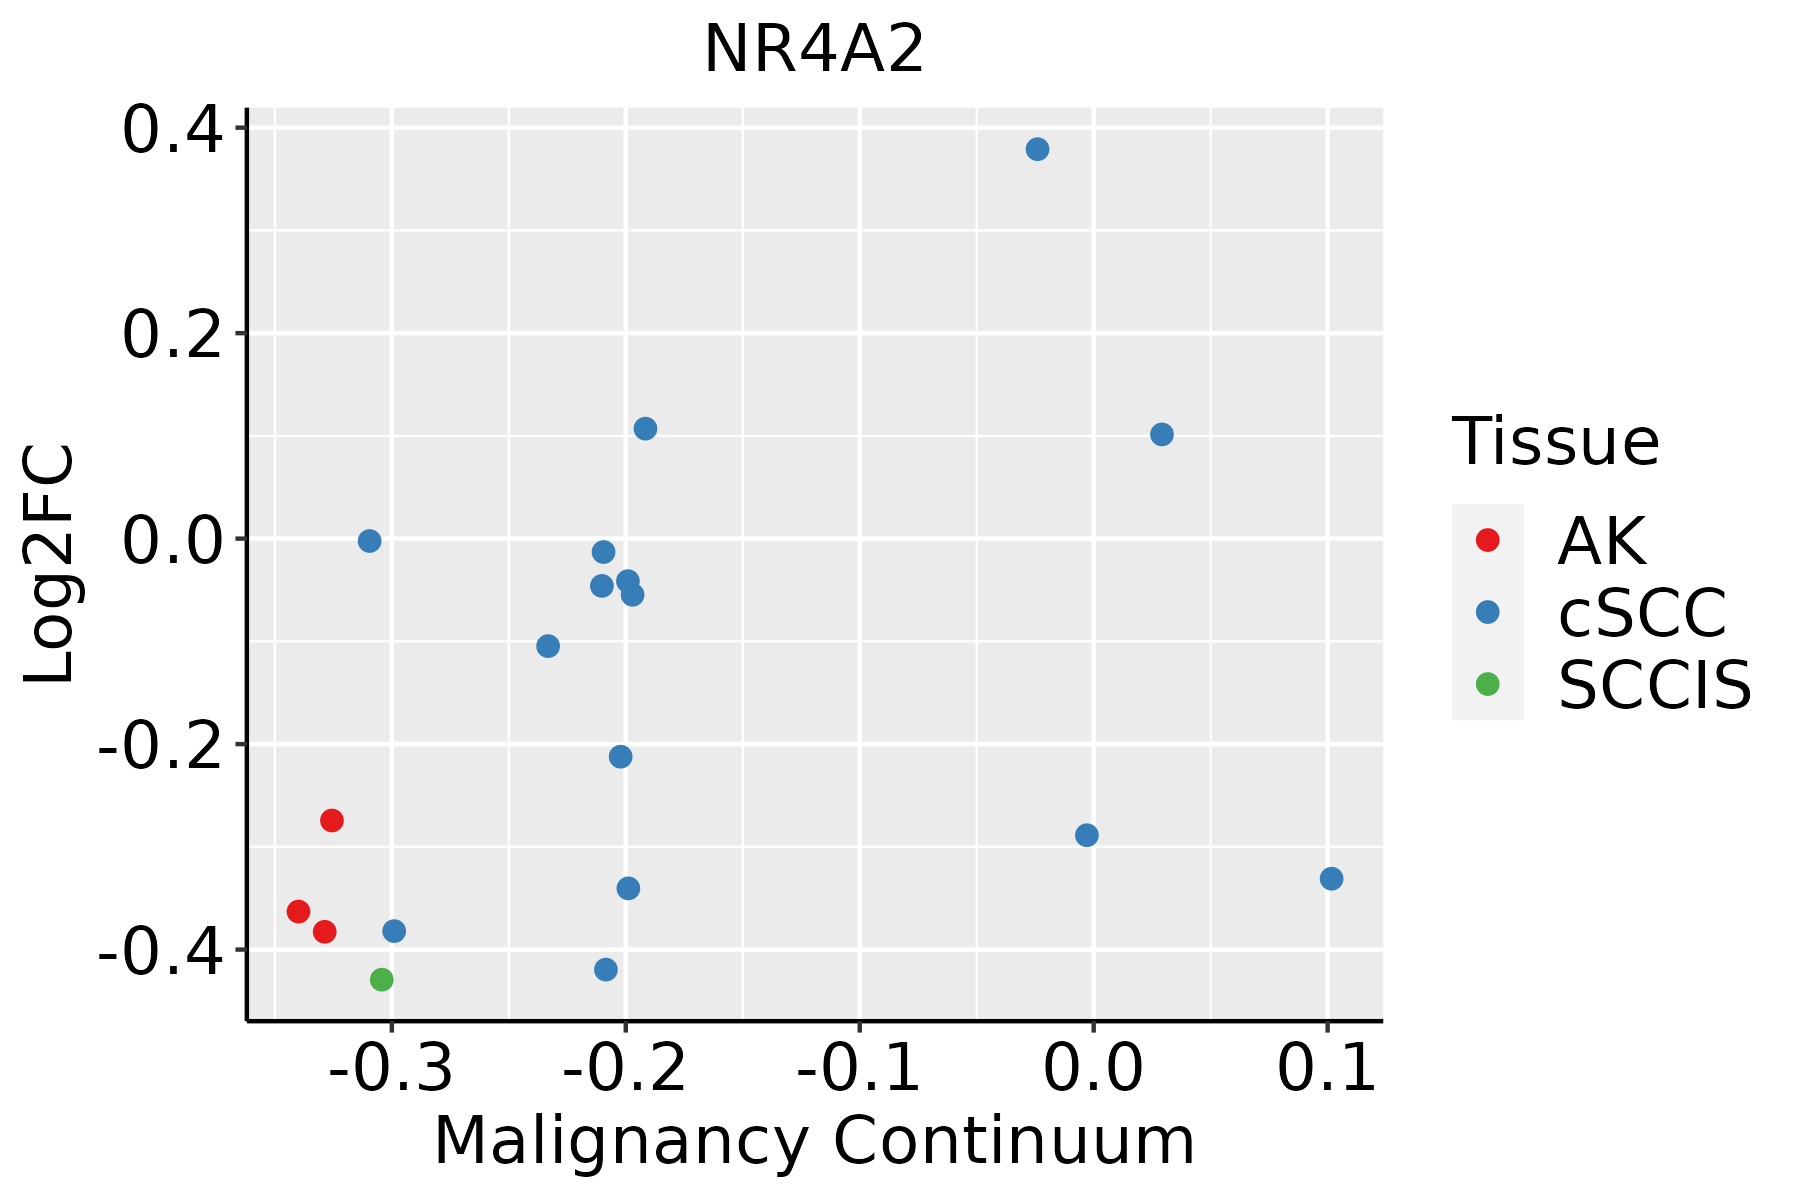 | AK: Actinic keratosis |
| cSCC: Cutaneous squamous cell carcinoma | ||
| SCCIS:squamous cell carcinoma in situ | ||
| Thyroid | 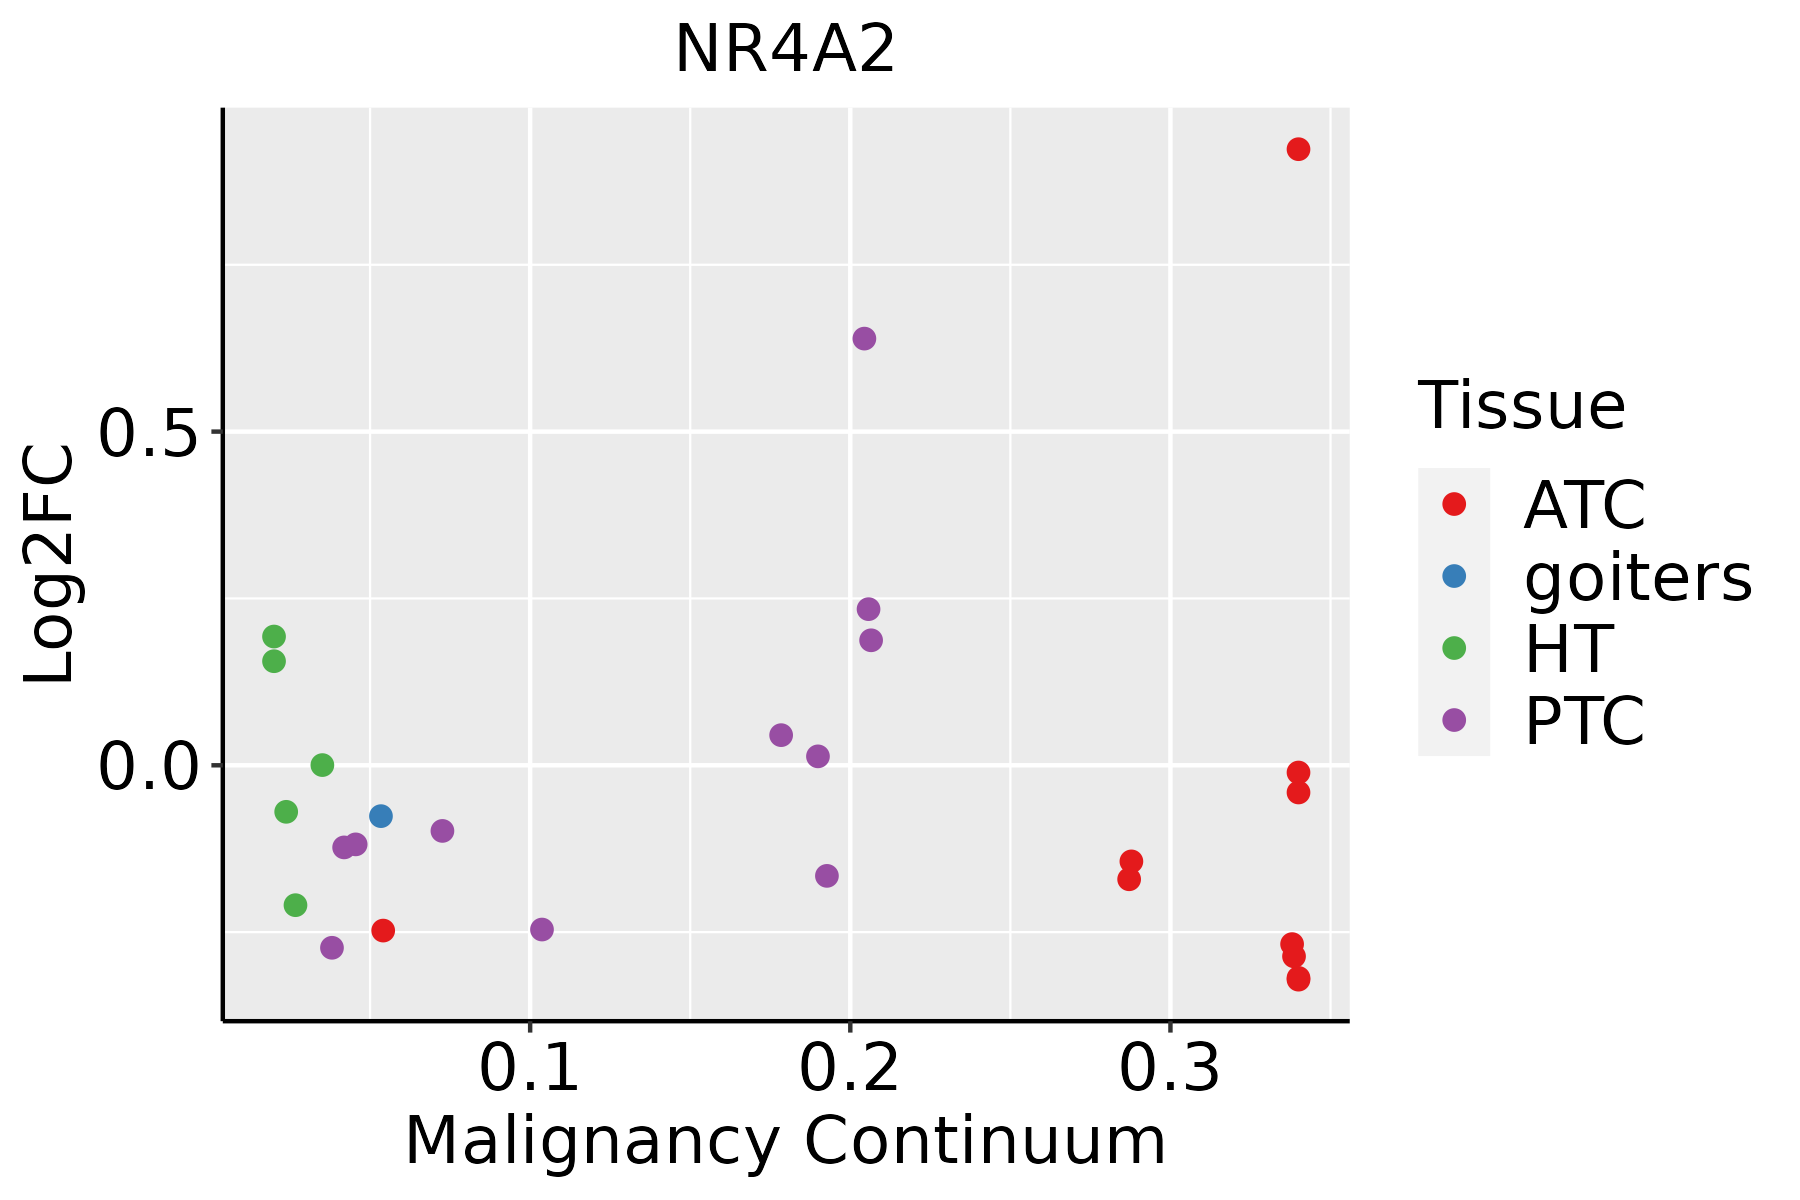 | ATC: Anaplastic thyroid cancer |
| HT: Hashimoto's thyroiditis | ||
| PTC: Papillary thyroid cancer |
| ∗log2FC in expression of this searched gene in stem-like cells from each diseased tissue sample relative to stem-like cells in normal samples in each tissue plotted against the malignancy continuum. Samples are colored based on if they are from different disease stage. |
Top |
Malignant transformation related pathway analysis |
| Find out the enriched GO biological processes and KEGG pathways involved in transition from healthy to precancer to cancer |
| Tissue | Disease Stage | Enriched GO biological Processes |
| Colorectum | AD |  |
| Colorectum | SER |  |
| Colorectum | MSS |  |
| Colorectum | MSI-H |  |
| Colorectum | FAP |  |
| ∗Top 15 enriched GO BP terms are showed in the bar plot of each disease state in each tissue. Each row represents a significant GO biological process which is colored according to the -log10(p.adjust). |
| Page: 1 2 3 4 5 6 7 8 9 |
| GO ID | Tissue | Disease Stage | Description | Gene Ratio | Bg Ratio | pvalue | p.adjust | Count |
| GO:20012339 | Breast | Precancer | regulation of apoptotic signaling pathway | 65/1080 | 356/18723 | 7.70e-17 | 3.17e-14 | 65 |
| GO:00069799 | Breast | Precancer | response to oxidative stress | 70/1080 | 446/18723 | 1.59e-14 | 4.26e-12 | 70 |
| GO:00362939 | Breast | Precancer | response to decreased oxygen levels | 53/1080 | 322/18723 | 4.09e-12 | 6.84e-10 | 53 |
| GO:00016669 | Breast | Precancer | response to hypoxia | 51/1080 | 307/18723 | 7.33e-12 | 1.11e-09 | 51 |
| GO:00704829 | Breast | Precancer | response to oxygen levels | 55/1080 | 347/18723 | 7.47e-12 | 1.11e-09 | 55 |
| GO:00621979 | Breast | Precancer | cellular response to chemical stress | 51/1080 | 337/18723 | 2.40e-10 | 2.34e-08 | 51 |
| GO:20012349 | Breast | Precancer | negative regulation of apoptotic signaling pathway | 39/1080 | 224/18723 | 5.35e-10 | 4.77e-08 | 39 |
| GO:00709979 | Breast | Precancer | neuron death | 50/1080 | 361/18723 | 7.75e-09 | 5.70e-07 | 50 |
| GO:00514029 | Breast | Precancer | neuron apoptotic process | 38/1080 | 246/18723 | 2.68e-08 | 1.75e-06 | 38 |
| GO:00345999 | Breast | Precancer | cellular response to oxidative stress | 42/1080 | 288/18723 | 2.78e-08 | 1.79e-06 | 42 |
| GO:00309018 | Breast | Precancer | midbrain development | 20/1080 | 90/18723 | 1.50e-07 | 7.93e-06 | 20 |
| GO:19012149 | Breast | Precancer | regulation of neuron death | 41/1080 | 319/18723 | 1.27e-06 | 4.80e-05 | 41 |
| GO:00435237 | Breast | Precancer | regulation of neuron apoptotic process | 31/1080 | 212/18723 | 1.69e-06 | 6.08e-05 | 31 |
| GO:00435243 | Breast | Precancer | negative regulation of neuron apoptotic process | 19/1080 | 145/18723 | 6.83e-04 | 8.34e-03 | 19 |
| GO:00454444 | Breast | Precancer | fat cell differentiation | 26/1080 | 229/18723 | 7.60e-04 | 9.04e-03 | 26 |
| GO:00714969 | Breast | Precancer | cellular response to external stimulus | 33/1080 | 320/18723 | 9.01e-04 | 1.03e-02 | 33 |
| GO:19012157 | Breast | Precancer | negative regulation of neuron death | 24/1080 | 208/18723 | 9.50e-04 | 1.07e-02 | 24 |
| GO:00316688 | Breast | Precancer | cellular response to extracellular stimulus | 27/1080 | 246/18723 | 1.02e-03 | 1.13e-02 | 27 |
| GO:00140753 | Breast | Precancer | response to amine | 9/1080 | 49/18723 | 1.74e-03 | 1.74e-02 | 9 |
| GO:0001975 | Breast | Precancer | response to amphetamine | 7/1080 | 33/18723 | 2.37e-03 | 2.19e-02 | 7 |
| Page: 1 2 3 4 5 6 7 8 9 10 11 12 13 14 15 16 17 18 19 20 21 22 23 24 25 26 27 28 29 |
| Pathway ID | Tissue | Disease Stage | Description | Gene Ratio | Bg Ratio | pvalue | p.adjust | qvalue | Count |
| hsa0492812 | Cervix | CC | Parathyroid hormone synthesis, secretion and action | 27/1267 | 106/8465 | 3.12e-03 | 1.19e-02 | 7.03e-03 | 27 |
| hsa0492813 | Cervix | CC | Parathyroid hormone synthesis, secretion and action | 27/1267 | 106/8465 | 3.12e-03 | 1.19e-02 | 7.03e-03 | 27 |
| hsa0492816 | Esophagus | ESCC | Parathyroid hormone synthesis, secretion and action | 66/4205 | 106/8465 | 5.86e-03 | 1.47e-02 | 7.51e-03 | 66 |
| hsa0492817 | Esophagus | ESCC | Parathyroid hormone synthesis, secretion and action | 66/4205 | 106/8465 | 5.86e-03 | 1.47e-02 | 7.51e-03 | 66 |
| hsa0492810 | Lung | IAC | Parathyroid hormone synthesis, secretion and action | 26/1053 | 106/8465 | 4.34e-04 | 4.03e-03 | 2.68e-03 | 26 |
| hsa0492811 | Lung | IAC | Parathyroid hormone synthesis, secretion and action | 26/1053 | 106/8465 | 4.34e-04 | 4.03e-03 | 2.68e-03 | 26 |
| hsa0492814 | Prostate | BPH | Parathyroid hormone synthesis, secretion and action | 33/1718 | 106/8465 | 5.30e-03 | 1.75e-02 | 1.08e-02 | 33 |
| hsa0492815 | Prostate | BPH | Parathyroid hormone synthesis, secretion and action | 33/1718 | 106/8465 | 5.30e-03 | 1.75e-02 | 1.08e-02 | 33 |
| hsa0492822 | Prostate | Tumor | Parathyroid hormone synthesis, secretion and action | 35/1791 | 106/8465 | 2.89e-03 | 1.07e-02 | 6.67e-03 | 35 |
| hsa0492832 | Prostate | Tumor | Parathyroid hormone synthesis, secretion and action | 35/1791 | 106/8465 | 2.89e-03 | 1.07e-02 | 6.67e-03 | 35 |
| Page: 1 |
Top |
Cell-cell communication analysis |
| Identification of potential cell-cell interactions between two cell types and their ligand-receptor pairs for different disease states |
| Ligand | Receptor | LRpair | Pathway | Tissue | Disease Stage |
| Page: 1 |
Top |
Single-cell gene regulatory network inference analysis |
| Find out the significant the regulons (TFs) and the target genes of each regulon across cell types for different disease states |
| TF | Cell Type | Tissue | Disease Stage | Target Gene | RSS | Regulon Activity |
| NR4A2 | GOB | Esophagus | Healthy | CXCL3,LURAP1L,CXCL1, etc. | 1.28e-01 |  |
| NR4A2 | NUER | Prostate | Healthy | SLC38A2,HMOX1,CCN3, etc. | 5.12e-02 |  |
| NR4A2 | URO | Prostate | Healthy | SLC38A2,HMOX1,CCN3, etc. | 9.14e-02 | |
| NR4A2 | MSC | Stomach | ADJ | NR4A3,ZNF331,REL, etc. | 8.47e-02 |  |
| NR4A2 | END | Stomach | CAG with IM | NR4A3,ZNF331,REL, etc. | 2.77e-01 |  |
| NR4A2 | ICAF | Stomach | CSG | NR4A3,ZNF331,REL, etc. | 1.02e-01 |  |
| NR4A2 | MSC | Stomach | GC | NR4A3,ZNF331,REL, etc. | 7.94e-02 |  |
| NR4A2 | TFC | Thyroid | ATC | ZNF331,NR4A1,NR4A3, etc. | 7.06e-02 |  |
| ∗The dot plots of a searched regulon are shown for all cell subpopulations in each disease state of each tissue based on the regulon specific score inferred using pySCENIC and by calculating the average expression. |
| Page: 1 |
Top |
Somatic mutation of malignant transformation related genes |
| Annotation of somatic variants for genes involved in malignant transformation |
| Hugo Symbol | Variant Class | Variant Classification | dbSNP RS | HGVSc | HGVSp | HGVSp Short | SWISSPROT | BIOTYPE | SIFT | PolyPhen | Tumor Sample Barcode | Tissue | Histology | Sex | Age | Stage | Therapy Types | Drugs | Outcome |
| NR4A2 | SNV | Missense_Mutation | c.1028G>T | p.Gly343Val | p.G343V | P43354 | protein_coding | deleterious(0) | probably_damaging(0.999) | TCGA-A2-A0EQ-01 | Breast | breast invasive carcinoma | Female | <65 | I/II | Chemotherapy | adriamycin | SD | |
| NR4A2 | SNV | Missense_Mutation | novel | c.872N>C | p.Val291Ala | p.V291A | P43354 | protein_coding | deleterious(0) | probably_damaging(0.999) | TCGA-D8-A1XK-01 | Breast | breast invasive carcinoma | Female | <65 | I/II | Chemotherapy | doxorubicine+cyclophosphamide | SD |
| NR4A2 | deletion | Frame_Shift_Del | c.430delG | p.Asp144ThrfsTer19 | p.D144Tfs*19 | P43354 | protein_coding | TCGA-E2-A1IF-01 | Breast | breast invasive carcinoma | Female | >=65 | I/II | Hormone Therapy | arimidex | SD | |||
| NR4A2 | SNV | Missense_Mutation | c.833G>T | p.Arg278Leu | p.R278L | P43354 | protein_coding | deleterious(0.01) | probably_damaging(0.92) | TCGA-2W-A8YY-01 | Cervix | cervical & endocervical cancer | Female | <65 | I/II | Chemotherapy | cisplatin | CR | |
| NR4A2 | SNV | Missense_Mutation | c.52G>A | p.Ala18Thr | p.A18T | P43354 | protein_coding | deleterious(0.03) | possibly_damaging(0.656) | TCGA-2W-A8YY-01 | Cervix | cervical & endocervical cancer | Female | <65 | I/II | Chemotherapy | cisplatin | CR | |
| NR4A2 | SNV | Missense_Mutation | c.16N>A | p.Ala6Thr | p.A6T | P43354 | protein_coding | tolerated(0.33) | benign(0.339) | TCGA-AA-3713-01 | Colorectum | colon adenocarcinoma | Male | >=65 | III/IV | Chemotherapy | 5-fluorouracil | PR | |
| NR4A2 | SNV | Missense_Mutation | c.866N>A | p.Arg289His | p.R289H | P43354 | protein_coding | deleterious(0) | probably_damaging(0.999) | TCGA-AA-3821-01 | Colorectum | colon adenocarcinoma | Female | >=65 | I/II | Unknown | Unknown | SD | |
| NR4A2 | SNV | Missense_Mutation | novel | c.503C>T | p.Thr168Met | p.T168M | P43354 | protein_coding | deleterious(0.03) | benign(0.11) | TCGA-AA-3845-01 | Colorectum | colon adenocarcinoma | Female | >=65 | I/II | Unknown | Unknown | PD |
| NR4A2 | SNV | Missense_Mutation | novel | c.1145N>G | p.Leu382Arg | p.L382R | P43354 | protein_coding | deleterious(0.01) | benign(0.436) | TCGA-AD-6889-01 | Colorectum | colon adenocarcinoma | Male | >=65 | I/II | Chemotherapy | xeloda | PD |
| NR4A2 | SNV | Missense_Mutation | novel | c.214N>A | p.Asp72Asn | p.D72N | P43354 | protein_coding | tolerated(0.07) | probably_damaging(0.932) | TCGA-AZ-4315-01 | Colorectum | colon adenocarcinoma | Male | <65 | I/II | Unknown | Unknown | SD |
| Page: 1 2 3 4 5 6 7 8 9 10 11 12 13 |
Top |
Related drugs of malignant transformation related genes |
| Identification of chemicals and drugs interact with genes involved in malignant transfromation |
| (DGIdb 4.0) |
| Entrez ID | Symbol | Category | Interaction Types | Drug Claim Name | Drug Name | PMIDs |
| Page: 1 |

Copyright 2023-Present -The University of Texas Health Science Center at Houston |