| Tissue | Expression Dynamics | Abbreviation |
| Breast |  | IDC: Invasive ductal carcinoma |
| DCIS: Ductal carcinoma in situ |
| Precancer(BRCA1-mut): Precancerous lesion from BRCA1 mutation carriers |
| Cervix | 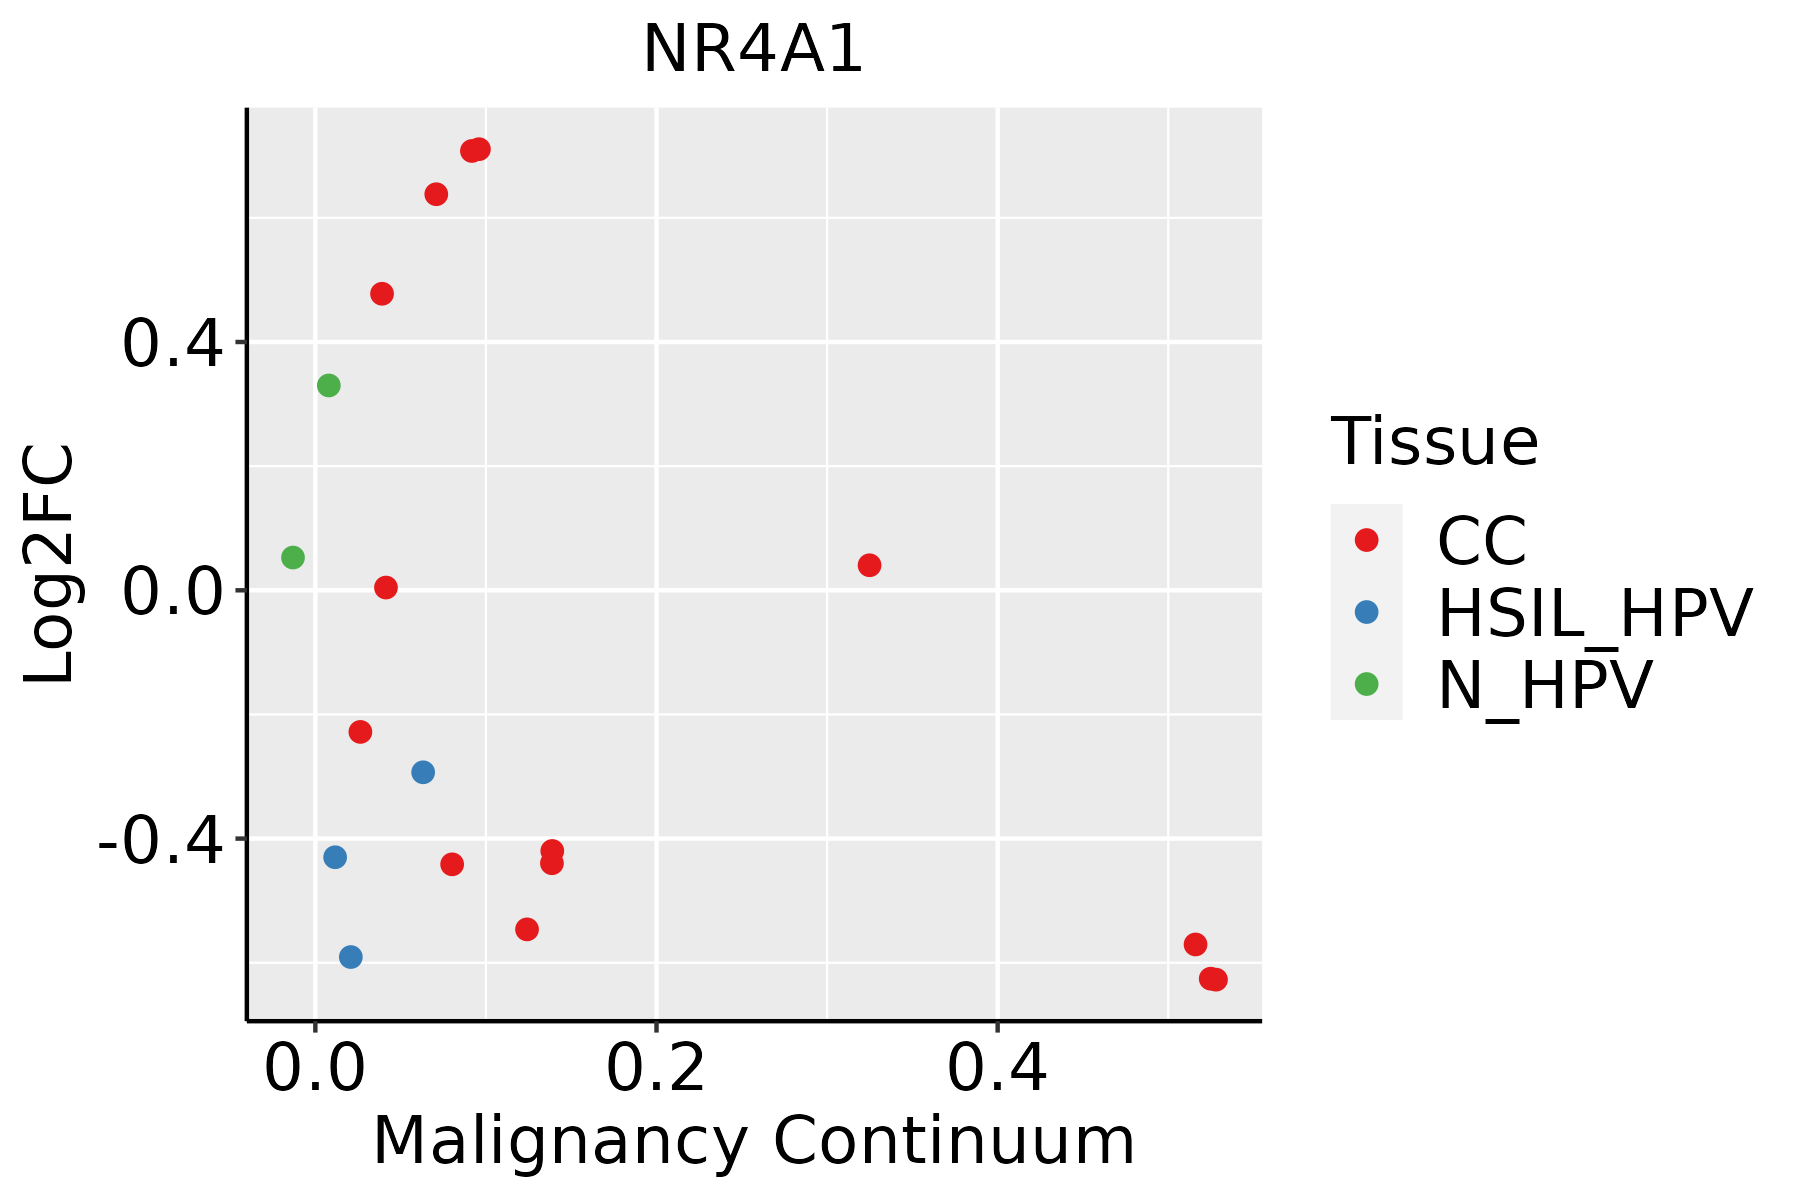 | CC: Cervix cancer |
| HSIL_HPV: HPV-infected high-grade squamous intraepithelial lesions |
| N_HPV: HPV-infected normal cervix |
| Colorectum (GSE201348) |  | FAP: Familial adenomatous polyposis |
| CRC: Colorectal cancer |
| Colorectum (HTA11) |  | AD: Adenomas |
| SER: Sessile serrated lesions |
| MSI-H: Microsatellite-high colorectal cancer |
| MSS: Microsatellite stable colorectal cancer |
| Endometrium |  | AEH: Atypical endometrial hyperplasia |
| EEC: Endometrioid Cancer |
| Esophagus |  | ESCC: Esophageal squamous cell carcinoma |
| HGIN: High-grade intraepithelial neoplasias |
| LGIN: Low-grade intraepithelial neoplasias |
| GC | 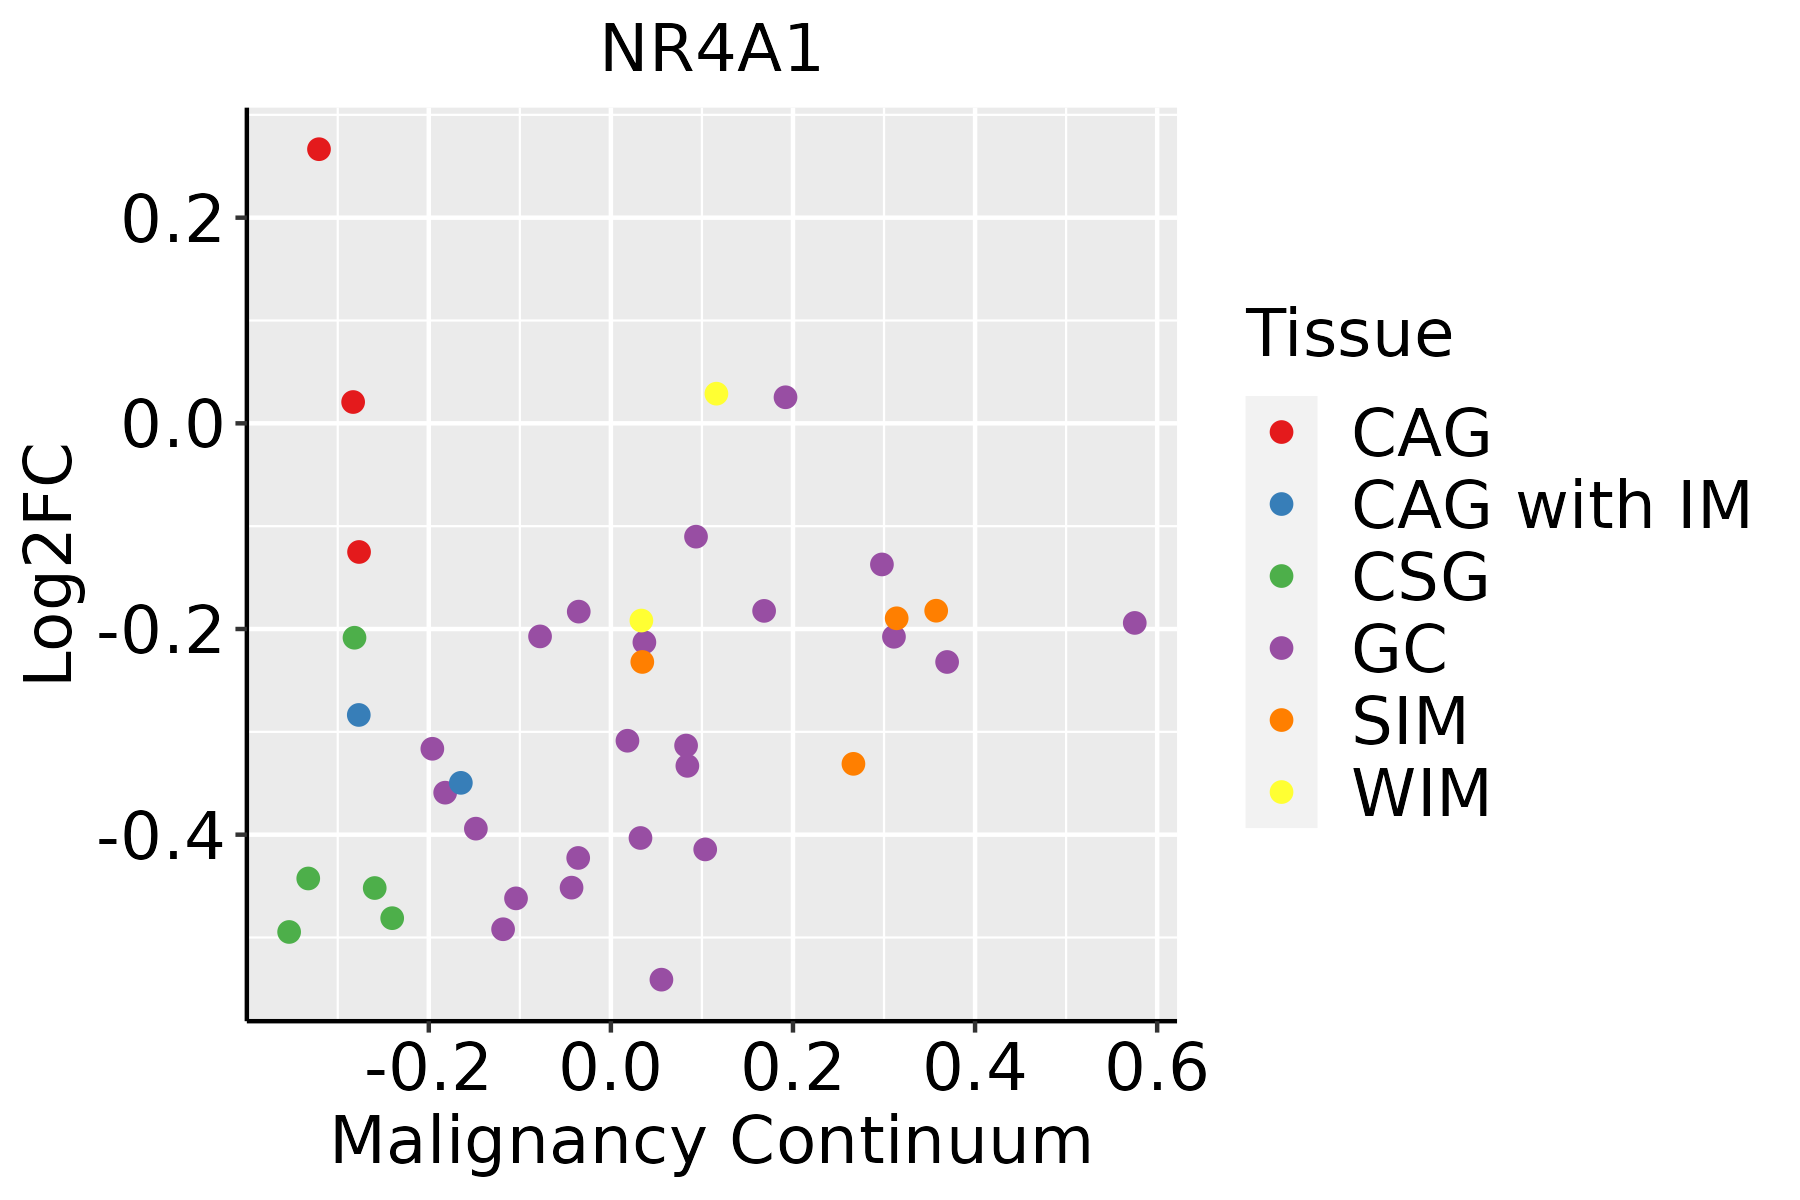 | CAG: Chronic atrophic gastritis |
| CAG with IM: Chronic atrophic gastritis with intestinal metaplasia |
| CSG: Chronic superficial gastritis |
| GC: Gastric cancer |
| SIM: Severe intestinal metaplasia |
| WIM: Wild intestinal metaplasia |
| Liver | 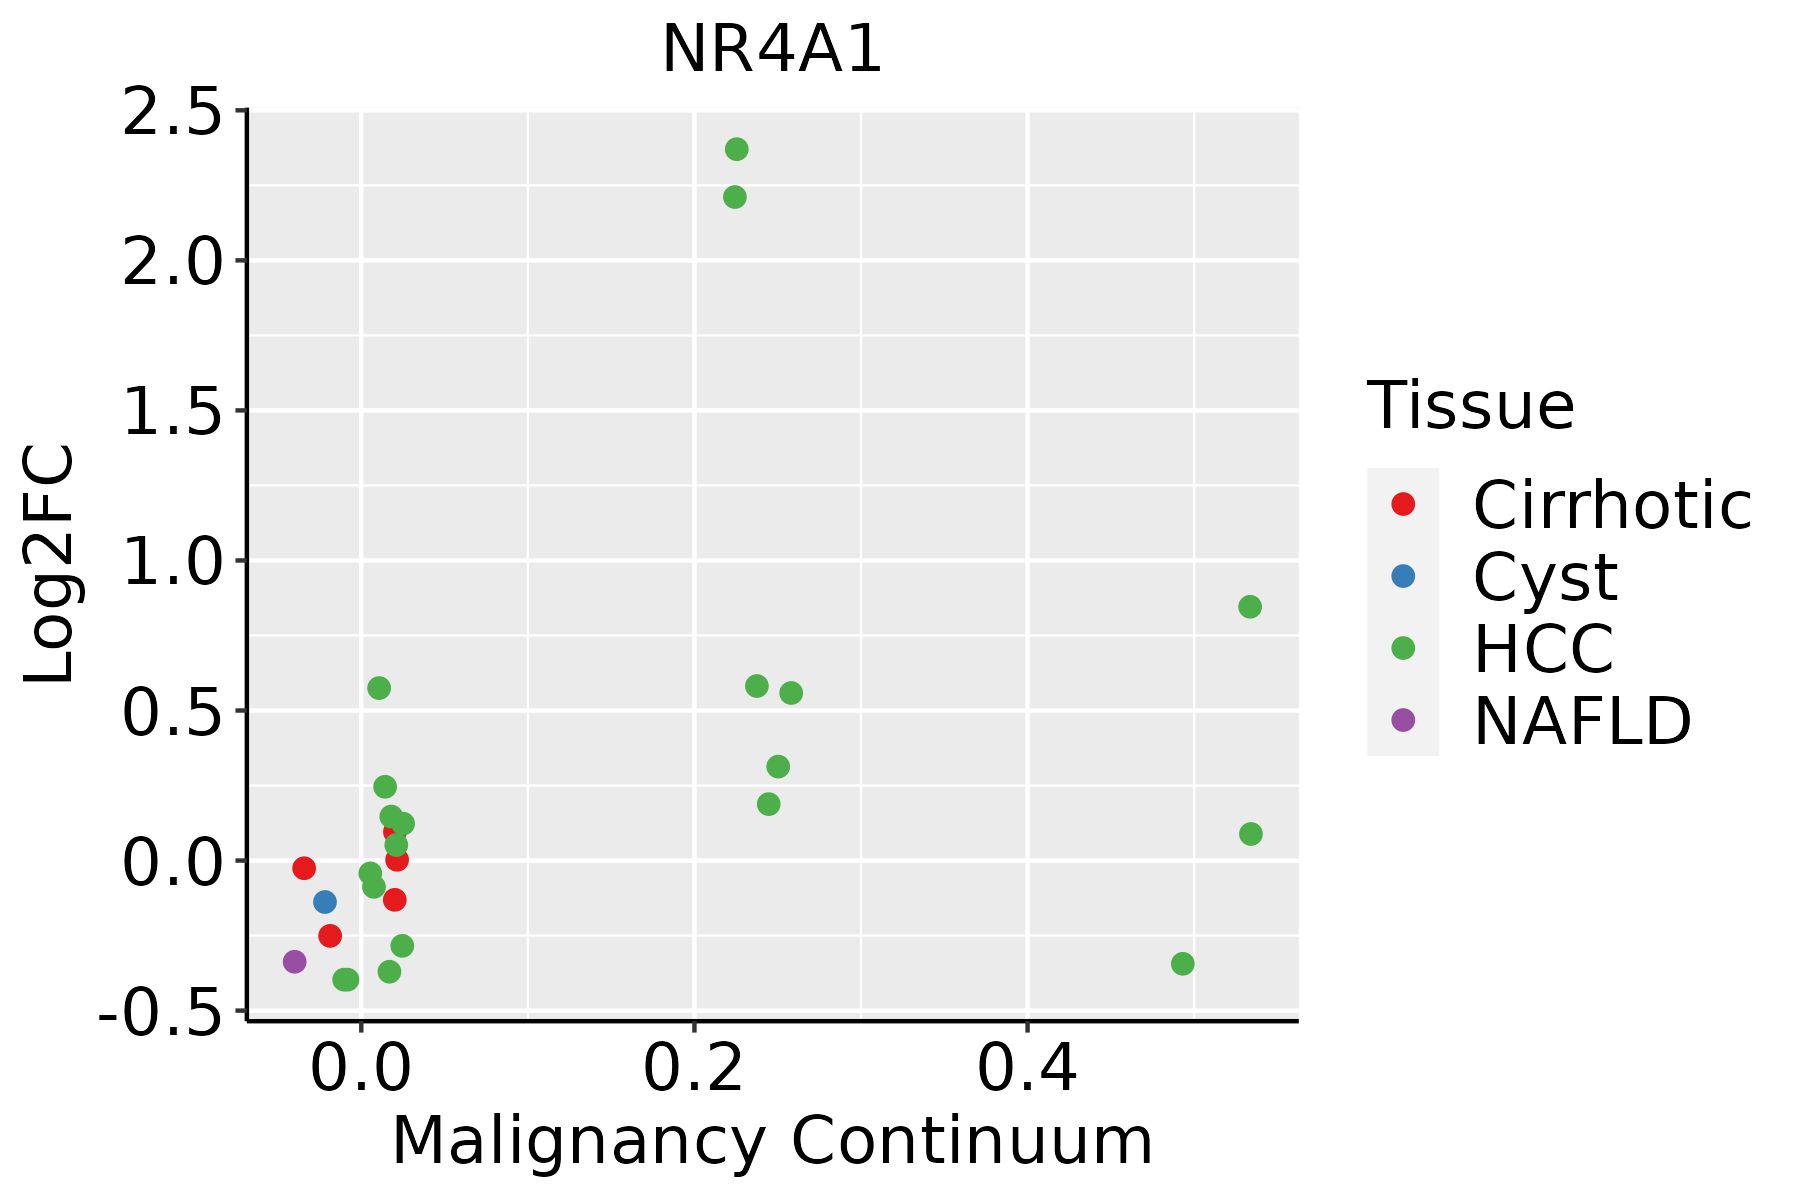 | HCC: Hepatocellular carcinoma |
| NAFLD: Non-alcoholic fatty liver disease |
| Oral Cavity | 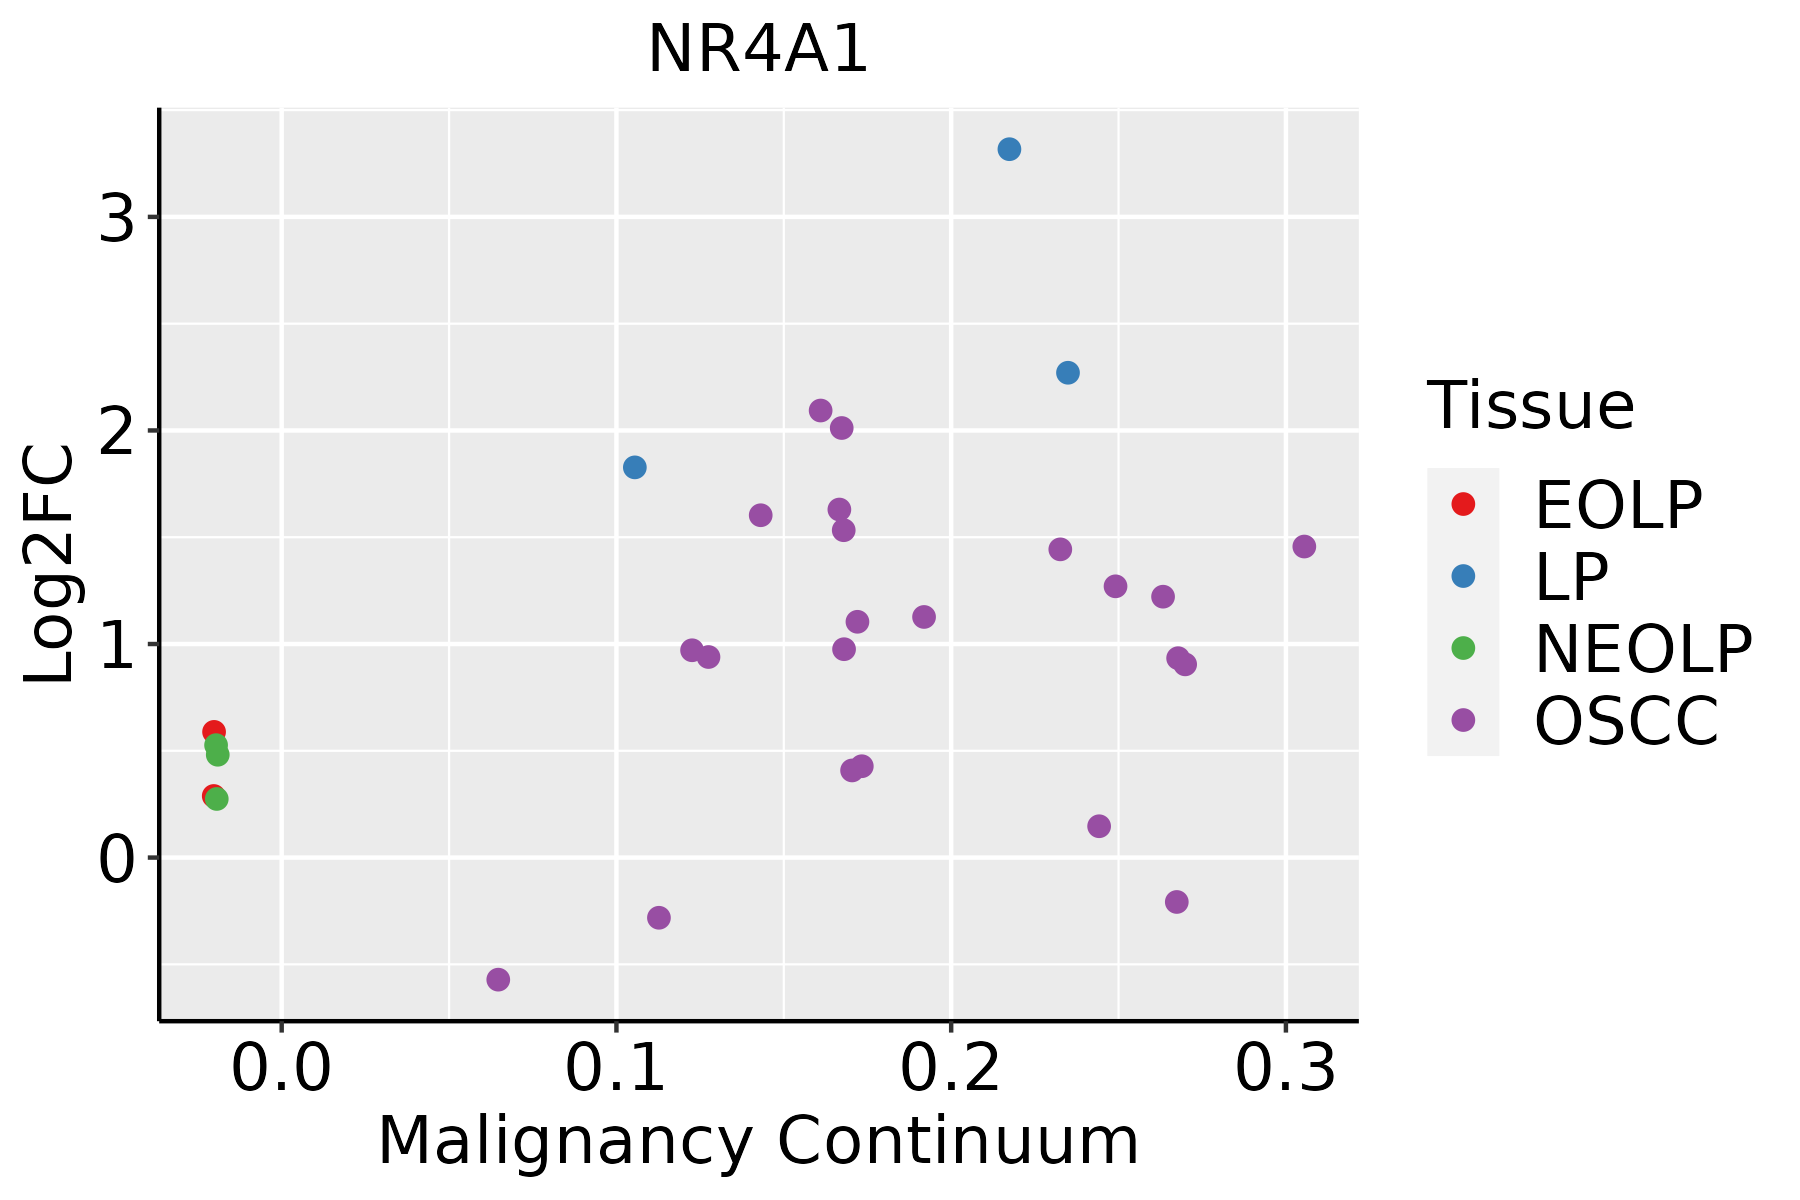 | EOLP: Erosive Oral lichen planus |
| LP: leukoplakia |
| NEOLP: Non-erosive oral lichen planus |
| OSCC: Oral squamous cell carcinoma |
| Prostate | 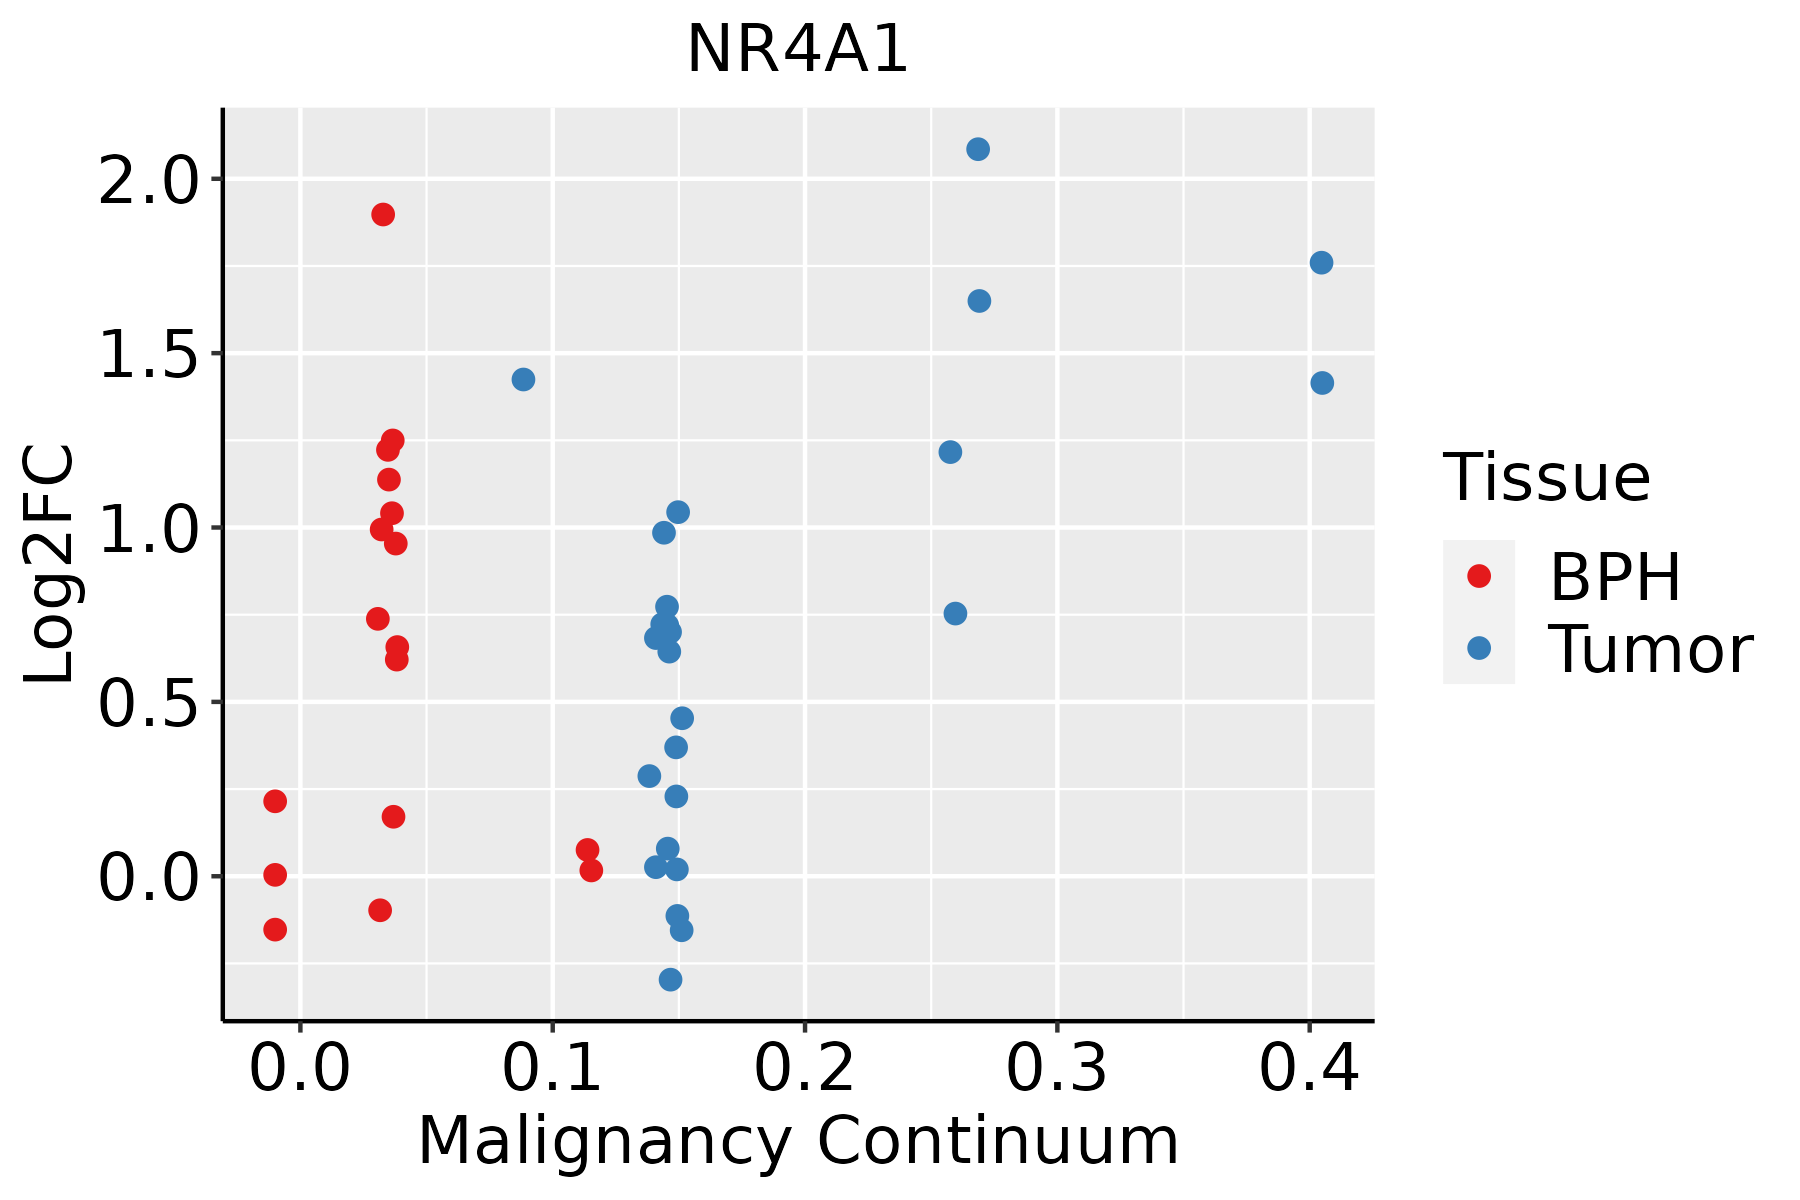 | BPH: Benign Prostatic Hyperplasia |
| Skin |  | AK: Actinic keratosis |
| cSCC: Cutaneous squamous cell carcinoma |
| SCCIS:squamous cell carcinoma in situ |
| Thyroid |  | ATC: Anaplastic thyroid cancer |
| HT: Hashimoto's thyroiditis |
| PTC: Papillary thyroid cancer |
| GO ID | Tissue | Disease Stage | Description | Gene Ratio | Bg Ratio | pvalue | p.adjust | Count |
| GO:00525479 | Breast | Precancer | regulation of peptidase activity | 71/1080 | 461/18723 | 2.72e-14 | 6.94e-12 | 71 |
| GO:00525489 | Breast | Precancer | regulation of endopeptidase activity | 67/1080 | 432/18723 | 1.06e-13 | 2.36e-11 | 67 |
| GO:20001169 | Breast | Precancer | regulation of cysteine-type endopeptidase activity | 43/1080 | 235/18723 | 1.30e-11 | 1.83e-09 | 43 |
| GO:00432819 | Breast | Precancer | regulation of cysteine-type endopeptidase activity involved in apoptotic process | 40/1080 | 209/18723 | 1.59e-11 | 2.07e-09 | 40 |
| GO:00458619 | Breast | Precancer | negative regulation of proteolysis | 50/1080 | 351/18723 | 2.99e-09 | 2.39e-07 | 50 |
| GO:00513468 | Breast | Precancer | negative regulation of hydrolase activity | 50/1080 | 379/18723 | 3.85e-08 | 2.34e-06 | 50 |
| GO:00104668 | Breast | Precancer | negative regulation of peptidase activity | 38/1080 | 262/18723 | 1.46e-07 | 7.82e-06 | 38 |
| GO:00109519 | Breast | Precancer | negative regulation of endopeptidase activity | 37/1080 | 252/18723 | 1.55e-07 | 8.05e-06 | 37 |
| GO:20001179 | Breast | Precancer | negative regulation of cysteine-type endopeptidase activity | 19/1080 | 86/18723 | 3.36e-07 | 1.58e-05 | 19 |
| GO:00603266 | Breast | Precancer | cell chemotaxis | 41/1080 | 310/18723 | 5.99e-07 | 2.55e-05 | 41 |
| GO:00431548 | Breast | Precancer | negative regulation of cysteine-type endopeptidase activity involved in apoptotic process | 17/1080 | 78/18723 | 1.69e-06 | 6.08e-05 | 17 |
| GO:00022378 | Breast | Precancer | response to molecule of bacterial origin | 43/1080 | 363/18723 | 6.05e-06 | 1.72e-04 | 43 |
| GO:00324968 | Breast | Precancer | response to lipopolysaccharide | 41/1080 | 343/18723 | 7.94e-06 | 2.17e-04 | 41 |
| GO:00106319 | Breast | Precancer | epithelial cell migration | 40/1080 | 357/18723 | 4.57e-05 | 9.71e-04 | 40 |
| GO:00901329 | Breast | Precancer | epithelium migration | 40/1080 | 360/18723 | 5.51e-05 | 1.14e-03 | 40 |
| GO:00506736 | Breast | Precancer | epithelial cell proliferation | 46/1080 | 437/18723 | 6.02e-05 | 1.23e-03 | 46 |
| GO:00435426 | Breast | Precancer | endothelial cell migration | 33/1080 | 279/18723 | 7.28e-05 | 1.44e-03 | 33 |
| GO:00901309 | Breast | Precancer | tissue migration | 40/1080 | 365/18723 | 7.48e-05 | 1.47e-03 | 40 |
| GO:00506786 | Breast | Precancer | regulation of epithelial cell proliferation | 40/1080 | 381/18723 | 1.88e-04 | 3.03e-03 | 40 |
| GO:00016678 | Breast | Precancer | ameboidal-type cell migration | 47/1080 | 475/18723 | 2.19e-04 | 3.35e-03 | 47 |
| Pathway ID | Tissue | Disease Stage | Description | Gene Ratio | Bg Ratio | pvalue | p.adjust | qvalue | Count |
| hsa040109 | Cervix | CC | MAPK signaling pathway | 62/1267 | 302/8465 | 4.89e-03 | 1.67e-02 | 9.86e-03 | 62 |
| hsa0401012 | Cervix | CC | MAPK signaling pathway | 62/1267 | 302/8465 | 4.89e-03 | 1.67e-02 | 9.86e-03 | 62 |
| hsa04010 | Colorectum | FAP | MAPK signaling pathway | 68/1404 | 302/8465 | 4.00e-03 | 1.67e-02 | 1.02e-02 | 68 |
| hsa04151 | Colorectum | FAP | PI3K-Akt signaling pathway | 75/1404 | 354/8465 | 1.23e-02 | 4.19e-02 | 2.55e-02 | 75 |
| hsa04925 | Colorectum | FAP | Aldosterone synthesis and secretion | 25/1404 | 98/8465 | 1.55e-02 | 4.99e-02 | 3.04e-02 | 25 |
| hsa040101 | Colorectum | FAP | MAPK signaling pathway | 68/1404 | 302/8465 | 4.00e-03 | 1.67e-02 | 1.02e-02 | 68 |
| hsa041511 | Colorectum | FAP | PI3K-Akt signaling pathway | 75/1404 | 354/8465 | 1.23e-02 | 4.19e-02 | 2.55e-02 | 75 |
| hsa049251 | Colorectum | FAP | Aldosterone synthesis and secretion | 25/1404 | 98/8465 | 1.55e-02 | 4.99e-02 | 3.04e-02 | 25 |
| hsa041517 | Esophagus | ESCC | PI3K-Akt signaling pathway | 197/4205 | 354/8465 | 1.24e-02 | 2.83e-02 | 1.45e-02 | 197 |
| hsa0415114 | Esophagus | ESCC | PI3K-Akt signaling pathway | 197/4205 | 354/8465 | 1.24e-02 | 2.83e-02 | 1.45e-02 | 197 |
| hsa0401014 | Oral cavity | OSCC | MAPK signaling pathway | 165/3704 | 302/8465 | 7.11e-05 | 2.74e-04 | 1.40e-04 | 165 |
| hsa041516 | Oral cavity | OSCC | PI3K-Akt signaling pathway | 185/3704 | 354/8465 | 6.26e-04 | 1.86e-03 | 9.49e-04 | 185 |
| hsa0401015 | Oral cavity | OSCC | MAPK signaling pathway | 165/3704 | 302/8465 | 7.11e-05 | 2.74e-04 | 1.40e-04 | 165 |
| hsa0415113 | Oral cavity | OSCC | PI3K-Akt signaling pathway | 185/3704 | 354/8465 | 6.26e-04 | 1.86e-03 | 9.49e-04 | 185 |
| hsa0401023 | Oral cavity | EOLP | MAPK signaling pathway | 68/1218 | 302/8465 | 7.48e-05 | 3.40e-04 | 2.01e-04 | 68 |
| hsa0415123 | Oral cavity | EOLP | PI3K-Akt signaling pathway | 73/1218 | 354/8465 | 7.03e-04 | 2.69e-03 | 1.59e-03 | 73 |
| hsa0401033 | Oral cavity | EOLP | MAPK signaling pathway | 68/1218 | 302/8465 | 7.48e-05 | 3.40e-04 | 2.01e-04 | 68 |
| hsa0415133 | Oral cavity | EOLP | PI3K-Akt signaling pathway | 73/1218 | 354/8465 | 7.03e-04 | 2.69e-03 | 1.59e-03 | 73 |
| hsa0415141 | Oral cavity | NEOLP | PI3K-Akt signaling pathway | 79/1112 | 354/8465 | 8.42e-07 | 9.92e-06 | 6.24e-06 | 79 |
| hsa0401041 | Oral cavity | NEOLP | MAPK signaling pathway | 59/1112 | 302/8465 | 9.40e-04 | 4.67e-03 | 2.94e-03 | 59 |
| Hugo Symbol | Variant Class | Variant Classification | dbSNP RS | HGVSc | HGVSp | HGVSp Short | SWISSPROT | BIOTYPE | SIFT | PolyPhen | Tumor Sample Barcode | Tissue | Histology | Sex | Age | Stage | Therapy Types | Drugs | Outcome |
| NR4A1 | SNV | Missense_Mutation | | c.1586G>A | p.Cys529Tyr | p.C529Y | | protein_coding | deleterious(0.01) | probably_damaging(1) | TCGA-A2-A0YH-01 | Breast | breast invasive carcinoma | Female | <65 | III/IV | Chemotherapy | adriamycin | SD |
| NR4A1 | SNV | Missense_Mutation | novel | c.572N>G | p.Ser191Trp | p.S191W | | protein_coding | deleterious(0) | probably_damaging(0.989) | TCGA-AC-A6IW-01 | Breast | breast invasive carcinoma | Female | >=65 | I/II | Unknown | Unknown | SD |
| NR4A1 | SNV | Missense_Mutation | | c.1109N>A | p.Arg370Gln | p.R370Q | | protein_coding | deleterious(0.01) | probably_damaging(0.995) | TCGA-AN-A046-01 | Breast | breast invasive carcinoma | Female | >=65 | I/II | Unknown | Unknown | SD |
| NR4A1 | SNV | Missense_Mutation | rs771251157 | c.1846C>A | p.Leu616Met | p.L616M | | protein_coding | deleterious(0) | probably_damaging(0.999) | TCGA-C8-A274-01 | Breast | breast invasive carcinoma | Female | <65 | I/II | Hormone Therapy | tamoxiphen | SD |
| NR4A1 | SNV | Missense_Mutation | rs771251157 | c.1846N>A | p.Leu616Met | p.L616M | | protein_coding | deleterious(0) | probably_damaging(0.999) | TCGA-D8-A4Z1-01 | Breast | breast invasive carcinoma | Female | >=65 | I/II | Hormone Therapy | tamoxiphen | SD |
| NR4A1 | deletion | Frame_Shift_Del | novel | c.1329delN | p.Glu443AspfsTer147 | p.E443Dfs*147 | | protein_coding | | | TCGA-EW-A2FV-01 | Breast | breast invasive carcinoma | Female | <65 | III/IV | Chemotherapy | docetaxel | SD |
| NR4A1 | SNV | Missense_Mutation | | c.1204C>T | p.Arg402Trp | p.R402W | | protein_coding | deleterious(0) | probably_damaging(1) | TCGA-A6-3809-01 | Colorectum | colon adenocarcinoma | Female | >=65 | I/II | Unknown | Unknown | SD |
| NR4A1 | SNV | Missense_Mutation | | c.1503C>A | p.Phe501Leu | p.F501L | | protein_coding | deleterious(0.01) | possibly_damaging(0.797) | TCGA-AD-A5EK-01 | Colorectum | colon adenocarcinoma | Male | <65 | I/II | Unknown | Unknown | SD |
| NR4A1 | SNV | Missense_Mutation | rs763639989 | c.1198C>T | p.Arg400Trp | p.R400W | | protein_coding | deleterious(0) | probably_damaging(1) | TCGA-A5-A0G2-01 | Endometrium | uterine corpus endometrioid carcinoma | Female | <65 | III/IV | Unknown | Unknown | SD |
| NR4A1 | SNV | Missense_Mutation | novel | c.11C>T | p.Ala4Val | p.A4V | | protein_coding | deleterious_low_confidence(0) | unknown(0) | TCGA-A5-A1OF-01 | Endometrium | uterine corpus endometrioid carcinoma | Female | <65 | I/II | Unknown | Unknown | SD |
| Entrez ID | Symbol | Category | Interaction Types | Drug Claim Name | Drug Name | PMIDs |
| 3164 | NR4A1 | NUCLEAR HORMONE RECEPTOR, DRUGGABLE GENOME, TRANSCRIPTION FACTOR, KINASE, TRANSCRIPTION FACTOR COMPLEX | | L-DOPA | LEVODOPA | 16930409,15896973 |
| 3164 | NR4A1 | NUCLEAR HORMONE RECEPTOR, DRUGGABLE GENOME, TRANSCRIPTION FACTOR, KINASE, TRANSCRIPTION FACTOR COMPLEX | | NICOTINE | NICOTINE | 12111438,11979430 |
| 3164 | NR4A1 | NUCLEAR HORMONE RECEPTOR, DRUGGABLE GENOME, TRANSCRIPTION FACTOR, KINASE, TRANSCRIPTION FACTOR COMPLEX | | IL-1 | | 7688736,15063754 |
| 3164 | NR4A1 | NUCLEAR HORMONE RECEPTOR, DRUGGABLE GENOME, TRANSCRIPTION FACTOR, KINASE, TRANSCRIPTION FACTOR COMPLEX | | PD-98059 | CHEMBL35482 | 15385570 |
| 3164 | NR4A1 | NUCLEAR HORMONE RECEPTOR, DRUGGABLE GENOME, TRANSCRIPTION FACTOR, KINASE, TRANSCRIPTION FACTOR COMPLEX | | RETINOIC ACID | | 11602619 |
| 3164 | NR4A1 | NUCLEAR HORMONE RECEPTOR, DRUGGABLE GENOME, TRANSCRIPTION FACTOR, KINASE, TRANSCRIPTION FACTOR COMPLEX | | HALOPERIDOL | HALOPERIDOL | 16893530 |
| 3164 | NR4A1 | NUCLEAR HORMONE RECEPTOR, DRUGGABLE GENOME, TRANSCRIPTION FACTOR, KINASE, TRANSCRIPTION FACTOR COMPLEX | | IONOMYCIN | IONOMYCIN | 16051191,9705872 |
| 3164 | NR4A1 | NUCLEAR HORMONE RECEPTOR, DRUGGABLE GENOME, TRANSCRIPTION FACTOR, KINASE, TRANSCRIPTION FACTOR COMPLEX | | MORPHINE | MORPHINE | 10719211 |
| 3164 | NR4A1 | NUCLEAR HORMONE RECEPTOR, DRUGGABLE GENOME, TRANSCRIPTION FACTOR, KINASE, TRANSCRIPTION FACTOR COMPLEX | | NAC | ACETYLCYSTEINE | 8647183 |
| 3164 | NR4A1 | NUCLEAR HORMONE RECEPTOR, DRUGGABLE GENOME, TRANSCRIPTION FACTOR, KINASE, TRANSCRIPTION FACTOR COMPLEX | | CYTOSPORONE B | CYTOSPORONE B | 18690216 |


