Schematic overview of the cellular and molecular mechanisms involved in the cancer progression, including the proposed cellular and molecular mechanisms in cancer cells trajectory. AT1: alveolar type 1 cells; AT2: alveolar type 2 cells; AAH: atypical adenomatous hyperplasia; AIS: adenocarcinoma in situ; MIA: minimally invasive adenocarcinoma; IA: invasive adenocarcinoma; EMT: epithelial-mesenchymal transition

Home

Download

Statistics

Help

Contact

Center for Computational Systems Medicine
leaf

Gene summary

leaf

Malignant transformation analysis

leaf

Malignant transformation related pathway analysis

leaf

Cell-cell communication analysis

leaf

Single-cell gene regulatory network inference analysis

leaf

Somatic mutation of malignant transformation related genes

leaf

Related drugs of malignant transformation related genes

Gene: NR3C2

Gene summary for NR3C2

check button Gene summary.

Gene informationSpeciesHuman
Gene symbol

NR3C2

Gene ID

4306

Gene namenuclear receptor subfamily 3 group C member 2
Gene AliasMCR
Cytomap4q31.23
Gene Typeprotein-coding
GO ID

GO:0006139

UniProtAcc

B0ZBF6


Top

Malignant transformation analysis

check button Identification of the aberrant gene expression in precancerous and cancerous lesions by comparing the gene expression of stem-like cells in diseased tissues with normal stem cells
check button Malignant transformation involving gene list.
Entrez IDSymbolReplicatesSpeciesOrganTissueAdj P-valueLog2FCMalignancy
4306NR3C2HTA11_3410_2000001011HumanColorectumAD1.33e-50-9.03e-010.0155
4306NR3C2HTA11_2951_2000001011HumanColorectumAD3.50e-06-8.57e-010.0216
4306NR3C2HTA11_347_2000001011HumanColorectumAD3.33e-251.00e+00-0.1954
4306NR3C2HTA11_411_2000001011HumanColorectumSER2.42e-139.07e-01-0.2602
4306NR3C2HTA11_2112_2000001011HumanColorectumSER4.17e-107.07e-01-0.2196
4306NR3C2HTA11_83_2000001011HumanColorectumSER1.86e-023.26e-01-0.1526
4306NR3C2HTA11_696_2000001011HumanColorectumAD2.17e-106.02e-01-0.1464
4306NR3C2HTA11_866_2000001011HumanColorectumAD2.49e-116.02e-01-0.1001
4306NR3C2HTA11_866_3004761011HumanColorectumAD4.59e-15-6.77e-010.096
4306NR3C2HTA11_9408_2000001011HumanColorectumAD4.39e-05-5.90e-010.0451
4306NR3C2HTA11_8622_2000001021HumanColorectumSER3.59e-09-8.33e-010.0528
4306NR3C2HTA11_10711_2000001011HumanColorectumAD4.50e-08-5.34e-010.0338
4306NR3C2HTA11_7696_3000711011HumanColorectumAD7.59e-31-7.81e-010.0674
4306NR3C2HTA11_7469_2000001011HumanColorectumAD5.39e-03-6.79e-01-0.0124
4306NR3C2HTA11_6818_2000001021HumanColorectumAD5.35e-32-9.89e-010.0588
4306NR3C2HTA11_99999970781_79442HumanColorectumMSS3.70e-79-1.20e+000.294
4306NR3C2HTA11_99999971662_82457HumanColorectumMSS5.83e-71-1.18e+000.3859
4306NR3C2HTA11_99999973899_84307HumanColorectumMSS4.69e-36-1.30e+000.2585
4306NR3C2HTA11_99999974143_84620HumanColorectumMSS1.24e-111-1.59e+000.3005
4306NR3C2F007HumanColorectumFAP9.75e-04-3.49e-010.1176
Page: 1 2 3 4 5 6 

check button Transcriptomic changes along malignancy continuum.
TissueExpression DynamicsAbbreviation
Colorectum (GSE201348)The image shows the transcriptomic changes along malignancy continuum.log2FC in expression of this searched gene in stem-like cells from each diseased tissue sample relative to stem-like cells in normal samples in each tissue plotted against the malignancy continuum. Samples are colored based on if they are from different disease stage.FAP: Familial adenomatous polyposis
CRC: Colorectal cancer
Colorectum (HTA11)The image shows the transcriptomic changes along malignancy continuum.log2FC in expression of this searched gene in stem-like cells from each diseased tissue sample relative to stem-like cells in normal samples in each tissue plotted against the malignancy continuum. Samples are colored based on if they are from different disease stage.AD: Adenomas
SER: Sessile serrated lesions
MSI-H: Microsatellite-high colorectal cancer
MSS: Microsatellite stable colorectal cancer
GCThe image shows the transcriptomic changes along malignancy continuum.log2FC in expression of this searched gene in stem-like cells from each diseased tissue sample relative to stem-like cells in normal samples in each tissue plotted against the malignancy continuum. Samples are colored based on if they are from different disease stage.CAG: Chronic atrophic gastritis
CAG with IM: Chronic atrophic gastritis with intestinal metaplasia
CSG: Chronic superficial gastritis
GC: Gastric cancer
SIM: Severe intestinal metaplasia
WIM: Wild intestinal metaplasia
LiverThe image shows the transcriptomic changes along malignancy continuum.log2FC in expression of this searched gene in stem-like cells from each diseased tissue sample relative to stem-like cells in normal samples in each tissue plotted against the malignancy continuum. Samples are colored based on if they are from different disease stage.
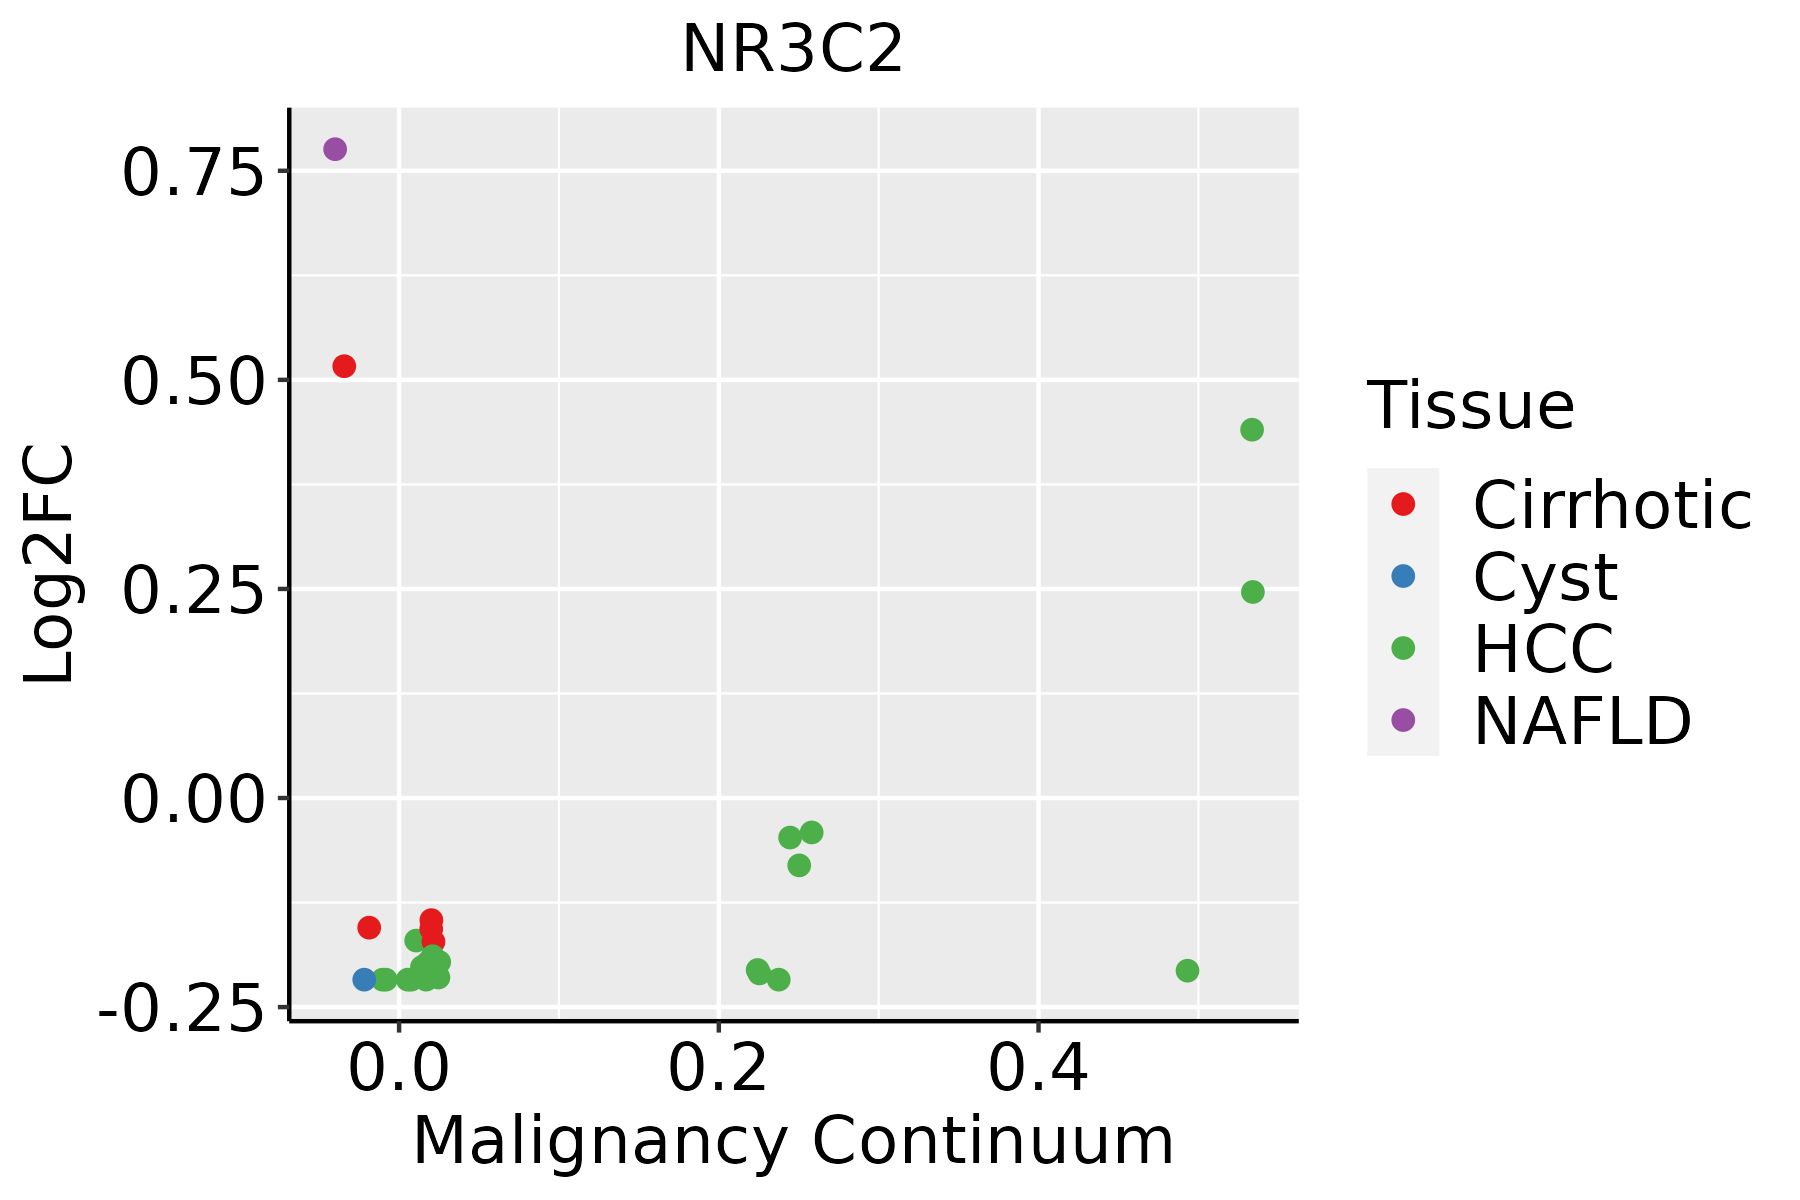
HCC: Hepatocellular carcinoma
NAFLD: Non-alcoholic fatty liver disease
LungThe image shows the transcriptomic changes along malignancy continuum.log2FC in expression of this searched gene in stem-like cells from each diseased tissue sample relative to stem-like cells in normal samples in each tissue plotted against the malignancy continuum. Samples are colored based on if they are from different disease stage.
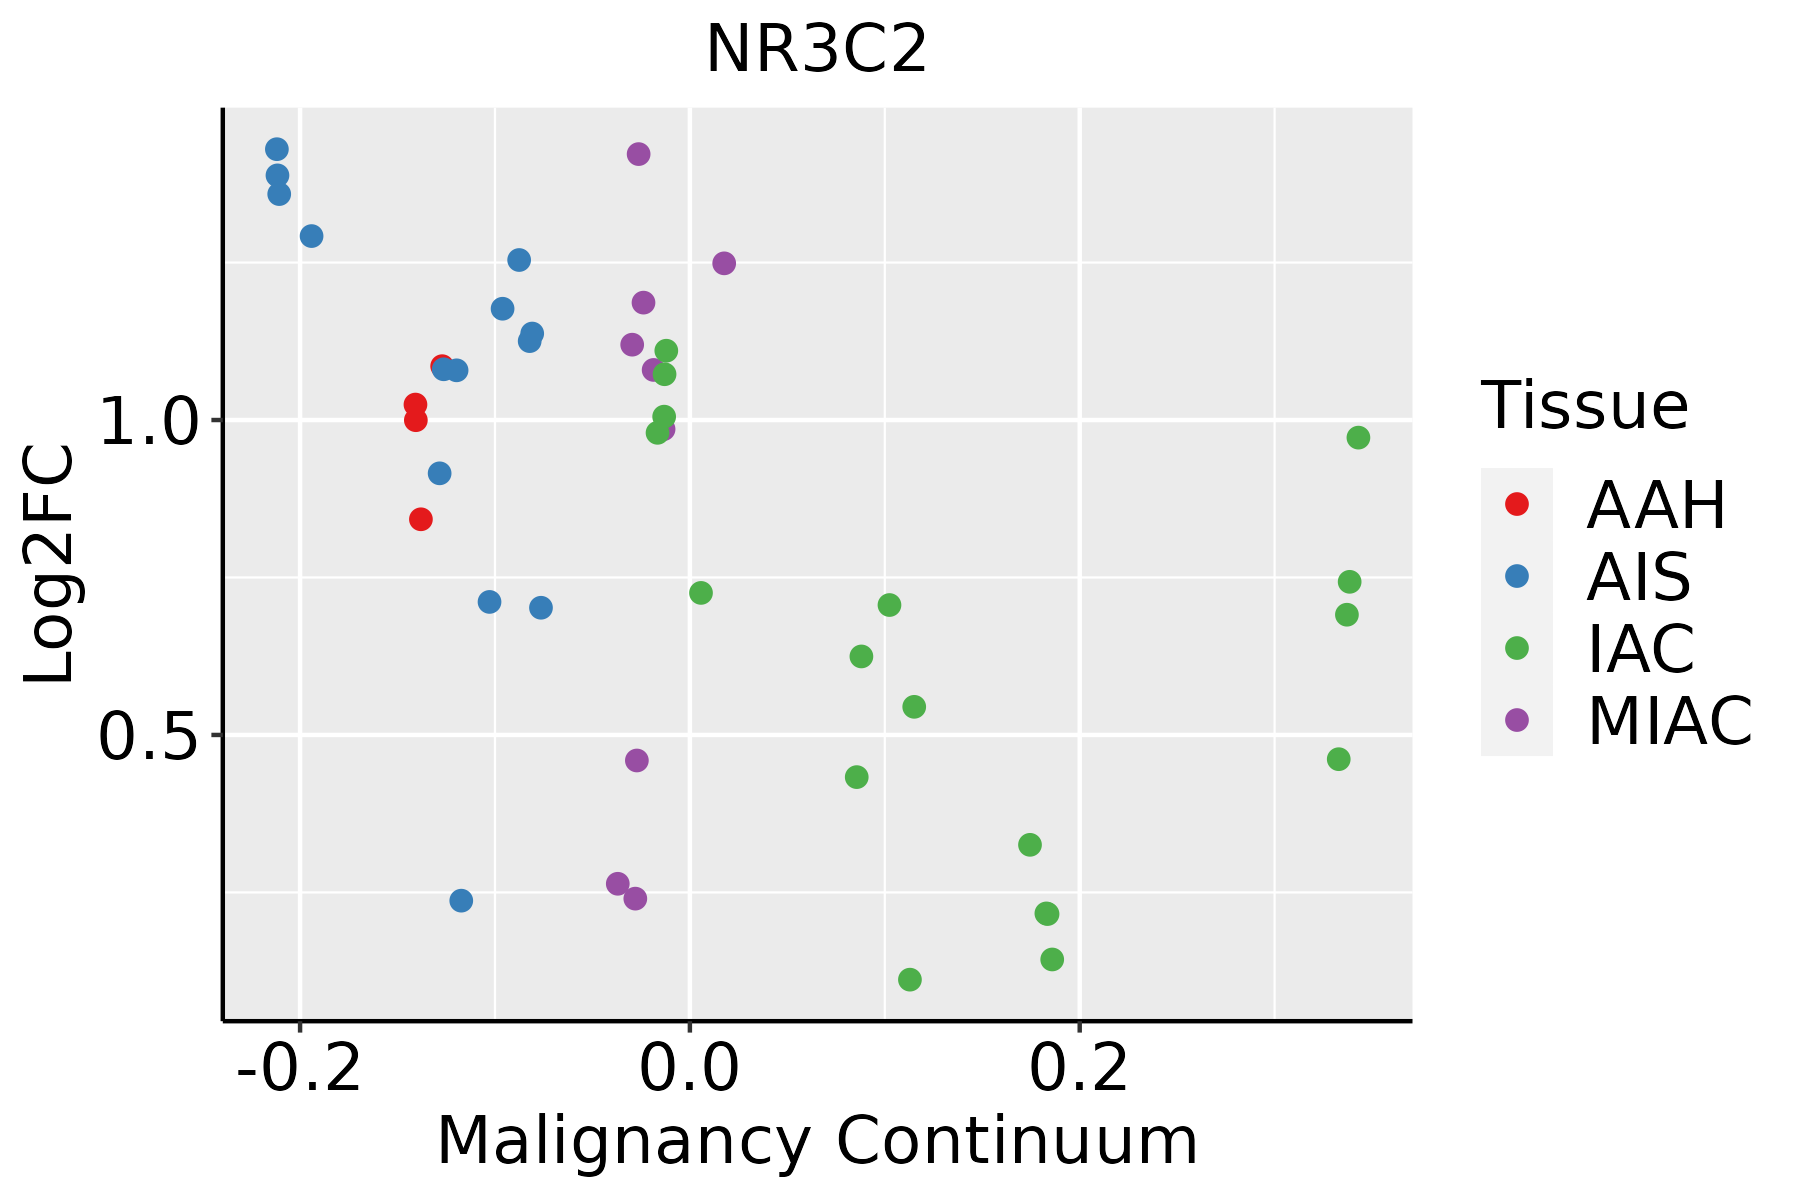
AAH: Atypical adenomatous hyperplasia
AIS: Adenocarcinoma in situ
IAC: Invasive lung adenocarcinoma
MIA: Minimally invasive adenocarcinoma
∗log2FC in expression of this searched gene in stem-like cells from each diseased tissue sample relative to stem-like cells in normal samples in each tissue plotted against the malignancy continuum. Samples are colored based on if they are from different disease stage.

Top

Malignant transformation related pathway analysis

check buttonFind out the enriched GO biological processes and KEGG pathways involved in transition from healthy to precancer to cancer
check button Figure of enriched GO biological processes.
TissueDisease StageEnriched GO biological Processes
ColorectumADGO analysis - Figure of enriched GO biological processes: Top 15 enriched GO BP terms are showed in the bar plot of each disease state in each tissue. Each row represents a significant GO biological process which is colored according to the -log10(p.adjust).
ColorectumSERGO analysis - Figure of enriched GO biological processes: Top 15 enriched GO BP terms are showed in the bar plot of each disease state in each tissue. Each row represents a significant GO biological process which is colored according to the -log10(p.adjust).
ColorectumMSSGO analysis - Figure of enriched GO biological processes: Top 15 enriched GO BP terms are showed in the bar plot of each disease state in each tissue. Each row represents a significant GO biological process which is colored according to the -log10(p.adjust).
ColorectumMSI-HGO analysis - Figure of enriched GO biological processes: Top 15 enriched GO BP terms are showed in the bar plot of each disease state in each tissue. Each row represents a significant GO biological process which is colored according to the -log10(p.adjust).
ColorectumFAPGO analysis - Figure of enriched GO biological processes: Top 15 enriched GO BP terms are showed in the bar plot of each disease state in each tissue. Each row represents a significant GO biological process which is colored according to the -log10(p.adjust).
∗Top 15 enriched GO BP terms are showed in the bar plot of each disease state in each tissue. Each row represents a significant GO biological process which is colored according to the -log10(p.adjust).
Page: 1 2 3 4 5 6 7 8 9 

check button Enriched GO biological processes.
GO IDTissueDisease StageDescriptionGene RatioBg Ratiopvaluep.adjustCount
GO:0071383ColorectumADcellular response to steroid hormone stimulus73/3918204/187236.31e-072.24e-0573
GO:0030522ColorectumADintracellular receptor signaling pathway87/3918265/187233.69e-061.03e-0487
GO:0043401ColorectumADsteroid hormone mediated signaling pathway51/3918136/187236.52e-061.63e-0451
GO:0048545ColorectumADresponse to steroid hormone104/3918339/187231.33e-052.90e-04104
GO:0009755ColorectumADhormone-mediated signaling pathway64/3918190/187232.78e-055.24e-0464
GO:0030518ColorectumADintracellular steroid hormone receptor signaling pathway43/3918116/187234.61e-057.97e-0443
GO:00713831ColorectumSERcellular response to steroid hormone stimulus55/2897204/187231.66e-055.05e-0455
GO:00485451ColorectumSERresponse to steroid hormone80/2897339/187235.15e-051.25e-0380
GO:00434011ColorectumSERsteroid hormone mediated signaling pathway38/2897136/187231.42e-042.82e-0338
GO:00097551ColorectumSERhormone-mediated signaling pathway49/2897190/187231.54e-043.00e-0349
GO:00305221ColorectumSERintracellular receptor signaling pathway63/2897265/187232.47e-044.20e-0363
GO:00305181ColorectumSERintracellular steroid hormone receptor signaling pathway31/2897116/187231.25e-031.41e-0231
GO:00713832ColorectumMSScellular response to steroid hormone stimulus72/3467204/187238.87e-095.43e-0772
GO:00434012ColorectumMSSsteroid hormone mediated signaling pathway51/3467136/187231.43e-076.67e-0651
GO:00305222ColorectumMSSintracellular receptor signaling pathway84/3467265/187231.47e-076.79e-0684
GO:00485452ColorectumMSSresponse to steroid hormone101/3467339/187232.60e-071.10e-05101
GO:00305182ColorectumMSSintracellular steroid hormone receptor signaling pathway44/3467116/187236.95e-072.49e-0544
GO:00097552ColorectumMSShormone-mediated signaling pathway63/3467190/187239.26e-073.23e-0563
GO:00713833ColorectumFAPcellular response to steroid hormone stimulus59/2622204/187232.12e-082.06e-0659
GO:00485454ColorectumFAPresponse to steroid hormone81/2622339/187236.22e-073.08e-0581
Page: 1 2 3 4 5 

check button Enriched KEGG pathways.
Pathway IDTissueDisease StageDescriptionGene RatioBg Ratiopvaluep.adjustqvalueCount
hsa04960ColorectumFAPAldosterone-regulated sodium reabsorption13/140437/84654.79e-031.91e-021.16e-0213
hsa049601ColorectumFAPAldosterone-regulated sodium reabsorption13/140437/84654.79e-031.91e-021.16e-0213
hsa049602ColorectumCRCAldosterone-regulated sodium reabsorption12/109137/84651.66e-031.20e-028.16e-0312
hsa049603ColorectumCRCAldosterone-regulated sodium reabsorption12/109137/84651.66e-031.20e-028.16e-0312
Page: 1 

Top

Cell-cell communication analysis

check buttonIdentification of potential cell-cell interactions between two cell types and their ligand-receptor pairs for different disease states
LigandReceptorLRpairPathwayTissueDisease Stage
Page: 1 

Top

Single-cell gene regulatory network inference analysis

check buttonFind out the significant the regulons (TFs) and the target genes of each regulon across cell types for different disease states
TFCell TypeTissueDisease StageTarget GeneRSSRegulon Activity
NR3C2MASTColorectumMSSSLC4A4,SLC26A2,SATB2, etc.4.05e-02The dot plots of a searched regulon are shown for all cell subpopulations in each disease state of each tissue based on the regulon specific score inferred using pySCENIC and by calculating the average expression.
NR3C2CD8TEXPEndometriumADJANK3,RASGRF2,IL7R, etc.2.64e-01The dot plots of a searched regulon are shown for all cell subpopulations in each disease state of each tissue based on the regulon specific score inferred using pySCENIC and by calculating the average expression.
NR3C2TH17EndometriumADJANK3,RASGRF2,IL7R, etc.7.94e-02The dot plots of a searched regulon are shown for all cell subpopulations in each disease state of each tissue based on the regulon specific score inferred using pySCENIC and by calculating the average expression.
NR3C2TFHEndometriumAEHANK3,RASGRF2,IL7R, etc.2.17e-01The dot plots of a searched regulon are shown for all cell subpopulations in each disease state of each tissue based on the regulon specific score inferred using pySCENIC and by calculating the average expression.
NR3C2CD8TEXPEndometriumAEHANK3,RASGRF2,IL7R, etc.1.18e-01The dot plots of a searched regulon are shown for all cell subpopulations in each disease state of each tissue based on the regulon specific score inferred using pySCENIC and by calculating the average expression.
NR3C2TH17EndometriumAEHANK3,RASGRF2,IL7R, etc.1.05e-01The dot plots of a searched regulon are shown for all cell subpopulations in each disease state of each tissue based on the regulon specific score inferred using pySCENIC and by calculating the average expression.
NR3C2TH17EndometriumEECANK3,RASGRF2,IL7R, etc.6.22e-02The dot plots of a searched regulon are shown for all cell subpopulations in each disease state of each tissue based on the regulon specific score inferred using pySCENIC and by calculating the average expression.
NR3C2CD8TEXPEndometriumEECANK3,RASGRF2,IL7R, etc.1.35e-01The dot plots of a searched regulon are shown for all cell subpopulations in each disease state of each tissue based on the regulon specific score inferred using pySCENIC and by calculating the average expression.
NR3C2CD4TNEndometriumHealthyANK3,RASGRF2,IL7R, etc.1.94e-01The dot plots of a searched regulon are shown for all cell subpopulations in each disease state of each tissue based on the regulon specific score inferred using pySCENIC and by calculating the average expression.
NR3C2CD8TEXPEndometriumHealthyANK3,RASGRF2,IL7R, etc.1.61e-01The dot plots of a searched regulon are shown for all cell subpopulations in each disease state of each tissue based on the regulon specific score inferred using pySCENIC and by calculating the average expression.
∗The dot plots of a searched regulon are shown for all cell subpopulations in each disease state of each tissue based on the regulon specific score inferred using pySCENIC and by calculating the average expression.
Page: 1 2 3 

Top

Somatic mutation of malignant transformation related genes

check buttonAnnotation of somatic variants for genes involved in malignant transformation
Hugo SymbolVariant ClassVariant ClassificationdbSNP RSHGVScHGVSpHGVSp ShortSWISSPROTBIOTYPESIFTPolyPhenTumor Sample BarcodeTissueHistologySexAgeStageTherapy TypesDrugsOutcome
NR3C2SNVMissense_Mutationrs776434075c.1091N>Tp.Thr364Metp.T364Mprotein_codingdeleterious_low_confidence(0)probably_damaging(0.945)TCGA-5L-AAT1-01Breastbreast invasive carcinomaFemale<65III/IVHormone TherapyletrozolSD
NR3C2SNVMissense_Mutationc.1220N>Cp.Ser407Thrp.S407Tprotein_codingtolerated_low_confidence(0.35)benign(0.145)TCGA-A8-A07L-01Breastbreast invasive carcinomaFemale<65III/IVChemotherapyCR
NR3C2SNVMissense_Mutationc.2870N>Tp.Pro957Leup.P957Lprotein_codingdeleterious(0)probably_damaging(1)TCGA-AC-A5XS-01Breastbreast invasive carcinomaFemale>=65I/IIHormone TherapyfemaraSD
NR3C2SNVMissense_Mutationc.1959G>Tp.Lys653Asnp.K653Nprotein_codingdeleterious(0)probably_damaging(1)TCGA-AN-A046-01Breastbreast invasive carcinomaFemale>=65I/IIUnknownUnknownSD
NR3C2SNVMissense_Mutationnovelc.2113N>Cp.Glu705Glnp.E705Qprotein_codingtolerated(0.34)benign(0.09)TCGA-AN-A0AR-01Breastbreast invasive carcinomaFemale<65I/IIUnknownUnknownSD
NR3C2SNVMissense_Mutationrs770059383c.53N>Ap.Arg18Glnp.R18Qprotein_codingtolerated_low_confidence(0.14)benign(0)TCGA-AR-A2LN-01Breastbreast invasive carcinomaFemale>=65I/IIHormone TherapyletrozoleSD
NR3C2SNVMissense_Mutationc.344C>Tp.Ala115Valp.A115Vprotein_codingdeleterious_low_confidence(0)benign(0.21)TCGA-BH-A0HB-01Breastbreast invasive carcinomaFemale<65I/IIChemotherapydocetaxelSD
NR3C2SNVMissense_Mutationnovelc.834N>Ap.His278Glnp.H278Qprotein_codingtolerated_low_confidence(0.19)possibly_damaging(0.579)TCGA-E2-A9RU-01Breastbreast invasive carcinomaFemale>=65III/IVHormone TherapyarimidexSD
NR3C2insertionIn_Frame_Insnovelc.2097_2098insGTGGCTCACGCCTGTAATCCCAGCACTTTGp.Pro699_Pro700insValAlaHisAlaCysAsnProSerThrLeup.P699_P700insVAHACNPSTLprotein_codingTCGA-BH-A0EE-01Breastbreast invasive carcinomaFemale>=65I/IIChemotherapydocetaxelSD
NR3C2insertionFrame_Shift_Insnovelc.2218_2219insGp.Met740SerfsTer4p.M740Sfs*4protein_codingTCGA-D8-A13Z-01Breastbreast invasive carcinomaFemale<65I/IIChemotherapydoxorubicineSD
Page: 1 2 3 4 5 6 7 8 9 10 11 12 13 14 

Top

Related drugs of malignant transformation related genes

check buttonIdentification of chemicals and drugs interact with genes involved in malignant transfromation
(DGIdb 4.0)
Entrez IDSymbolCategoryInteraction TypesDrug Claim NameDrug NamePMIDs
4306NR3C2NUCLEAR HORMONE RECEPTOR, DRUGGABLE GENOME, TRANSCRIPTION FACTORagonistCHEMBL1200592DESOXYCORTICOSTERONE PIVALATE
4306NR3C2NUCLEAR HORMONE RECEPTOR, DRUGGABLE GENOME, TRANSCRIPTION FACTORPMID27551786-Compound-106
4306NR3C2NUCLEAR HORMONE RECEPTOR, DRUGGABLE GENOME, TRANSCRIPTION FACTORagonist135651469
4306NR3C2NUCLEAR HORMONE RECEPTOR, DRUGGABLE GENOME, TRANSCRIPTION FACTORantagonist135651551PROGESTERONE
4306NR3C2NUCLEAR HORMONE RECEPTOR, DRUGGABLE GENOME, TRANSCRIPTION FACTORantagonist135650760ONAPRISTONE
4306NR3C2NUCLEAR HORMONE RECEPTOR, DRUGGABLE GENOME, TRANSCRIPTION FACTORPROGESTERONEPROGESTERONE
4306NR3C2NUCLEAR HORMONE RECEPTOR, DRUGGABLE GENOME, TRANSCRIPTION FACTORFLUDROCORTISONEFLUDROCORTISONE
4306NR3C2NUCLEAR HORMONE RECEPTOR, DRUGGABLE GENOME, TRANSCRIPTION FACTORKBP-5074
4306NR3C2NUCLEAR HORMONE RECEPTOR, DRUGGABLE GENOME, TRANSCRIPTION FACTORPMID27551786-Compound-II
4306NR3C2NUCLEAR HORMONE RECEPTOR, DRUGGABLE GENOME, TRANSCRIPTION FACTOREPLERENONEEPLERENONE
Page: 1 2 3 4 5 6 7