Schematic overview of the cellular and molecular mechanisms involved in the cancer progression, including the proposed cellular and molecular mechanisms in cancer cells trajectory. AT1: alveolar type 1 cells; AT2: alveolar type 2 cells; AAH: atypical adenomatous hyperplasia; AIS: adenocarcinoma in situ; MIA: minimally invasive adenocarcinoma; IA: invasive adenocarcinoma; EMT: epithelial-mesenchymal transition

Home

Download

Statistics

Help

Contact

Center for Computational Systems Medicine
leaf

Gene summary

leaf

Malignant transformation analysis

leaf

Malignant transformation related pathway analysis

leaf

Cell-cell communication analysis

leaf

Single-cell gene regulatory network inference analysis

leaf

Somatic mutation of malignant transformation related genes

leaf

Related drugs of malignant transformation related genes

Gene: NR3C1

Gene summary for NR3C1

check button Gene summary.

Gene informationSpeciesHuman
Gene symbol

NR3C1

Gene ID

2908

Gene namenuclear receptor subfamily 3 group C member 1
Gene AliasGCCR
Cytomap5q31.3
Gene Typeprotein-coding
GO ID

GO:0000122

UniProtAcc

F1D8N4


Top

Malignant transformation analysis

check button Identification of the aberrant gene expression in precancerous and cancerous lesions by comparing the gene expression of stem-like cells in diseased tissues with normal stem cells
check button Malignant transformation involving gene list.
Entrez IDSymbolReplicatesSpeciesOrganTissueAdj P-valueLog2FCMalignancy
2908NR3C1LZE4THumanEsophagusESCC2.55e-135.23e-010.0811
2908NR3C1LZE7THumanEsophagusESCC3.09e-057.67e-010.0667
2908NR3C1LZE20THumanEsophagusESCC6.26e-032.32e-010.0662
2908NR3C1LZE22THumanEsophagusESCC5.03e-054.27e-010.068
2908NR3C1LZE24THumanEsophagusESCC7.16e-299.92e-010.0596
2908NR3C1LZE21THumanEsophagusESCC2.47e-022.29e-010.0655
2908NR3C1LZE6THumanEsophagusESCC7.34e-096.26e-010.0845
2908NR3C1P2T-EHumanEsophagusESCC8.53e-153.71e-010.1177
2908NR3C1P4T-EHumanEsophagusESCC6.91e-195.15e-010.1323
2908NR3C1P5T-EHumanEsophagusESCC7.40e-347.44e-010.1327
2908NR3C1P8T-EHumanEsophagusESCC2.89e-195.02e-010.0889
2908NR3C1P9T-EHumanEsophagusESCC9.57e-234.88e-010.1131
2908NR3C1P10T-EHumanEsophagusESCC4.58e-193.77e-010.116
2908NR3C1P11T-EHumanEsophagusESCC2.00e-148.76e-010.1426
2908NR3C1P12T-EHumanEsophagusESCC1.57e-561.18e+000.1122
2908NR3C1P15T-EHumanEsophagusESCC2.78e-348.99e-010.1149
2908NR3C1P16T-EHumanEsophagusESCC1.55e-111.88e-010.1153
2908NR3C1P17T-EHumanEsophagusESCC1.99e-076.01e-010.1278
2908NR3C1P19T-EHumanEsophagusESCC1.51e-077.20e-010.1662
2908NR3C1P20T-EHumanEsophagusESCC8.07e-431.17e+000.1124
Page: 1 2 3 4 5 6 7 8 

check button Transcriptomic changes along malignancy continuum.
TissueExpression DynamicsAbbreviation
EsophagusThe image shows the transcriptomic changes along malignancy continuum.log2FC in expression of this searched gene in stem-like cells from each diseased tissue sample relative to stem-like cells in normal samples in each tissue plotted against the malignancy continuum. Samples are colored based on if they are from different disease stage.ESCC: Esophageal squamous cell carcinoma
HGIN: High-grade intraepithelial neoplasias
LGIN: Low-grade intraepithelial neoplasias
LiverThe image shows the transcriptomic changes along malignancy continuum.log2FC in expression of this searched gene in stem-like cells from each diseased tissue sample relative to stem-like cells in normal samples in each tissue plotted against the malignancy continuum. Samples are colored based on if they are from different disease stage.
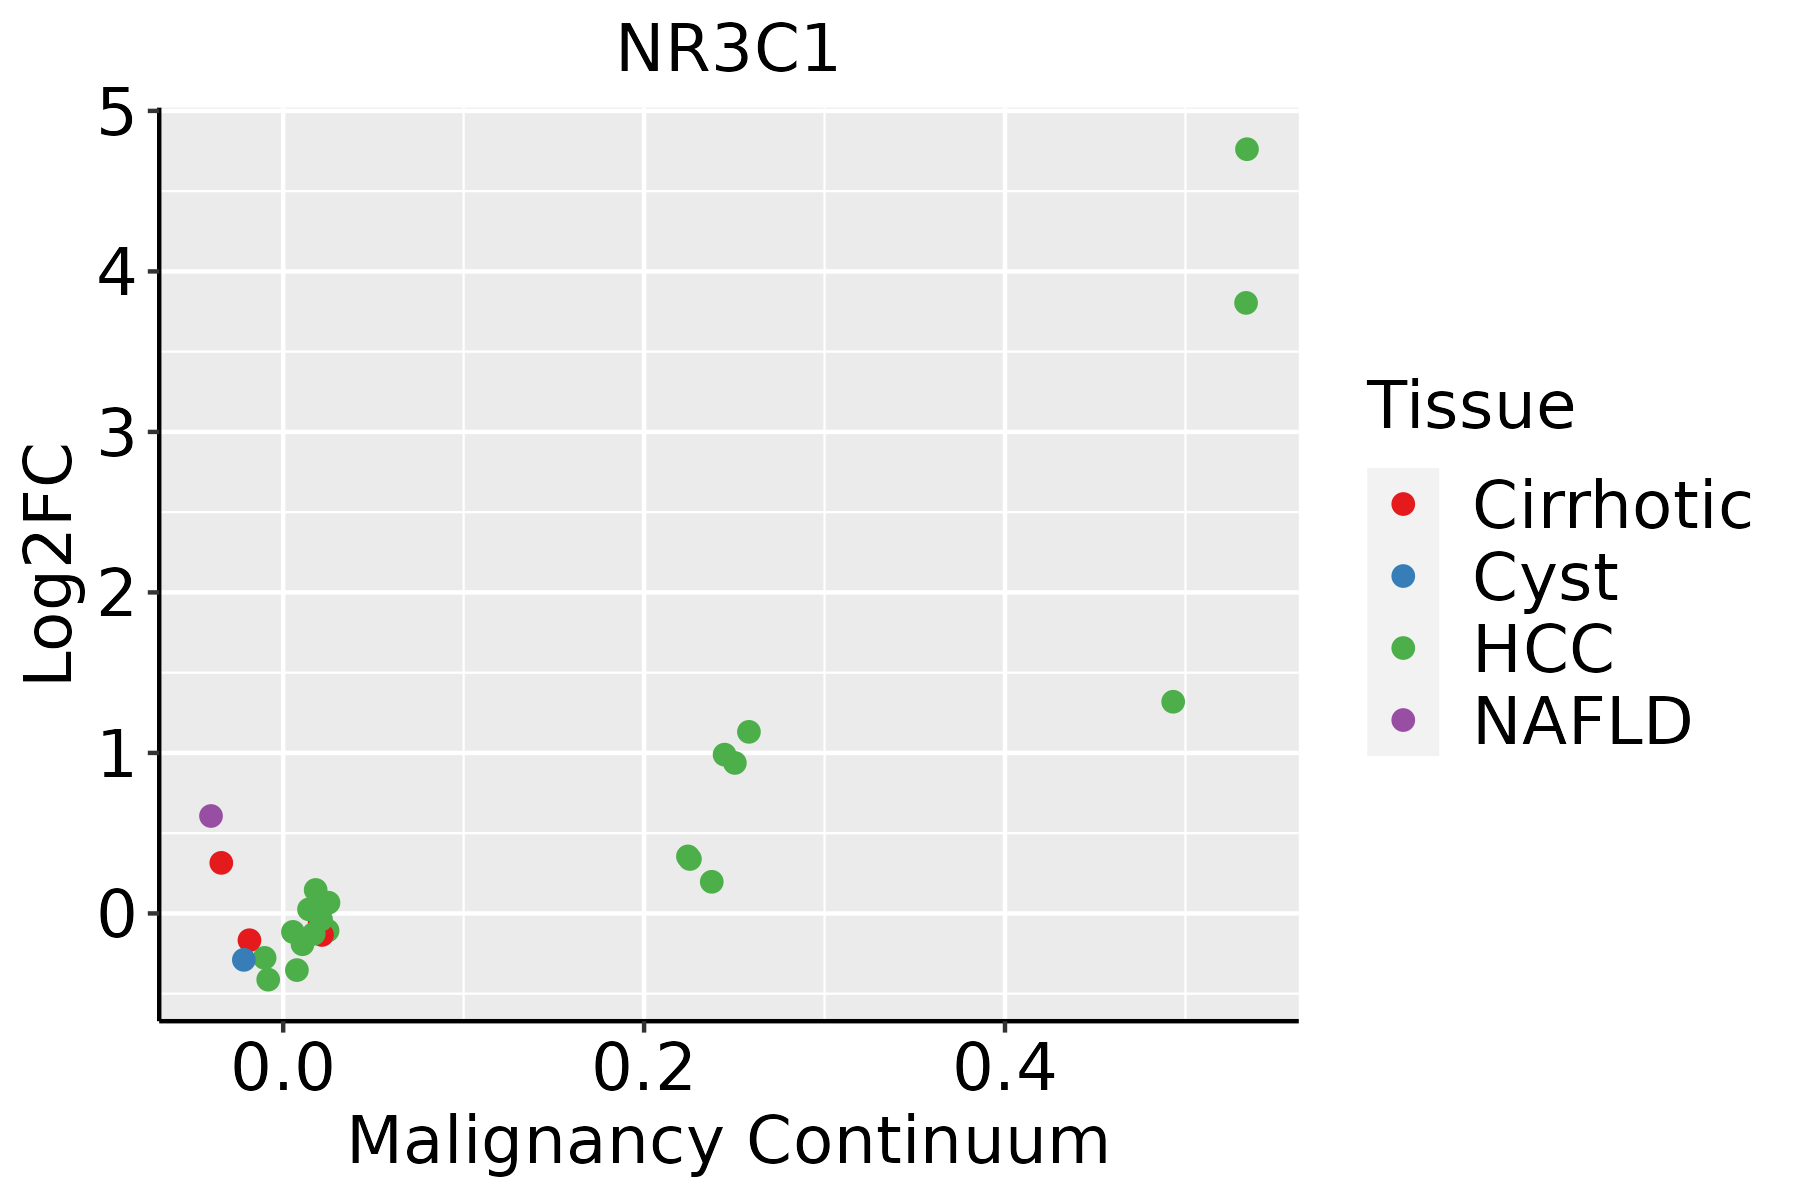
HCC: Hepatocellular carcinoma
NAFLD: Non-alcoholic fatty liver disease
LungThe image shows the transcriptomic changes along malignancy continuum.log2FC in expression of this searched gene in stem-like cells from each diseased tissue sample relative to stem-like cells in normal samples in each tissue plotted against the malignancy continuum. Samples are colored based on if they are from different disease stage.
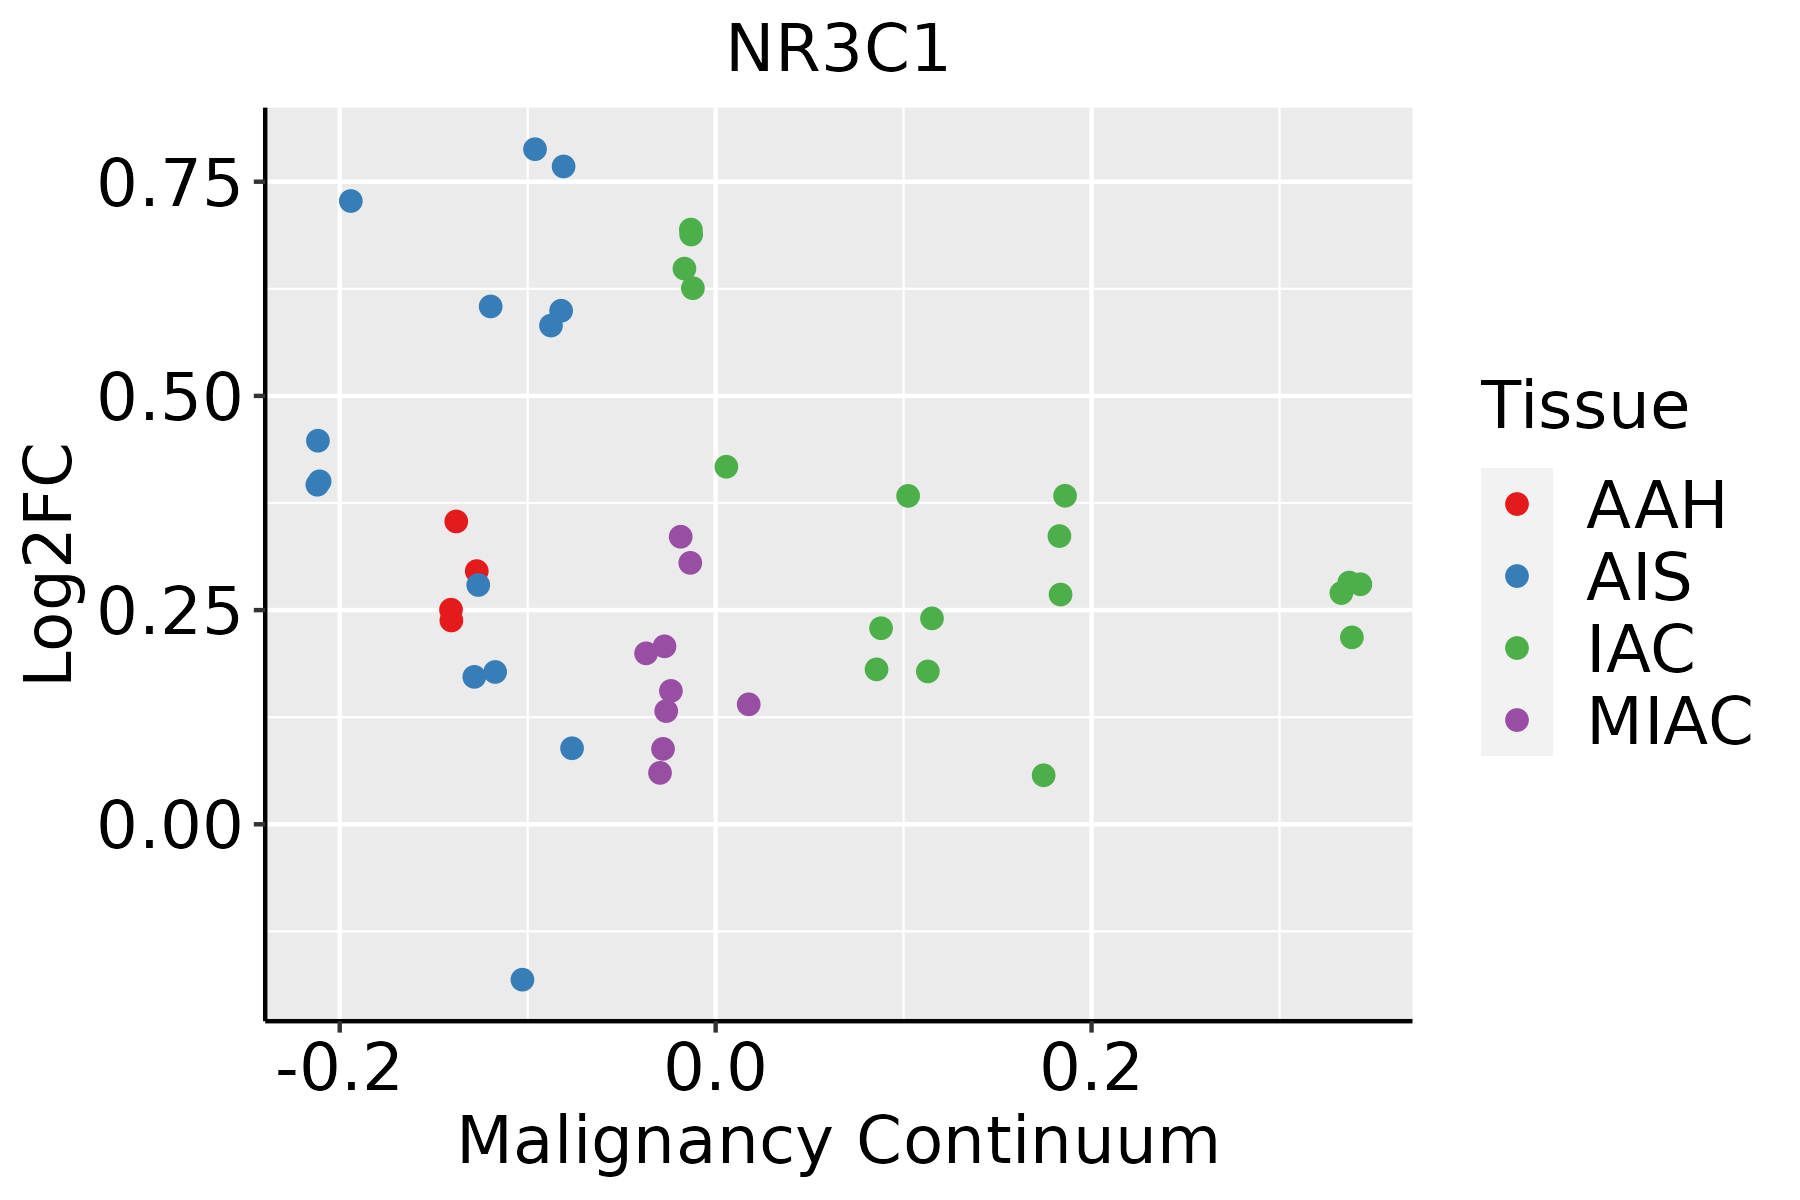
AAH: Atypical adenomatous hyperplasia
AIS: Adenocarcinoma in situ
IAC: Invasive lung adenocarcinoma
MIA: Minimally invasive adenocarcinoma
Oral CavityThe image shows the transcriptomic changes along malignancy continuum.log2FC in expression of this searched gene in stem-like cells from each diseased tissue sample relative to stem-like cells in normal samples in each tissue plotted against the malignancy continuum. Samples are colored based on if they are from different disease stage.
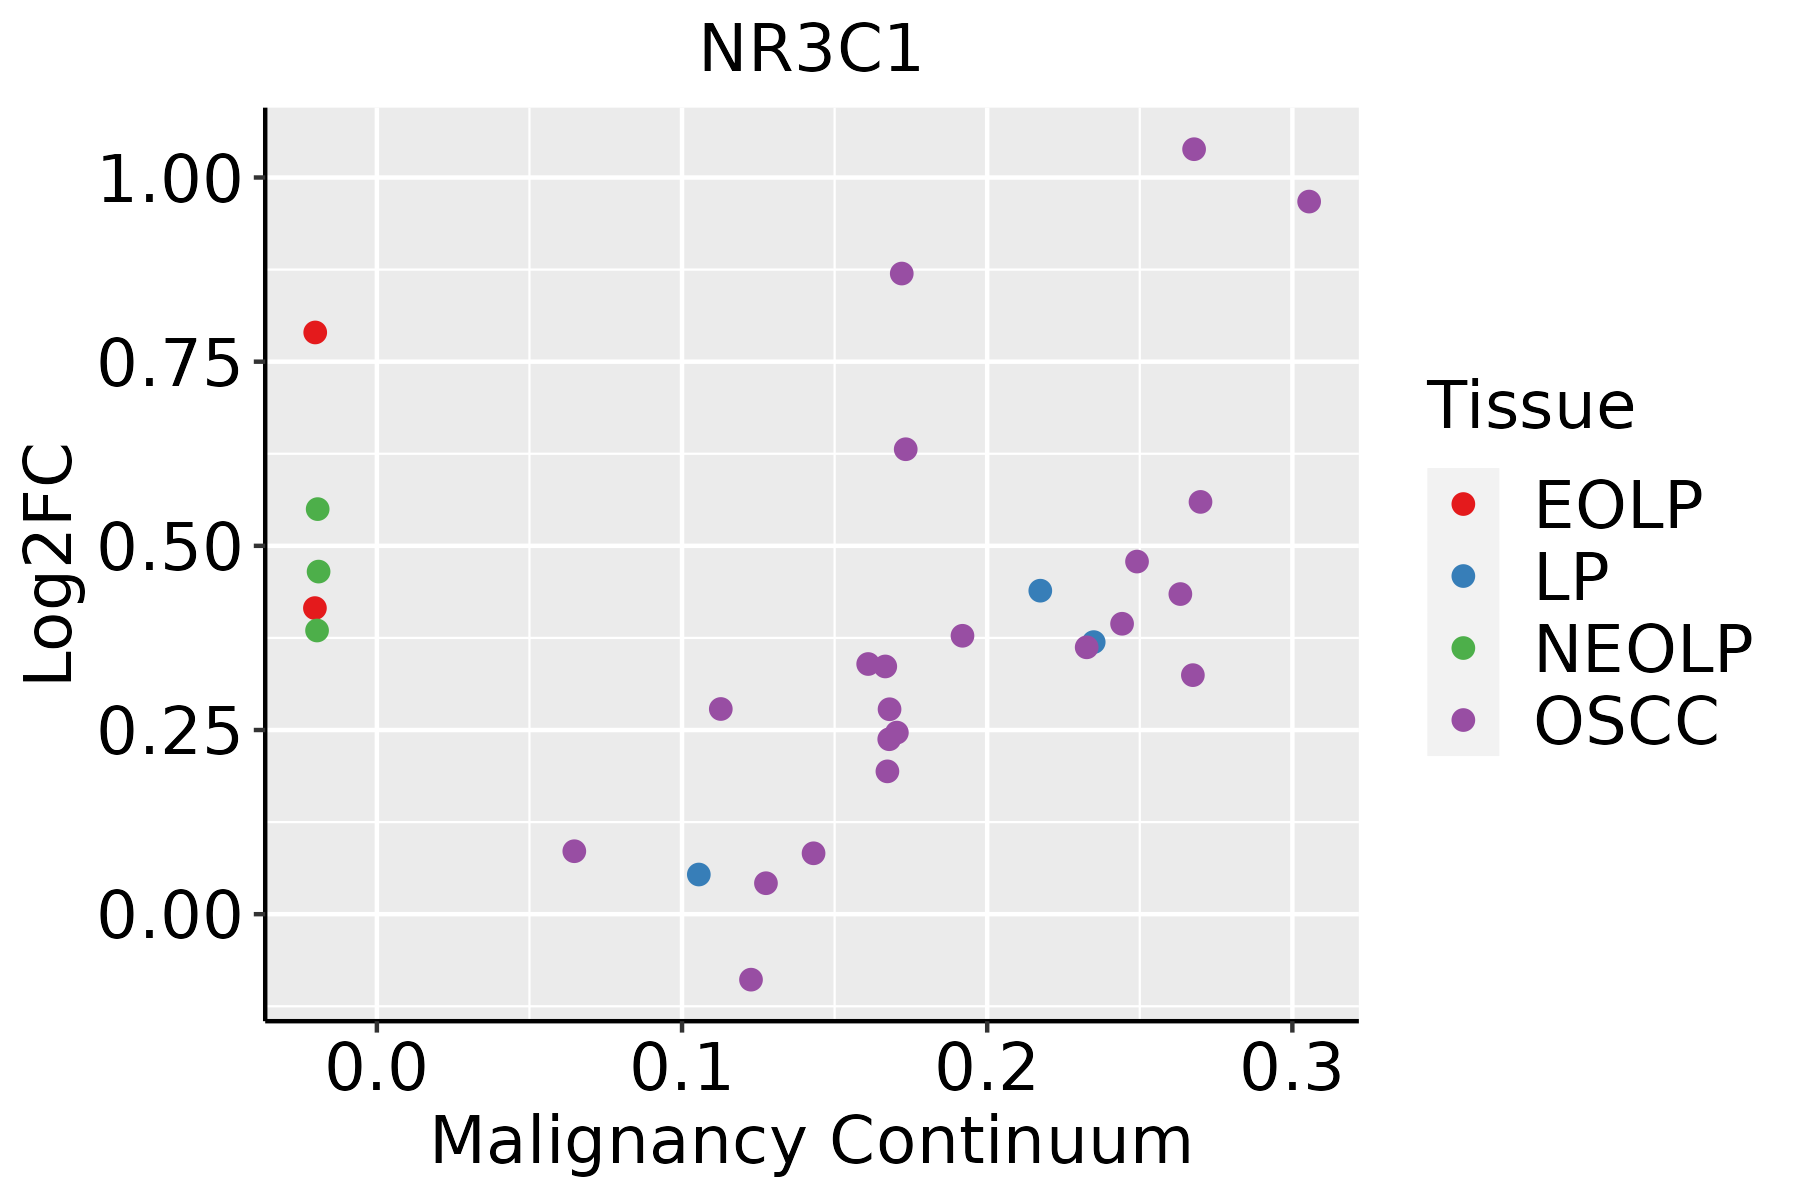
EOLP: Erosive Oral lichen planus
LP: leukoplakia
NEOLP: Non-erosive oral lichen planus
OSCC: Oral squamous cell carcinoma
ProstateThe image shows the transcriptomic changes along malignancy continuum.log2FC in expression of this searched gene in stem-like cells from each diseased tissue sample relative to stem-like cells in normal samples in each tissue plotted against the malignancy continuum. Samples are colored based on if they are from different disease stage.
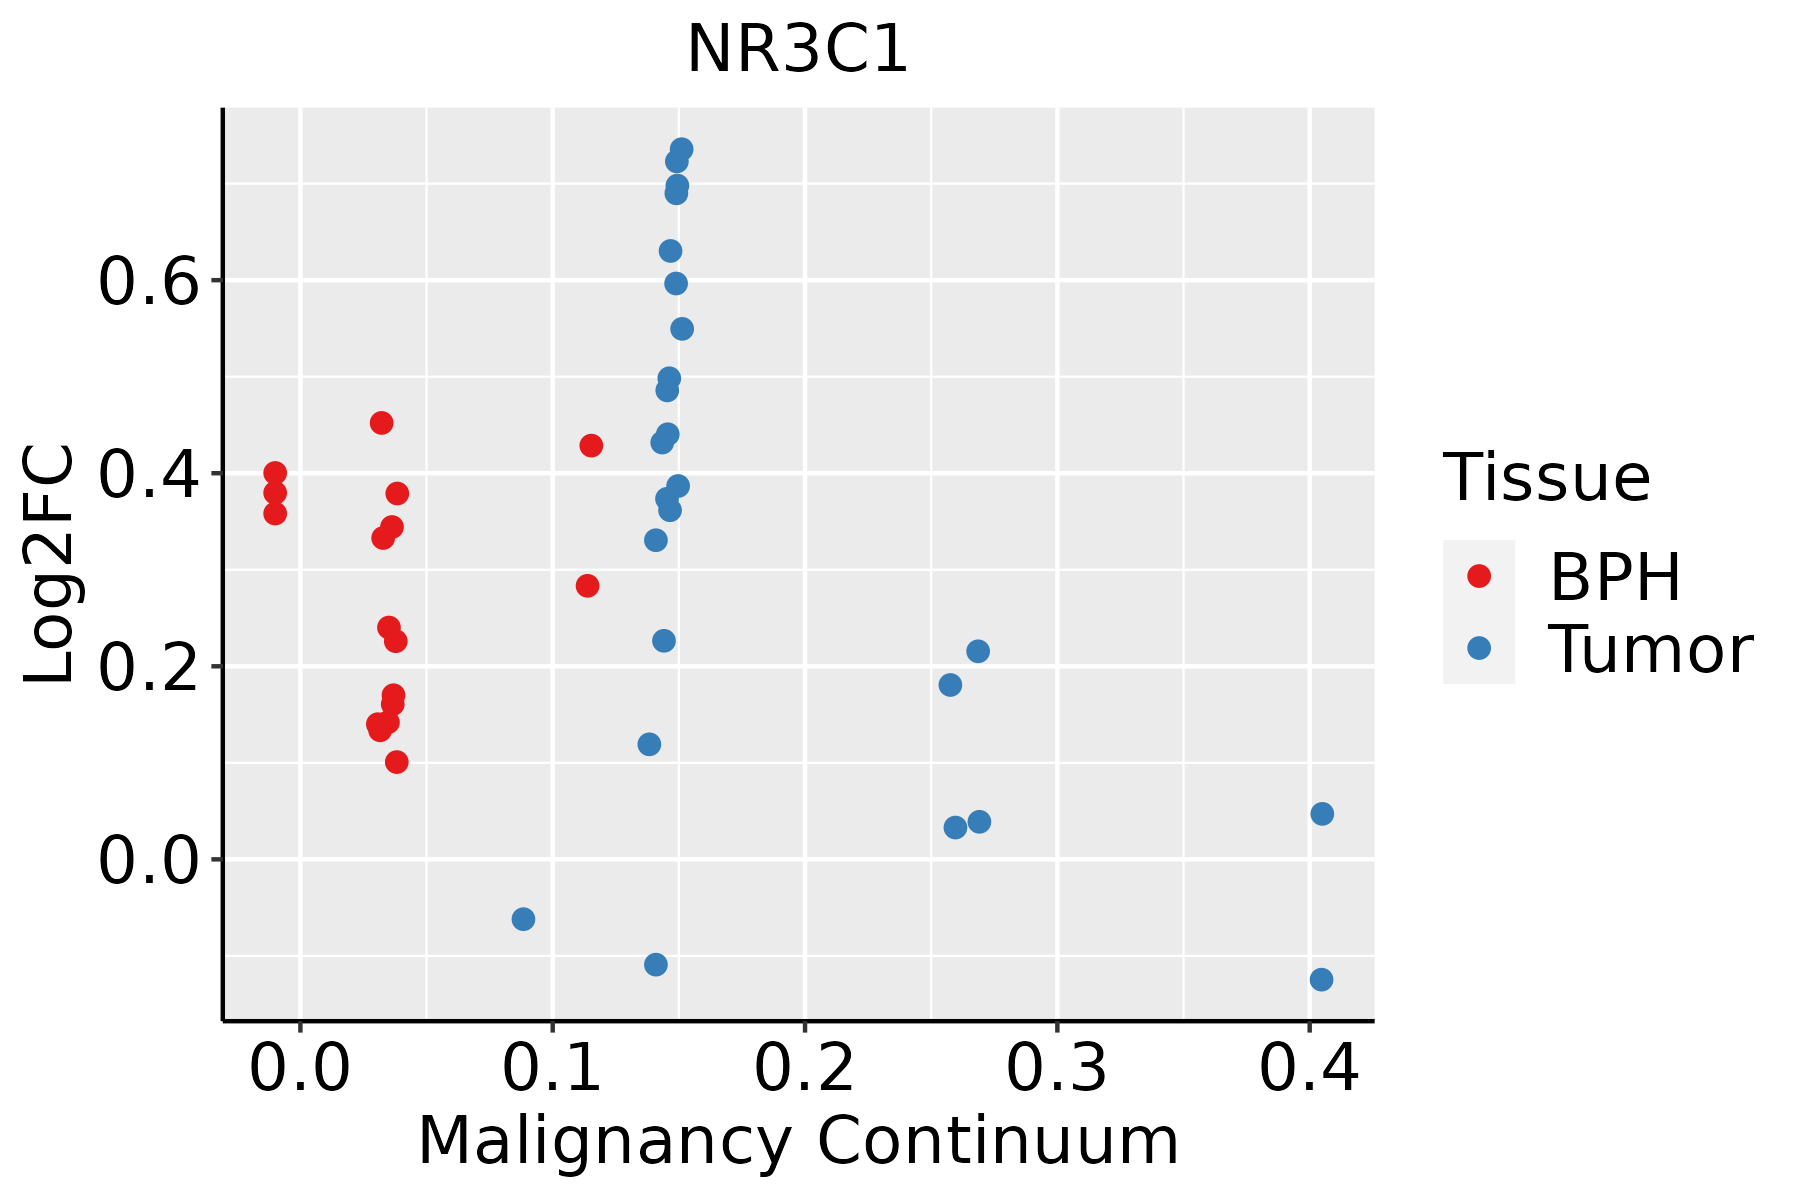
BPH: Benign Prostatic Hyperplasia
SkinThe image shows the transcriptomic changes along malignancy continuum.log2FC in expression of this searched gene in stem-like cells from each diseased tissue sample relative to stem-like cells in normal samples in each tissue plotted against the malignancy continuum. Samples are colored based on if they are from different disease stage.
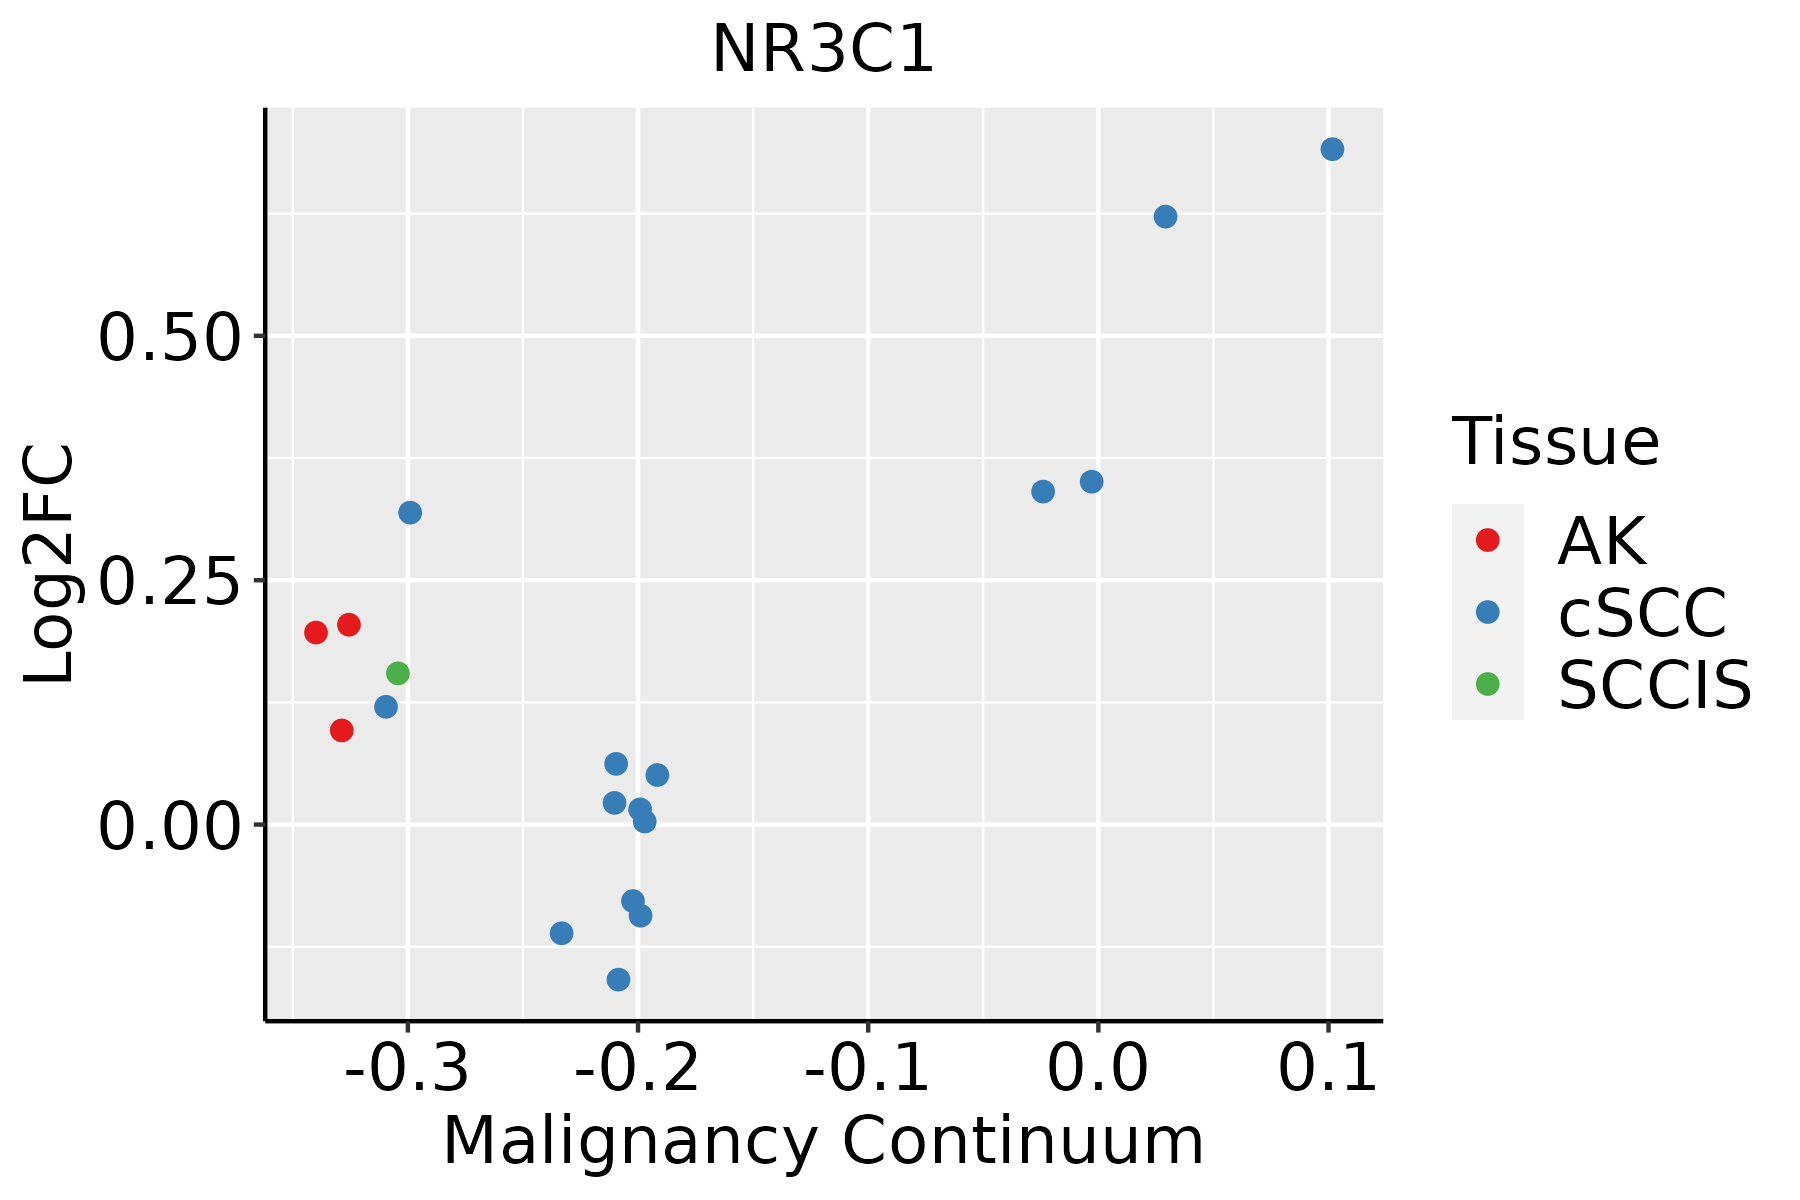
AK: Actinic keratosis
cSCC: Cutaneous squamous cell carcinoma
SCCIS:squamous cell carcinoma in situ
ThyroidThe image shows the transcriptomic changes along malignancy continuum.log2FC in expression of this searched gene in stem-like cells from each diseased tissue sample relative to stem-like cells in normal samples in each tissue plotted against the malignancy continuum. Samples are colored based on if they are from different disease stage.ATC: Anaplastic thyroid cancer
HT: Hashimoto's thyroiditis
PTC: Papillary thyroid cancer
∗log2FC in expression of this searched gene in stem-like cells from each diseased tissue sample relative to stem-like cells in normal samples in each tissue plotted against the malignancy continuum. Samples are colored based on if they are from different disease stage.

Top

Malignant transformation related pathway analysis

check buttonFind out the enriched GO biological processes and KEGG pathways involved in transition from healthy to precancer to cancer
check button Figure of enriched GO biological processes.
TissueDisease StageEnriched GO biological Processes
ColorectumADGO analysis - Figure of enriched GO biological processes: Top 15 enriched GO BP terms are showed in the bar plot of each disease state in each tissue. Each row represents a significant GO biological process which is colored according to the -log10(p.adjust).
ColorectumSERGO analysis - Figure of enriched GO biological processes: Top 15 enriched GO BP terms are showed in the bar plot of each disease state in each tissue. Each row represents a significant GO biological process which is colored according to the -log10(p.adjust).
ColorectumMSSGO analysis - Figure of enriched GO biological processes: Top 15 enriched GO BP terms are showed in the bar plot of each disease state in each tissue. Each row represents a significant GO biological process which is colored according to the -log10(p.adjust).
ColorectumMSI-HGO analysis - Figure of enriched GO biological processes: Top 15 enriched GO BP terms are showed in the bar plot of each disease state in each tissue. Each row represents a significant GO biological process which is colored according to the -log10(p.adjust).
ColorectumFAPGO analysis - Figure of enriched GO biological processes: Top 15 enriched GO BP terms are showed in the bar plot of each disease state in each tissue. Each row represents a significant GO biological process which is colored according to the -log10(p.adjust).
∗Top 15 enriched GO BP terms are showed in the bar plot of each disease state in each tissue. Each row represents a significant GO biological process which is colored according to the -log10(p.adjust).
Page: 1 2 3 4 5 6 7 8 9 

check button Enriched GO biological processes.
GO IDTissueDisease StageDescriptionGene RatioBg Ratiopvaluep.adjustCount
GO:000705911EsophagusESCCchromosome segregation238/8552346/187231.72e-181.82e-16238
GO:0030522110EsophagusESCCintracellular receptor signaling pathway170/8552265/187238.58e-102.09e-08170
GO:0048545111EsophagusESCCresponse to steroid hormone204/8552339/187234.47e-088.11e-07204
GO:000632517EsophagusESCCchromatin organization240/8552409/187236.52e-081.14e-06240
GO:00715599EsophagusESCCresponse to transforming growth factor beta157/8552256/187232.95e-074.23e-06157
GO:0071383110EsophagusESCCcellular response to steroid hormone stimulus127/8552204/187231.26e-061.55e-05127
GO:00715609EsophagusESCCcellular response to transforming growth factor beta stimulus151/8552250/187231.78e-062.10e-05151
GO:003051819EsophagusESCCintracellular steroid hormone receptor signaling pathway76/8552116/187231.25e-051.15e-0476
GO:004340119EsophagusESCCsteroid hormone mediated signaling pathway87/8552136/187231.25e-051.15e-0487
GO:1901654111EsophagusESCCresponse to ketone118/8552194/187231.45e-051.31e-04118
GO:19016556EsophagusESCCcellular response to ketone59/855296/187231.32e-036.30e-0359
GO:003196020EsophagusESCCresponse to corticosteroid95/8552167/187232.27e-039.99e-0395
GO:005138420EsophagusESCCresponse to glucocorticoid85/8552148/187232.60e-031.11e-0285
GO:000975516EsophagusESCChormone-mediated signaling pathway106/8552190/187233.13e-031.30e-02106
GO:00715487EsophagusESCCresponse to dexamethasone26/855239/187236.63e-032.43e-0226
GO:00319582EsophagusESCCcorticosteroid receptor signaling pathway12/855215/187237.31e-032.63e-0212
GO:00429212EsophagusESCCglucocorticoid receptor signaling pathway11/855214/187231.30e-024.27e-0211
GO:00713849EsophagusESCCcellular response to corticosteroid stimulus37/855261/187231.32e-024.31e-0237
GO:00485457LiverNAFLDresponse to steroid hormone75/1882339/187233.44e-111.12e-0875
GO:00713836LiverNAFLDcellular response to steroid hormone stimulus48/1882204/187231.50e-081.83e-0648
Page: 1 2 3 4 5 6 7 8 9 10 11 12 13 14 

check button Enriched KEGG pathways.
Pathway IDTissueDisease StageDescriptionGene RatioBg Ratiopvaluep.adjustqvalueCount
Page: 1 

Top

Cell-cell communication analysis

check buttonIdentification of potential cell-cell interactions between two cell types and their ligand-receptor pairs for different disease states
LigandReceptorLRpairPathwayTissueDisease Stage
Page: 1 

Top

Single-cell gene regulatory network inference analysis

check buttonFind out the significant the regulons (TFs) and the target genes of each regulon across cell types for different disease states
TFCell TypeTissueDisease StageTarget GeneRSSRegulon Activity
NR3C1ADIPOColorectumADJZC3HAV1,SLC7A5,PRKAR2B, etc.6.53e-02The dot plots of a searched regulon are shown for all cell subpopulations in each disease state of each tissue based on the regulon specific score inferred using pySCENIC and by calculating the average expression.
NR3C1PERIColorectumCRCZC3HAV1,SLC7A5,PRKAR2B, etc.1.60e-01The dot plots of a searched regulon are shown for all cell subpopulations in each disease state of each tissue based on the regulon specific score inferred using pySCENIC and by calculating the average expression.
NR3C1PERIColorectumFAPZC3HAV1,SLC7A5,PRKAR2B, etc.5.44e-02The dot plots of a searched regulon are shown for all cell subpopulations in each disease state of each tissue based on the regulon specific score inferred using pySCENIC and by calculating the average expression.
NR3C1CFIBColorectumHealthyZC3HAV1,SLC7A5,PRKAR2B, etc.2.12e-01The dot plots of a searched regulon are shown for all cell subpopulations in each disease state of each tissue based on the regulon specific score inferred using pySCENIC and by calculating the average expression.
NR3C1PERIColorectumHealthyZC3HAV1,SLC7A5,PRKAR2B, etc.6.84e-02The dot plots of a searched regulon are shown for all cell subpopulations in each disease state of each tissue based on the regulon specific score inferred using pySCENIC and by calculating the average expression.
NR3C1AT2LLungIACIRF4,IL3RA,SESN3, etc.4.90e-01The dot plots of a searched regulon are shown for all cell subpopulations in each disease state of each tissue based on the regulon specific score inferred using pySCENIC and by calculating the average expression.
NR3C1BASOral cavityLPCALCRL,RUNX3,LDLRAD4, etc.1.23e-01The dot plots of a searched regulon are shown for all cell subpopulations in each disease state of each tissue based on the regulon specific score inferred using pySCENIC and by calculating the average expression.
NR3C1PERIProstateBPHGPR183,RUBCN,SLC15A4, etc.3.57e-01The dot plots of a searched regulon are shown for all cell subpopulations in each disease state of each tissue based on the regulon specific score inferred using pySCENIC and by calculating the average expression.
NR3C1PERIProstateHealthyGPR183,RUBCN,SLC15A4, etc.2.40e-01The dot plots of a searched regulon are shown for all cell subpopulations in each disease state of each tissue based on the regulon specific score inferred using pySCENIC and by calculating the average expression.
∗The dot plots of a searched regulon are shown for all cell subpopulations in each disease state of each tissue based on the regulon specific score inferred using pySCENIC and by calculating the average expression.
Page: 1 

Top

Somatic mutation of malignant transformation related genes

check buttonAnnotation of somatic variants for genes involved in malignant transformation
Hugo SymbolVariant ClassVariant ClassificationdbSNP RSHGVScHGVSpHGVSp ShortSWISSPROTBIOTYPESIFTPolyPhenTumor Sample BarcodeTissueHistologySexAgeStageTherapy TypesDrugsOutcome
NR3C1SNVMissense_Mutationc.251N>Gp.Leu84Argp.L84RP04150protein_codingdeleterious_low_confidence(0.02)probably_damaging(1)TCGA-BH-A1F8-01Breastbreast invasive carcinomaFemale>=65III/IVUnknownUnknownPD
NR3C1SNVMissense_Mutationc.905G>Tp.Cys302Phep.C302FP04150protein_codingdeleterious(0.01)probably_damaging(0.999)TCGA-D8-A1XK-01Breastbreast invasive carcinomaFemale<65I/IIChemotherapydoxorubicine+cyclophosphamideSD
NR3C1SNVMissense_Mutationrs761295829c.1688N>Tp.Thr563Metp.T563MP04150protein_codingdeleterious(0)possibly_damaging(0.897)TCGA-E2-A1LB-01Breastbreast invasive carcinomaFemale<65I/IIChemotherapycytoxanSD
NR3C1insertionIn_Frame_Insnovelc.709_710insATATCCATTTTAGTTGTGAAGGAAAATATAAAAATGp.Leu237delinsTyrIleHisPheSerCysGluGlyLysTyrLysAsnValp.L237delinsYIHFSCEGKYKNVP04150protein_codingTCGA-BH-A0HK-01Breastbreast invasive carcinomaFemale>=65I/IIHormone TherapyarimidexSD
NR3C1SNVMissense_Mutationc.574G>Cp.Asp192Hisp.D192HP04150protein_codingdeleterious(0)probably_damaging(1)TCGA-EK-A2RJ-01Cervixcervical & endocervical cancerFemale<65I/IIUnknownUnknownSD
NR3C1SNVMissense_Mutationrs756635644c.341N>Tp.Ser114Leup.S114LP04150protein_codingtolerated_low_confidence(0.78)possibly_damaging(0.664)TCGA-IR-A3LH-01Cervixcervical & endocervical cancerFemale<65I/IIChemotherapycisplatinCR
NR3C1SNVMissense_Mutationc.248N>Tp.Ser83Leup.S83LP04150protein_codingdeleterious_low_confidence(0.03)probably_damaging(0.998)TCGA-IR-A3LH-01Cervixcervical & endocervical cancerFemale<65I/IIChemotherapycisplatinCR
NR3C1SNVMissense_Mutationc.157N>Gp.Gln53Glup.Q53EP04150protein_codingtolerated_low_confidence(0.17)benign(0.006)TCGA-LP-A4AV-01Cervixcervical & endocervical cancerFemale<65I/IIUnknownUnknownSD
NR3C1SNVMissense_Mutationnovelc.179N>Cp.Arg60Thrp.R60TP04150protein_codingtolerated_low_confidence(0.22)benign(0.003)TCGA-VS-A954-01Cervixcervical & endocervical cancerFemale>=65III/IVChemotherapycisplatinCR
NR3C1SNVMissense_Mutationrs750359967c.1031A>Gp.Gln344Argp.Q344RP04150protein_codingtolerated(0.08)benign(0.353)TCGA-A6-6781-01Colorectumcolon adenocarcinomaMale<65III/IVChemotherapyoxaliplatinSD
Page: 1 2 3 4 5 6 7 8 9 

Top

Related drugs of malignant transformation related genes

check buttonIdentification of chemicals and drugs interact with genes involved in malignant transfromation
(DGIdb 4.0)
Entrez IDSymbolCategoryInteraction TypesDrug Claim NameDrug NamePMIDs
2908NR3C1DRUGGABLE GENOME, NUCLEAR HORMONE RECEPTOR, ENZYME, TRANSCRIPTION FACTORMifepristoneMIFEPRISTONE
2908NR3C1DRUGGABLE GENOME, NUCLEAR HORMONE RECEPTOR, ENZYME, TRANSCRIPTION FACTORBUDESONIDEBUDESONIDE
2908NR3C1DRUGGABLE GENOME, NUCLEAR HORMONE RECEPTOR, ENZYME, TRANSCRIPTION FACTORagonistCHEMBL1200376BETAMETHASONE BENZOATE
2908NR3C1DRUGGABLE GENOME, NUCLEAR HORMONE RECEPTOR, ENZYME, TRANSCRIPTION FACTORORG 34517/34850
2908NR3C1DRUGGABLE GENOME, NUCLEAR HORMONE RECEPTOR, ENZYME, TRANSCRIPTION FACTORagonist178103646DESOXIMETASONE
2908NR3C1DRUGGABLE GENOME, NUCLEAR HORMONE RECEPTOR, ENZYME, TRANSCRIPTION FACTORagonistCHEMBL1200844METHYLPREDNISOLONE ACETATE
2908NR3C1DRUGGABLE GENOME, NUCLEAR HORMONE RECEPTOR, ENZYME, TRANSCRIPTION FACTORTPI-1020
2908NR3C1DRUGGABLE GENOME, NUCLEAR HORMONE RECEPTOR, ENZYME, TRANSCRIPTION FACTORCHRYSINCHRYSIN19592245
2908NR3C1DRUGGABLE GENOME, NUCLEAR HORMONE RECEPTOR, ENZYME, TRANSCRIPTION FACTORHYDROCORTAMATEHYDROCORTAMATE
2908NR3C1DRUGGABLE GENOME, NUCLEAR HORMONE RECEPTOR, ENZYME, TRANSCRIPTION FACTORE-GUGGULSTERONEE-GUGGULSTERONE
Page: 1 2 3 4 5 6 7 8 9 10 11 12 13 14 15 16 17 18 19 20 21 22 23 24 25 26 27