
|
|||||
|
 | |
| |
| |
| |
| |
| |
|
Gene: NR2F6 |
Gene summary for NR2F6 |
| Gene information | Species | Human | Gene symbol | NR2F6 | Gene ID | 2063 |
| Gene name | nuclear receptor subfamily 2 group F member 6 | |
| Gene Alias | EAR-2 | |
| Cytomap | 19p13.11 | |
| Gene Type | protein-coding | GO ID | GO:0000122 | UniProtAcc | F1D8R3 |
Top |
Malignant transformation analysis |
| Identification of the aberrant gene expression in precancerous and cancerous lesions by comparing the gene expression of stem-like cells in diseased tissues with normal stem cells |
| Entrez ID | Symbol | Replicates | Species | Organ | Tissue | Adj P-value | Log2FC | Malignancy |
| 2063 | NR2F6 | GSM4909290 | Human | Breast | IDC | 2.20e-02 | 2.54e-01 | 0.2096 |
| 2063 | NR2F6 | GSM4909291 | Human | Breast | IDC | 3.78e-03 | 3.29e-01 | 0.1753 |
| 2063 | NR2F6 | GSM4909293 | Human | Breast | IDC | 7.58e-19 | 4.38e-01 | 0.1581 |
| 2063 | NR2F6 | GSM4909298 | Human | Breast | IDC | 5.78e-15 | 3.94e-01 | 0.1551 |
| 2063 | NR2F6 | GSM4909301 | Human | Breast | IDC | 1.36e-03 | 2.93e-01 | 0.1577 |
| 2063 | NR2F6 | GSM4909304 | Human | Breast | IDC | 1.22e-25 | 5.47e-01 | 0.1636 |
| 2063 | NR2F6 | GSM4909311 | Human | Breast | IDC | 5.00e-09 | -3.26e-02 | 0.1534 |
| 2063 | NR2F6 | GSM4909317 | Human | Breast | IDC | 7.40e-05 | 2.94e-01 | 0.1355 |
| 2063 | NR2F6 | GSM4909319 | Human | Breast | IDC | 4.34e-13 | 2.58e-02 | 0.1563 |
| 2063 | NR2F6 | GSM4909320 | Human | Breast | IDC | 1.45e-09 | 5.35e-01 | 0.1575 |
| 2063 | NR2F6 | GSM4909321 | Human | Breast | IDC | 3.28e-30 | 7.20e-01 | 0.1559 |
| 2063 | NR2F6 | M1 | Human | Breast | IDC | 5.19e-17 | 6.08e-01 | 0.1577 |
| 2063 | NR2F6 | NCCBC14 | Human | Breast | DCIS | 3.11e-04 | 2.99e-01 | 0.2021 |
| 2063 | NR2F6 | P1 | Human | Breast | IDC | 3.46e-08 | 2.72e-01 | 0.1527 |
| 2063 | NR2F6 | DCIS2 | Human | Breast | DCIS | 2.69e-52 | 2.18e-01 | 0.0085 |
| 2063 | NR2F6 | HTA11_2487_2000001011 | Human | Colorectum | SER | 3.21e-05 | 5.58e-01 | -0.1808 |
| 2063 | NR2F6 | HTA11_1938_2000001011 | Human | Colorectum | AD | 1.45e-02 | 2.07e-01 | -0.0811 |
| 2063 | NR2F6 | HTA11_78_2000001011 | Human | Colorectum | AD | 4.85e-04 | 3.82e-01 | -0.1088 |
| 2063 | NR2F6 | HTA11_347_2000001011 | Human | Colorectum | AD | 1.99e-17 | 5.34e-01 | -0.1954 |
| 2063 | NR2F6 | HTA11_411_2000001011 | Human | Colorectum | SER | 2.96e-03 | 8.43e-01 | -0.2602 |
| Page: 1 2 3 4 5 6 7 |
| Tissue | Expression Dynamics | Abbreviation |
| Breast | 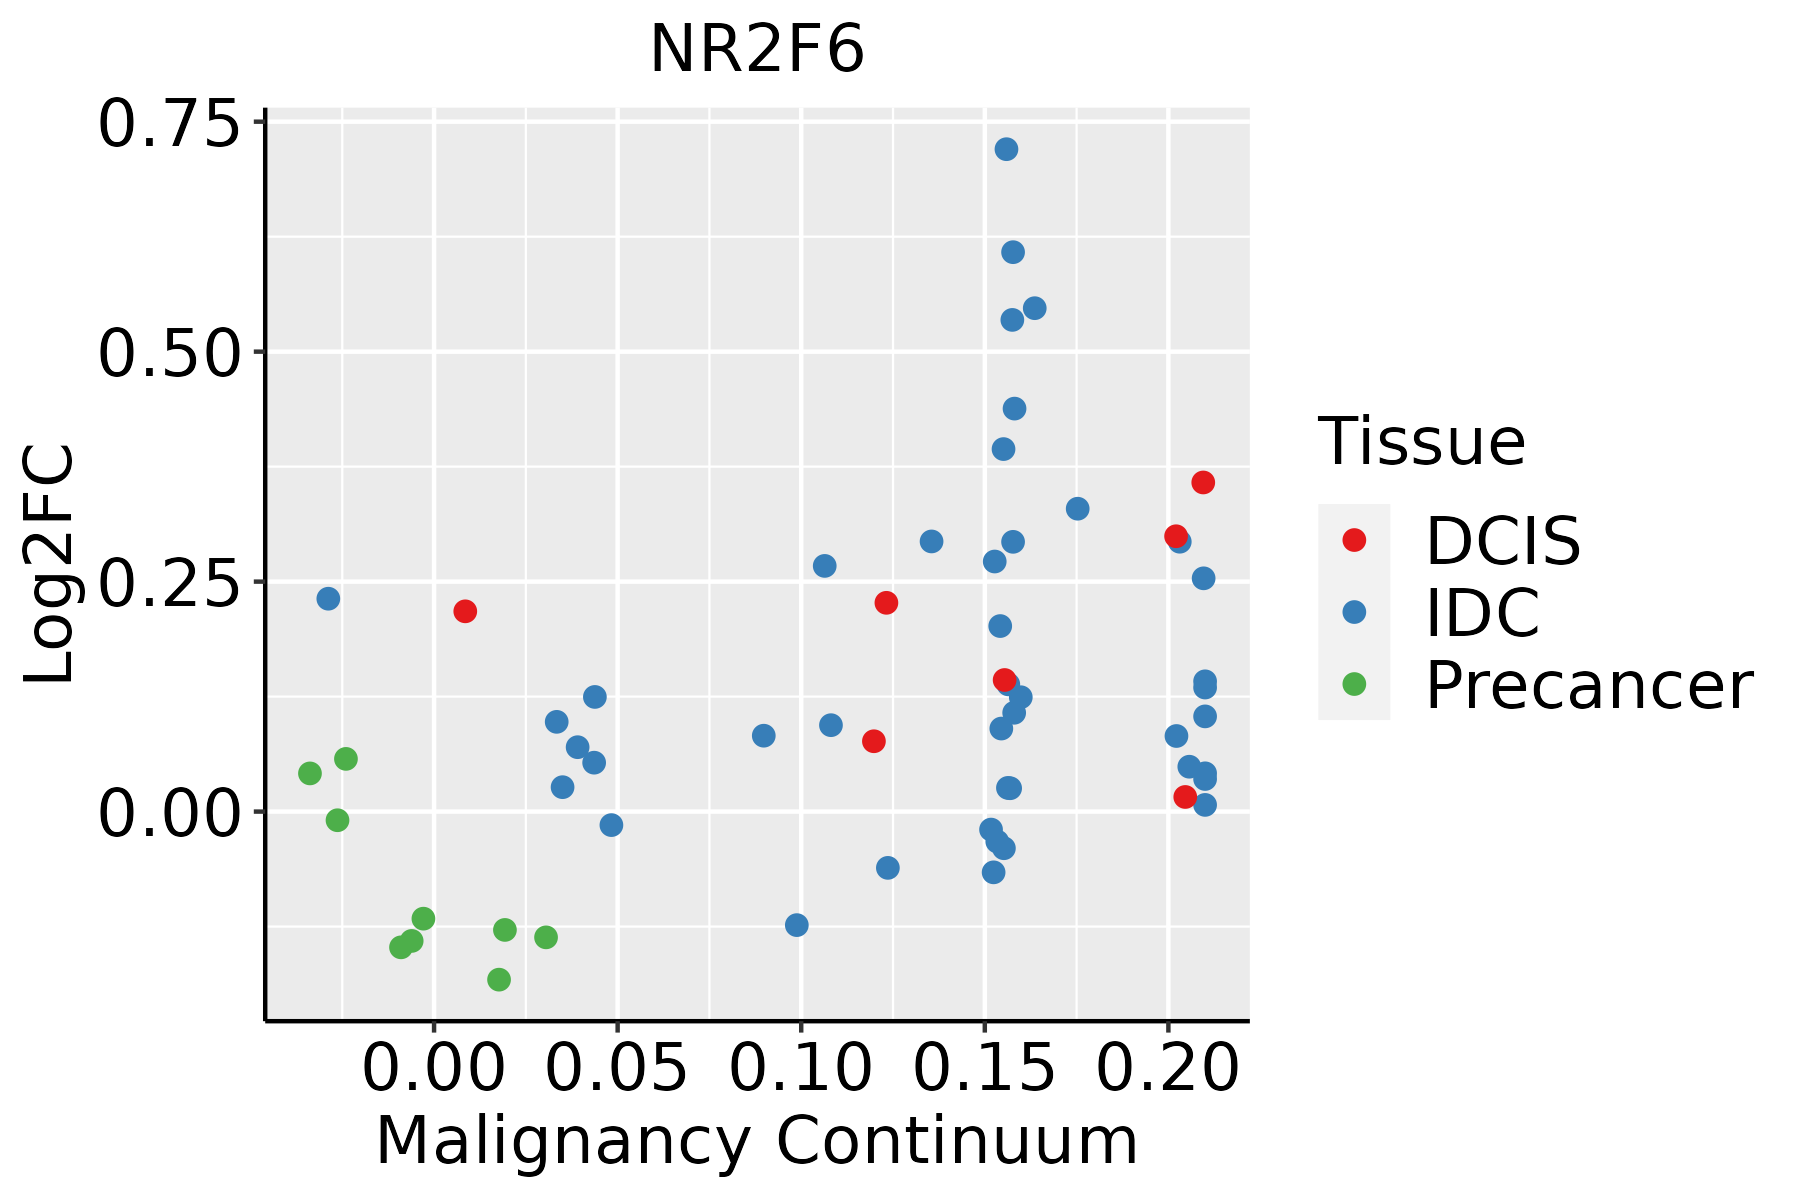 | IDC: Invasive ductal carcinoma |
| DCIS: Ductal carcinoma in situ | ||
| Precancer(BRCA1-mut): Precancerous lesion from BRCA1 mutation carriers | ||
| Colorectum (GSE201348) |  | FAP: Familial adenomatous polyposis |
| CRC: Colorectal cancer | ||
| Colorectum (HTA11) |  | AD: Adenomas |
| SER: Sessile serrated lesions | ||
| MSI-H: Microsatellite-high colorectal cancer | ||
| MSS: Microsatellite stable colorectal cancer | ||
| Esophagus | 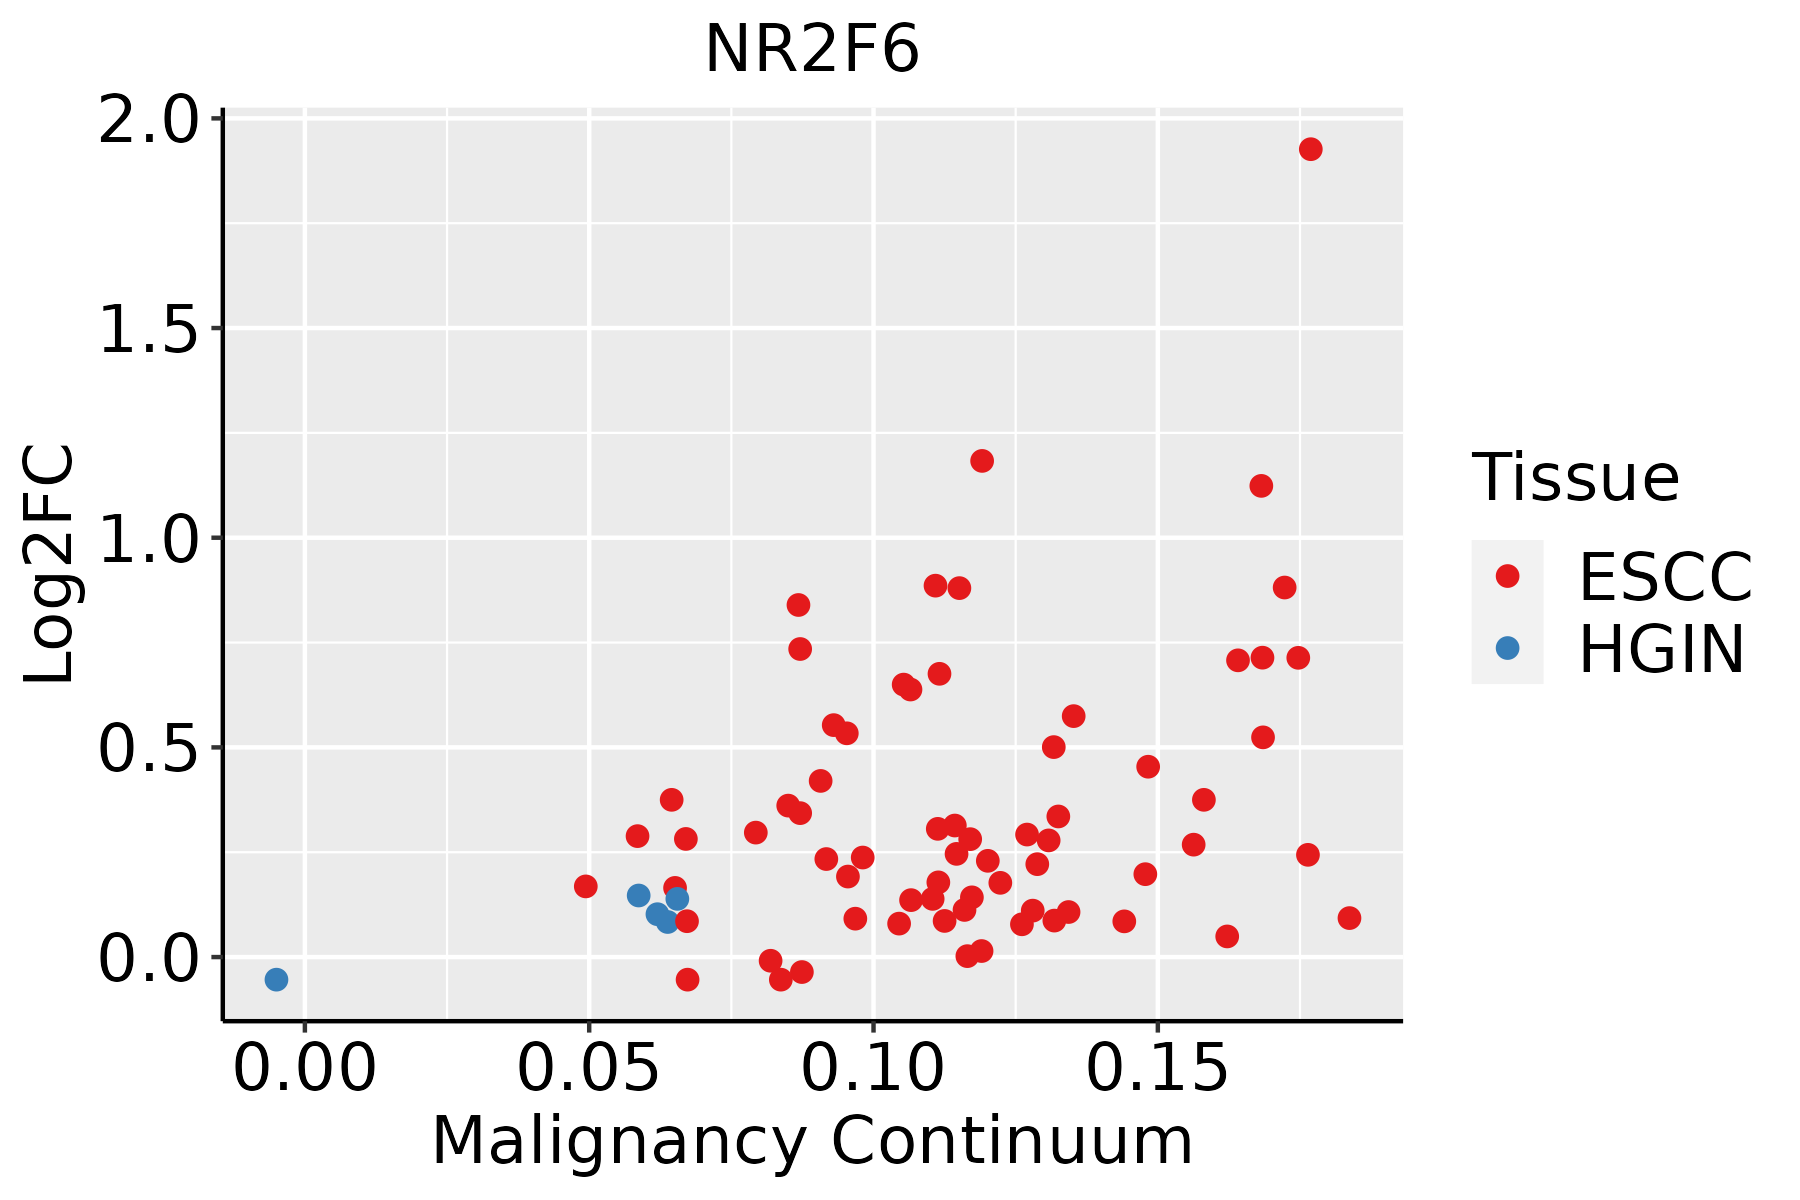 | ESCC: Esophageal squamous cell carcinoma |
| HGIN: High-grade intraepithelial neoplasias | ||
| LGIN: Low-grade intraepithelial neoplasias | ||
| Liver |  | HCC: Hepatocellular carcinoma |
| NAFLD: Non-alcoholic fatty liver disease | ||
| Oral Cavity | 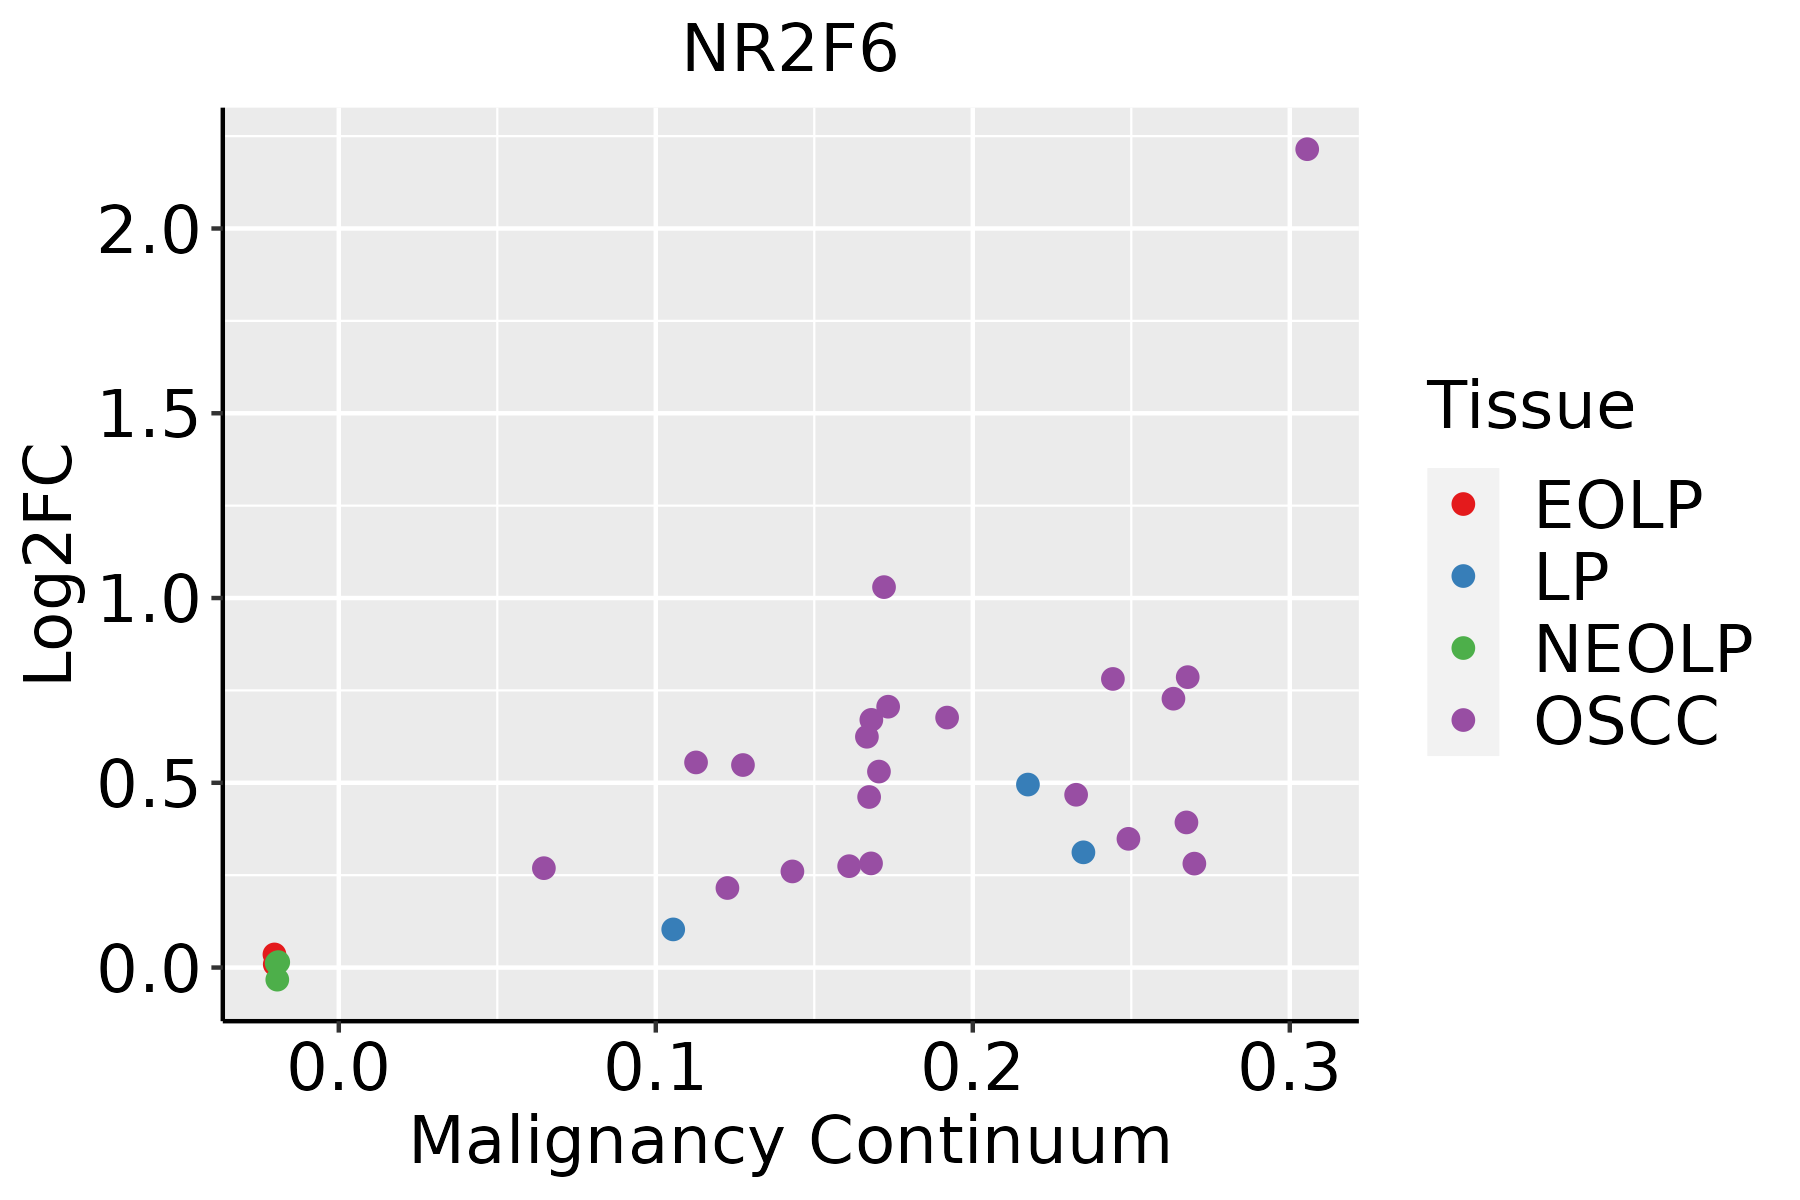 | EOLP: Erosive Oral lichen planus |
| LP: leukoplakia | ||
| NEOLP: Non-erosive oral lichen planus | ||
| OSCC: Oral squamous cell carcinoma | ||
| Thyroid | 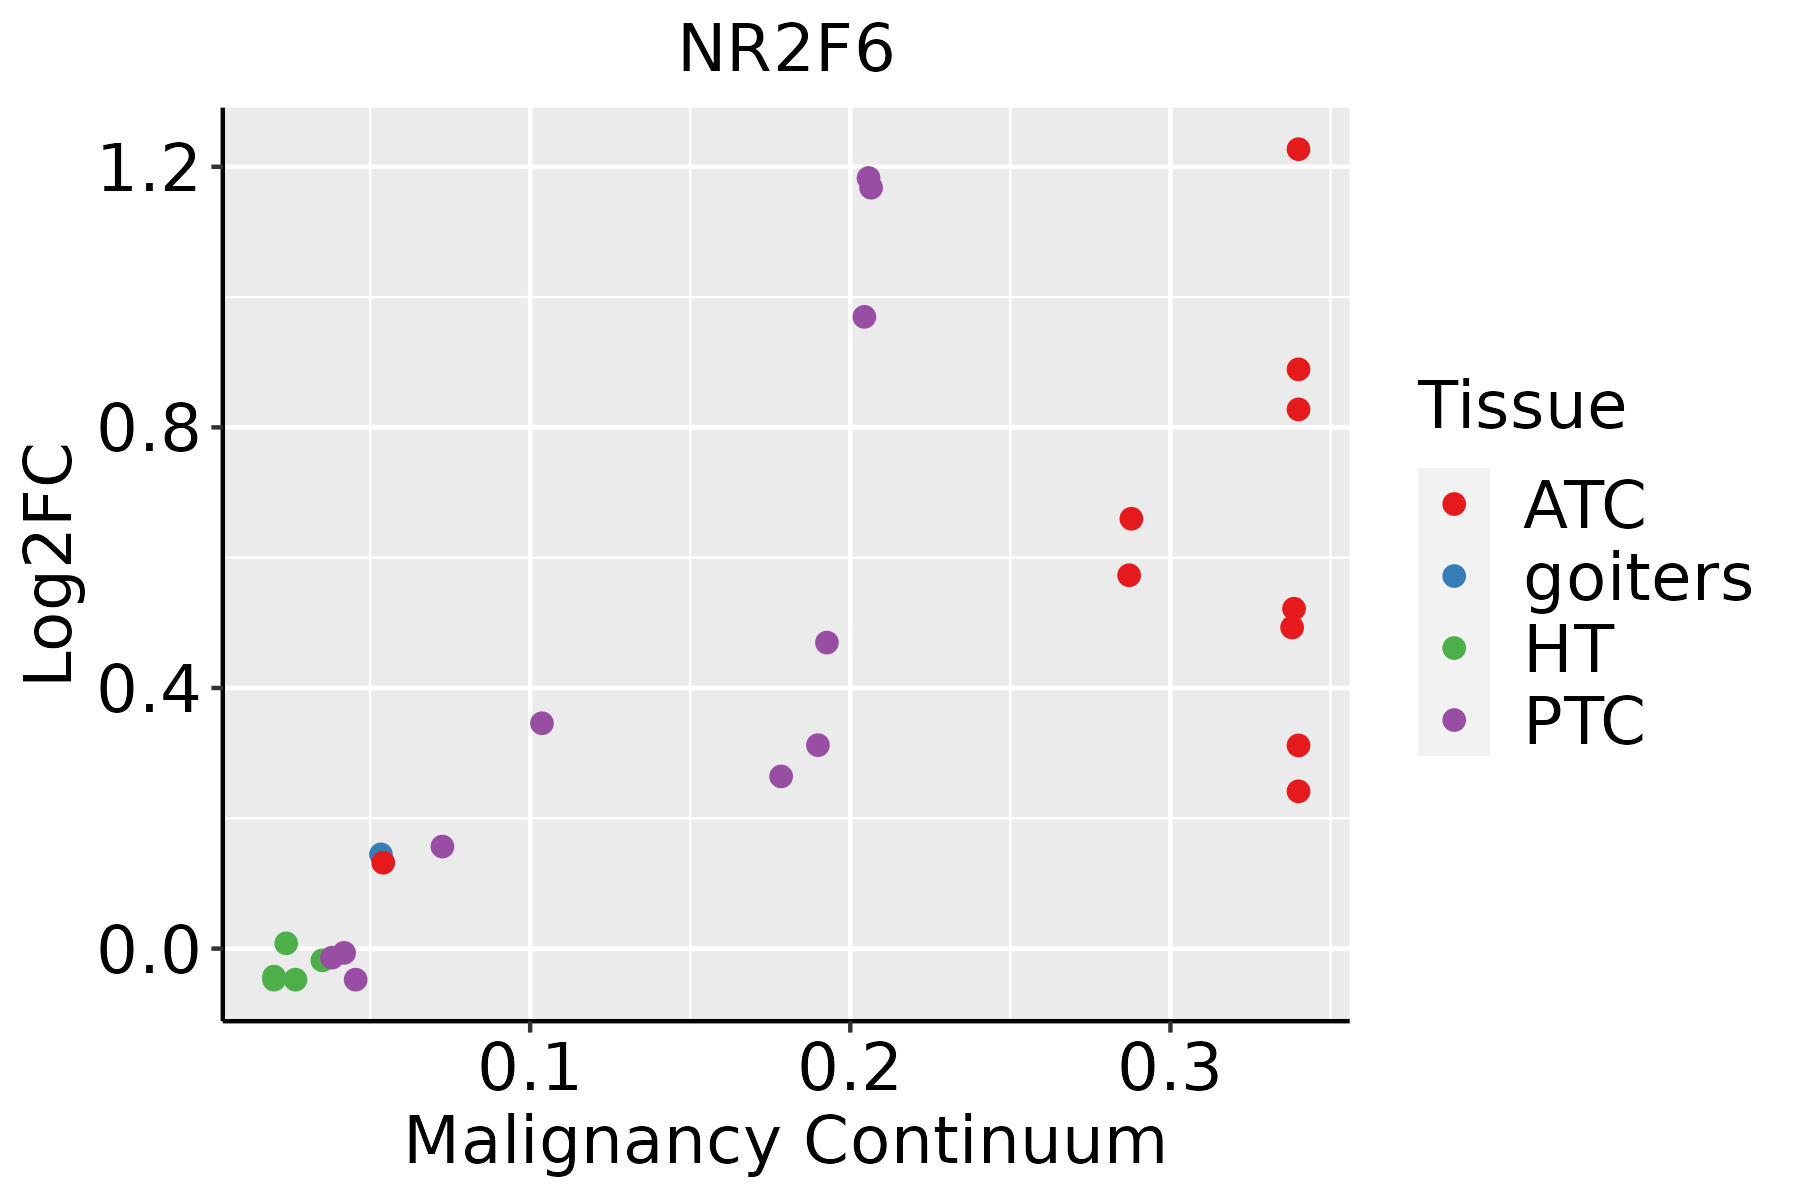 | ATC: Anaplastic thyroid cancer |
| HT: Hashimoto's thyroiditis | ||
| PTC: Papillary thyroid cancer |
| ∗log2FC in expression of this searched gene in stem-like cells from each diseased tissue sample relative to stem-like cells in normal samples in each tissue plotted against the malignancy continuum. Samples are colored based on if they are from different disease stage. |
Top |
Malignant transformation related pathway analysis |
| Find out the enriched GO biological processes and KEGG pathways involved in transition from healthy to precancer to cancer |
| Tissue | Disease Stage | Enriched GO biological Processes |
| Colorectum | AD |  |
| Colorectum | SER |  |
| Colorectum | MSS |  |
| Colorectum | MSI-H |  |
| Colorectum | FAP |  |
| ∗Top 15 enriched GO BP terms are showed in the bar plot of each disease state in each tissue. Each row represents a significant GO biological process which is colored according to the -log10(p.adjust). |
| Page: 1 2 3 4 5 6 7 8 9 |
| GO ID | Tissue | Disease Stage | Description | Gene Ratio | Bg Ratio | pvalue | p.adjust | Count |
| GO:000926612 | Breast | IDC | response to temperature stimulus | 34/1434 | 178/18723 | 5.88e-07 | 2.83e-05 | 34 |
| GO:000931412 | Breast | IDC | response to radiation | 62/1434 | 456/18723 | 6.91e-06 | 2.10e-04 | 62 |
| GO:003052214 | Breast | IDC | intracellular receptor signaling pathway | 37/1434 | 265/18723 | 2.77e-04 | 4.26e-03 | 37 |
| GO:00485117 | Breast | IDC | rhythmic process | 38/1434 | 298/18723 | 1.34e-03 | 1.39e-02 | 38 |
| GO:000931422 | Breast | DCIS | response to radiation | 62/1390 | 456/18723 | 2.56e-06 | 8.87e-05 | 62 |
| GO:000926621 | Breast | DCIS | response to temperature stimulus | 30/1390 | 178/18723 | 1.91e-05 | 4.56e-04 | 30 |
| GO:003052224 | Breast | DCIS | intracellular receptor signaling pathway | 35/1390 | 265/18723 | 6.38e-04 | 7.92e-03 | 35 |
| GO:004851113 | Breast | DCIS | rhythmic process | 37/1390 | 298/18723 | 1.44e-03 | 1.47e-02 | 37 |
| GO:0030522 | Colorectum | AD | intracellular receptor signaling pathway | 87/3918 | 265/18723 | 3.69e-06 | 1.03e-04 | 87 |
| GO:0007623 | Colorectum | AD | circadian rhythm | 72/3918 | 210/18723 | 4.50e-06 | 1.21e-04 | 72 |
| GO:0048511 | Colorectum | AD | rhythmic process | 94/3918 | 298/18723 | 1.00e-05 | 2.34e-04 | 94 |
| GO:0042752 | Colorectum | AD | regulation of circadian rhythm | 40/3918 | 121/18723 | 1.24e-03 | 1.09e-02 | 40 |
| GO:00076231 | Colorectum | SER | circadian rhythm | 54/2897 | 210/18723 | 7.98e-05 | 1.77e-03 | 54 |
| GO:00305221 | Colorectum | SER | intracellular receptor signaling pathway | 63/2897 | 265/18723 | 2.47e-04 | 4.20e-03 | 63 |
| GO:00485111 | Colorectum | SER | rhythmic process | 65/2897 | 298/18723 | 2.18e-03 | 2.11e-02 | 65 |
| GO:00427521 | Colorectum | SER | regulation of circadian rhythm | 30/2897 | 121/18723 | 5.03e-03 | 3.88e-02 | 30 |
| GO:00305222 | Colorectum | MSS | intracellular receptor signaling pathway | 84/3467 | 265/18723 | 1.47e-07 | 6.79e-06 | 84 |
| GO:00076232 | Colorectum | MSS | circadian rhythm | 69/3467 | 210/18723 | 4.22e-07 | 1.67e-05 | 69 |
| GO:00485112 | Colorectum | MSS | rhythmic process | 89/3467 | 298/18723 | 1.17e-06 | 3.96e-05 | 89 |
| GO:00427522 | Colorectum | MSS | regulation of circadian rhythm | 38/3467 | 121/18723 | 4.33e-04 | 5.23e-03 | 38 |
| Page: 1 2 3 4 |
| Pathway ID | Tissue | Disease Stage | Description | Gene Ratio | Bg Ratio | pvalue | p.adjust | qvalue | Count |
| Page: 1 |
Top |
Cell-cell communication analysis |
| Identification of potential cell-cell interactions between two cell types and their ligand-receptor pairs for different disease states |
| Ligand | Receptor | LRpair | Pathway | Tissue | Disease Stage |
| Page: 1 |
Top |
Single-cell gene regulatory network inference analysis |
| Find out the significant the regulons (TFs) and the target genes of each regulon across cell types for different disease states |
| TF | Cell Type | Tissue | Disease Stage | Target Gene | RSS | Regulon Activity |
| NR2F6 | STM | Breast | IDC | C19orf70,RPS4Y1,NDUFA13, etc. | 2.12e-01 |  |
| NR2F6 | CD8TRM | Cervix | HSIL_HPV | TRGV10,IFNG,KRT16, etc. | 1.24e-01 |  |
| NR2F6 | CD8TEXP | Colorectum | CRC | HSD17B2,DHRS9,CKB, etc. | 3.36e-01 |  |
| NR2F6 | CD8TEXP | Colorectum | MSS | HSD17B2,DHRS9,CKB, etc. | 2.02e-01 |  |
| NR2F6 | CD8TEXP | Colorectum | SER | HSD17B2,DHRS9,CKB, etc. | 1.63e-01 |  |
| NR2F6 | PLA | Liver | NAFLD | S1PR1,CX3CR1,PDDC1, etc. | 3.31e-01 |  |
| NR2F6 | AT1 | Lung | IAC | SCNN1A,CRIP2,RPS11, etc. | 8.71e-02 |  |
| NR2F6 | ACINAR | Pancreas | Healthy | TSC22D3,AIFM1,TMED9, etc. | 3.25e-01 |  |
| NR2F6 | SMC | Pancreas | PDAC | SUFU,CPB1,CTRB2, etc. | 5.52e-02 |  |
| NR2F6 | DIF | Skin | cSCC | DSC2,DHCR24,SBSN, etc. | 4.14e-01 |  |
| ∗The dot plots of a searched regulon are shown for all cell subpopulations in each disease state of each tissue based on the regulon specific score inferred using pySCENIC and by calculating the average expression. |
| Page: 1 2 |
Top |
Somatic mutation of malignant transformation related genes |
| Annotation of somatic variants for genes involved in malignant transformation |
| Hugo Symbol | Variant Class | Variant Classification | dbSNP RS | HGVSc | HGVSp | HGVSp Short | SWISSPROT | BIOTYPE | SIFT | PolyPhen | Tumor Sample Barcode | Tissue | Histology | Sex | Age | Stage | Therapy Types | Drugs | Outcome |
| NR2F6 | SNV | Missense_Mutation | novel | c.98C>T | p.Ala33Val | p.A33V | P10588 | protein_coding | deleterious(0.04) | benign(0.143) | TCGA-AO-A128-01 | Breast | breast invasive carcinoma | Female | <65 | I/II | Chemotherapy | doxorubicin | SD |
| NR2F6 | SNV | Missense_Mutation | novel | c.1102A>G | p.Ile368Val | p.I368V | P10588 | protein_coding | tolerated(0.08) | probably_damaging(0.956) | TCGA-5M-AAT6-01 | Colorectum | colon adenocarcinoma | Female | <65 | III/IV | Unknown | Unknown | PD |
| NR2F6 | SNV | Missense_Mutation | rs761684813 | c.943G>A | p.Ala315Thr | p.A315T | P10588 | protein_coding | tolerated(0.25) | probably_damaging(0.996) | TCGA-AA-A01P-01 | Colorectum | colon adenocarcinoma | Female | >=65 | III/IV | Unknown | Unknown | PD |
| NR2F6 | SNV | Missense_Mutation | novel | c.923T>A | p.Ile308Asn | p.I308N | P10588 | protein_coding | deleterious(0) | possibly_damaging(0.879) | TCGA-AD-6895-01 | Colorectum | colon adenocarcinoma | Male | >=65 | III/IV | Unknown | Unknown | SD |
| NR2F6 | SNV | Missense_Mutation | c.181N>A | p.Asp61Asn | p.D61N | P10588 | protein_coding | deleterious(0) | probably_damaging(0.998) | TCGA-AD-6964-01 | Colorectum | colon adenocarcinoma | Male | <65 | III/IV | Chemotherapy | folfox | PD | |
| NR2F6 | SNV | Missense_Mutation | novel | c.149C>A | p.Pro50Gln | p.P50Q | P10588 | protein_coding | tolerated(0.25) | benign(0.006) | TCGA-AM-5820-01 | Colorectum | colon adenocarcinoma | Female | <65 | I/II | Unknown | Unknown | SD |
| NR2F6 | SNV | Missense_Mutation | c.1149N>T | p.Glu383Asp | p.E383D | P10588 | protein_coding | deleterious(0.03) | probably_damaging(0.989) | TCGA-AG-A002-01 | Colorectum | rectum adenocarcinoma | Male | <65 | I/II | Unknown | Unknown | SD | |
| NR2F6 | SNV | Missense_Mutation | novel | c.345N>T | p.Lys115Asn | p.K115N | P10588 | protein_coding | deleterious(0) | probably_damaging(0.998) | TCGA-A5-A1OF-01 | Endometrium | uterine corpus endometrioid carcinoma | Female | <65 | I/II | Unknown | Unknown | SD |
| NR2F6 | SNV | Missense_Mutation | c.1123C>T | p.Arg375Cys | p.R375C | P10588 | protein_coding | deleterious(0) | probably_damaging(0.998) | TCGA-AP-A0LM-01 | Endometrium | uterine corpus endometrioid carcinoma | Female | <65 | III/IV | Chemotherapy | cisplatin | SD | |
| NR2F6 | SNV | Missense_Mutation | novel | c.987N>T | p.Glu329Asp | p.E329D | P10588 | protein_coding | tolerated(0.33) | possibly_damaging(0.891) | TCGA-AX-A2HC-01 | Endometrium | uterine corpus endometrioid carcinoma | Female | <65 | III/IV | Chemotherapy | paclitaxel | PD |
| Page: 1 2 3 |
Top |
Related drugs of malignant transformation related genes |
| Identification of chemicals and drugs interact with genes involved in malignant transfromation |
| (DGIdb 4.0) |
| Entrez ID | Symbol | Category | Interaction Types | Drug Claim Name | Drug Name | PMIDs |
| Page: 1 |

Copyright 2023-Present -The University of Texas Health Science Center at Houston |