
|
|||||
|
 | |
| |
| |
| |
| |
| |
|
Gene: NR2C1 |
Gene summary for NR2C1 |
| Gene information | Species | Human | Gene symbol | NR2C1 | Gene ID | 7181 |
| Gene name | nuclear receptor subfamily 2 group C member 1 | |
| Gene Alias | TR2 | |
| Cytomap | 12q22 | |
| Gene Type | protein-coding | GO ID | GO:0000122 | UniProtAcc | H9NIM3 |
Top |
Malignant transformation analysis |
| Identification of the aberrant gene expression in precancerous and cancerous lesions by comparing the gene expression of stem-like cells in diseased tissues with normal stem cells |
| Entrez ID | Symbol | Replicates | Species | Organ | Tissue | Adj P-value | Log2FC | Malignancy |
| 7181 | NR2C1 | LZE4T | Human | Esophagus | ESCC | 4.47e-03 | 7.36e-02 | 0.0811 |
| 7181 | NR2C1 | LZE7T | Human | Esophagus | ESCC | 1.13e-07 | 3.88e-01 | 0.0667 |
| 7181 | NR2C1 | LZE20T | Human | Esophagus | ESCC | 1.87e-02 | 1.18e-01 | 0.0662 |
| 7181 | NR2C1 | LZE24T | Human | Esophagus | ESCC | 3.92e-19 | 3.40e-01 | 0.0596 |
| 7181 | NR2C1 | LZE6T | Human | Esophagus | ESCC | 1.56e-04 | 1.46e-01 | 0.0845 |
| 7181 | NR2C1 | P1T-E | Human | Esophagus | ESCC | 4.06e-02 | 1.46e-01 | 0.0875 |
| 7181 | NR2C1 | P2T-E | Human | Esophagus | ESCC | 2.74e-13 | 2.50e-01 | 0.1177 |
| 7181 | NR2C1 | P4T-E | Human | Esophagus | ESCC | 5.57e-22 | 3.23e-01 | 0.1323 |
| 7181 | NR2C1 | P5T-E | Human | Esophagus | ESCC | 1.56e-08 | 1.33e-01 | 0.1327 |
| 7181 | NR2C1 | P8T-E | Human | Esophagus | ESCC | 9.92e-21 | 2.85e-01 | 0.0889 |
| 7181 | NR2C1 | P9T-E | Human | Esophagus | ESCC | 2.08e-02 | 2.94e-02 | 0.1131 |
| 7181 | NR2C1 | P10T-E | Human | Esophagus | ESCC | 1.43e-15 | 2.05e-01 | 0.116 |
| 7181 | NR2C1 | P11T-E | Human | Esophagus | ESCC | 1.24e-05 | 1.50e-01 | 0.1426 |
| 7181 | NR2C1 | P12T-E | Human | Esophagus | ESCC | 7.60e-18 | 1.82e-01 | 0.1122 |
| 7181 | NR2C1 | P15T-E | Human | Esophagus | ESCC | 2.91e-09 | 8.28e-02 | 0.1149 |
| 7181 | NR2C1 | P16T-E | Human | Esophagus | ESCC | 2.89e-13 | 1.76e-01 | 0.1153 |
| 7181 | NR2C1 | P17T-E | Human | Esophagus | ESCC | 3.80e-02 | 9.99e-02 | 0.1278 |
| 7181 | NR2C1 | P20T-E | Human | Esophagus | ESCC | 9.27e-19 | 1.75e-01 | 0.1124 |
| 7181 | NR2C1 | P21T-E | Human | Esophagus | ESCC | 1.67e-09 | 1.57e-01 | 0.1617 |
| 7181 | NR2C1 | P22T-E | Human | Esophagus | ESCC | 1.72e-07 | 1.24e-01 | 0.1236 |
| Page: 1 2 3 4 5 |
| Tissue | Expression Dynamics | Abbreviation |
| Esophagus | 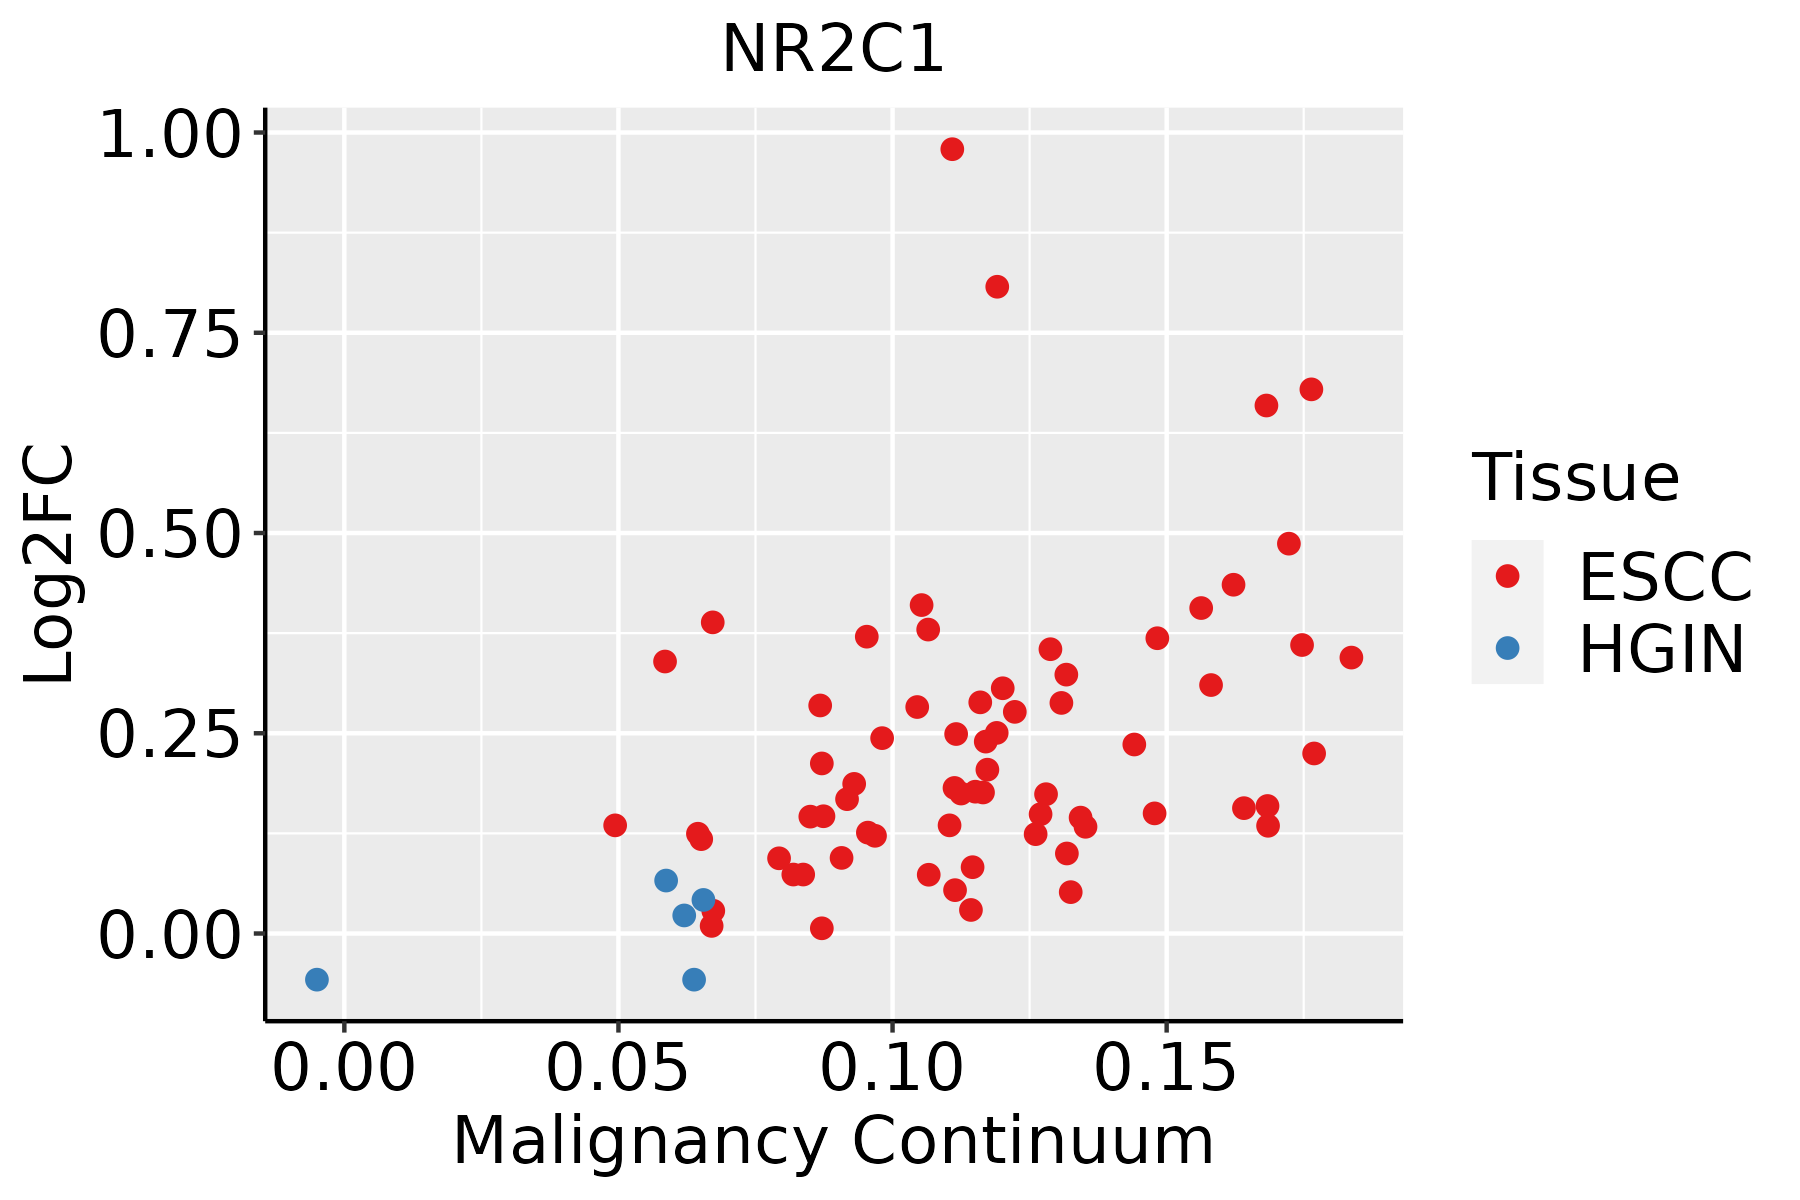 | ESCC: Esophageal squamous cell carcinoma |
| HGIN: High-grade intraepithelial neoplasias | ||
| LGIN: Low-grade intraepithelial neoplasias | ||
| Liver | 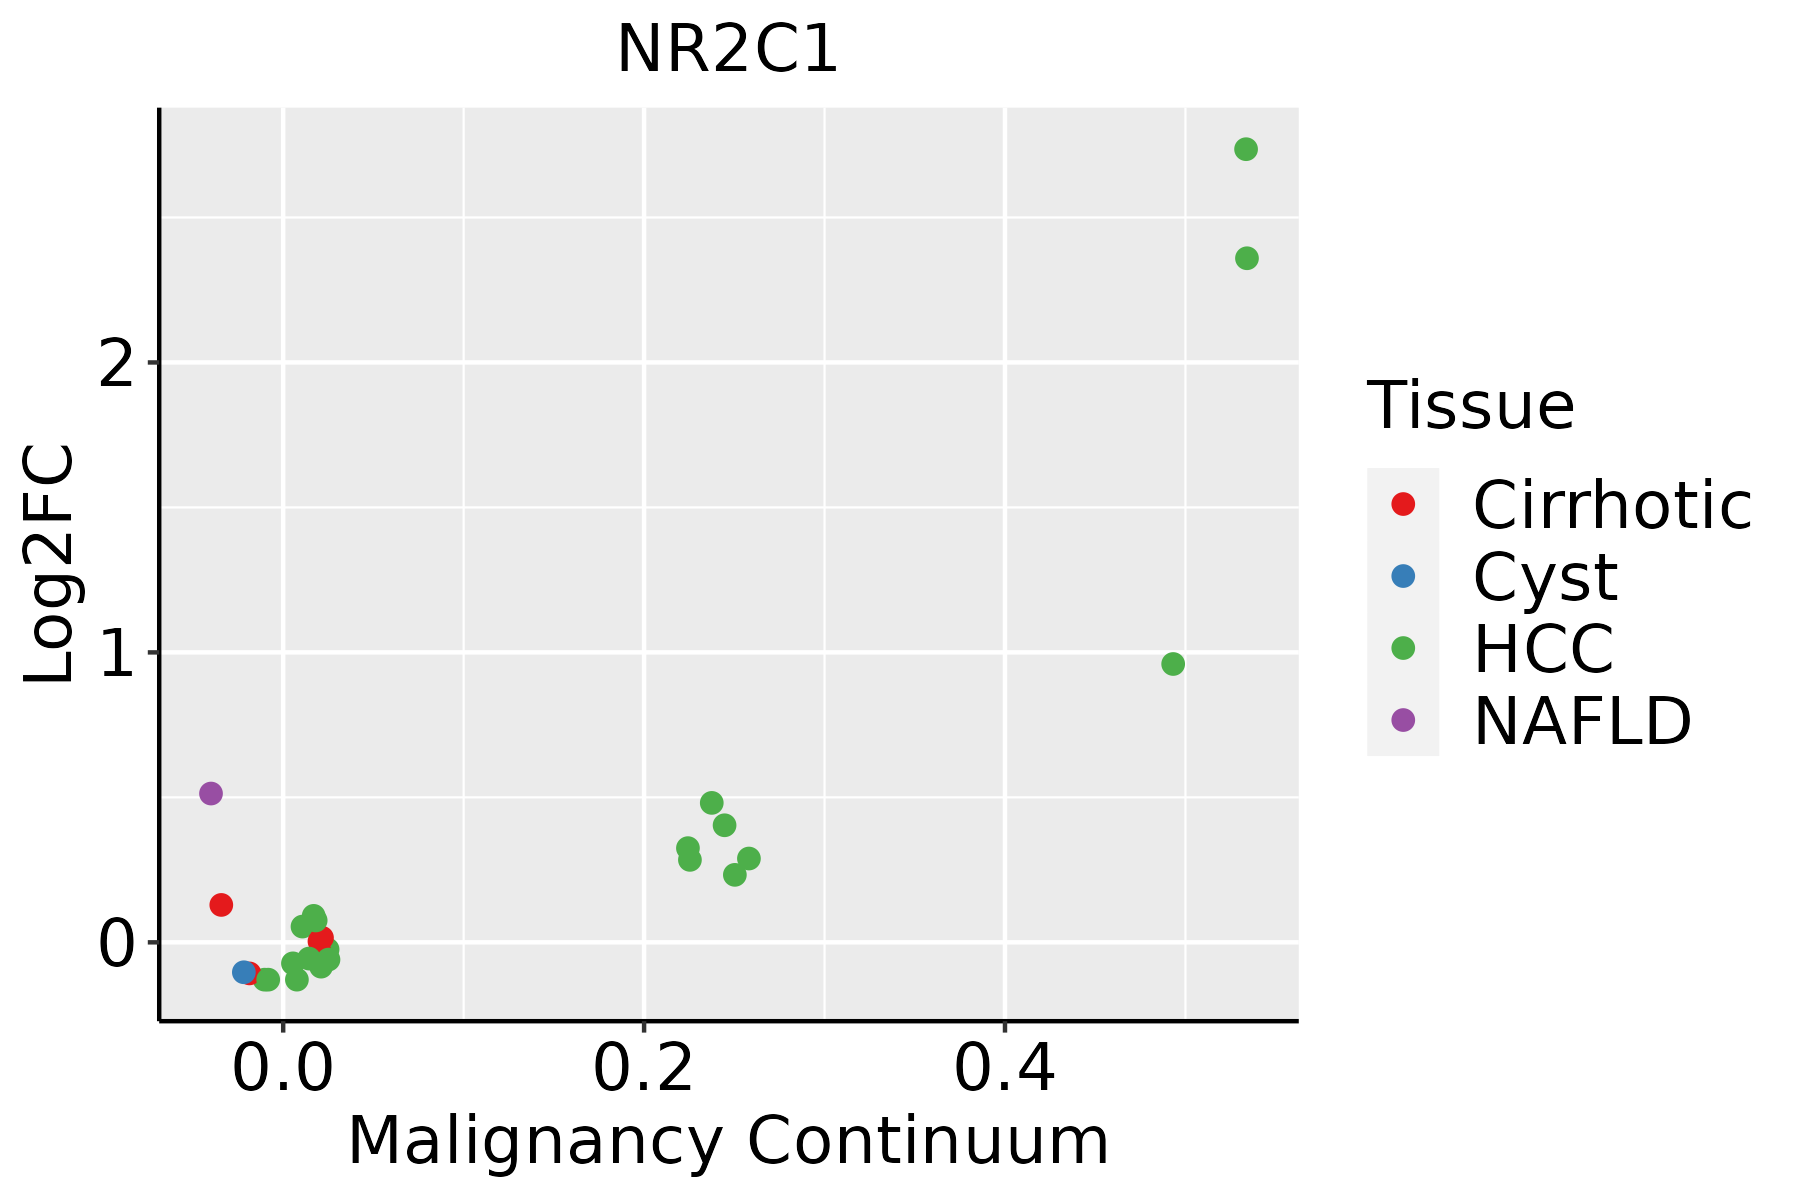 | HCC: Hepatocellular carcinoma |
| NAFLD: Non-alcoholic fatty liver disease | ||
| Oral Cavity | 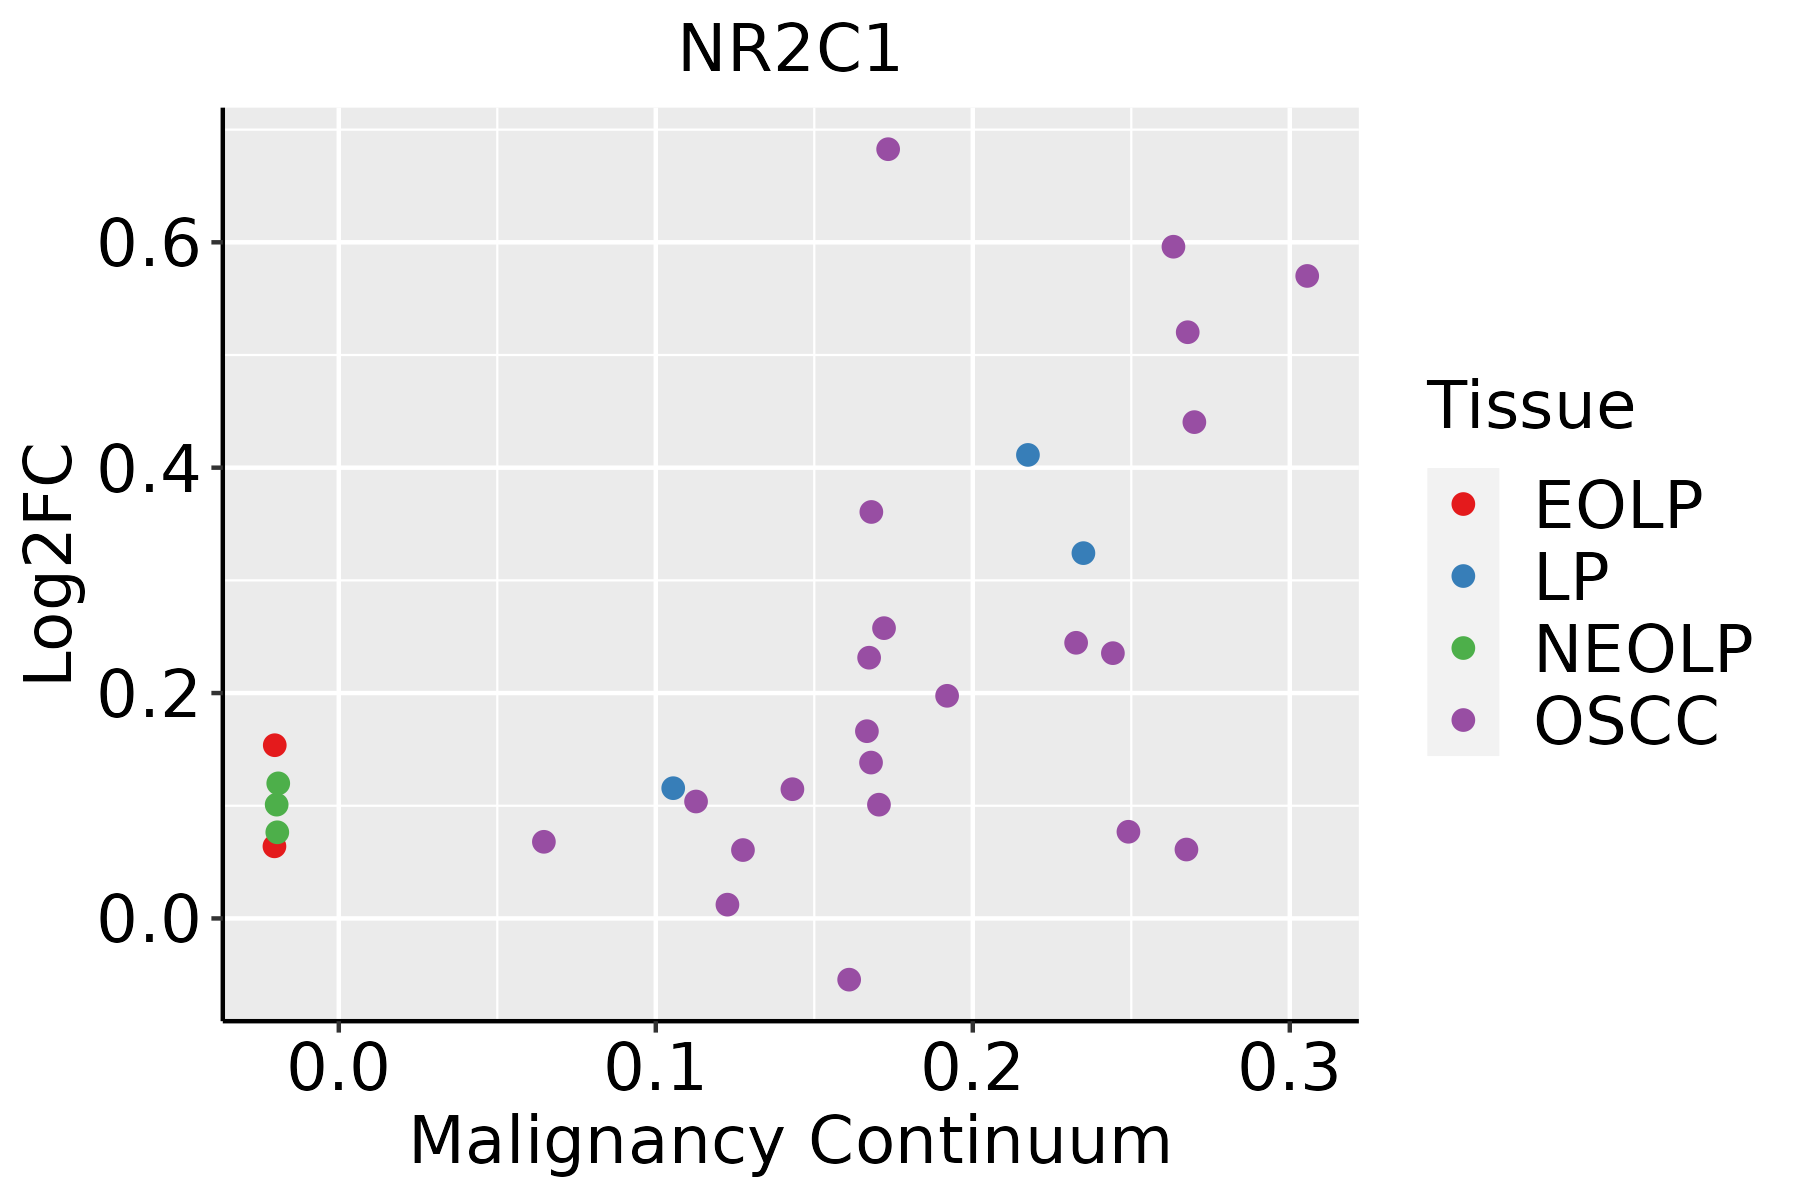 | EOLP: Erosive Oral lichen planus |
| LP: leukoplakia | ||
| NEOLP: Non-erosive oral lichen planus | ||
| OSCC: Oral squamous cell carcinoma |
| ∗log2FC in expression of this searched gene in stem-like cells from each diseased tissue sample relative to stem-like cells in normal samples in each tissue plotted against the malignancy continuum. Samples are colored based on if they are from different disease stage. |
Top |
Malignant transformation related pathway analysis |
| Find out the enriched GO biological processes and KEGG pathways involved in transition from healthy to precancer to cancer |
| Tissue | Disease Stage | Enriched GO biological Processes |
| Colorectum | AD |  |
| Colorectum | SER |  |
| Colorectum | MSS |  |
| Colorectum | MSI-H |  |
| Colorectum | FAP |  |
| ∗Top 15 enriched GO BP terms are showed in the bar plot of each disease state in each tissue. Each row represents a significant GO biological process which is colored according to the -log10(p.adjust). |
| Page: 1 2 3 4 5 6 7 8 9 |
| GO ID | Tissue | Disease Stage | Description | Gene Ratio | Bg Ratio | pvalue | p.adjust | Count |
| GO:0030522110 | Esophagus | ESCC | intracellular receptor signaling pathway | 170/8552 | 265/18723 | 8.58e-10 | 2.09e-08 | 170 |
| GO:0048545111 | Esophagus | ESCC | response to steroid hormone | 204/8552 | 339/18723 | 4.47e-08 | 8.11e-07 | 204 |
| GO:0071383110 | Esophagus | ESCC | cellular response to steroid hormone stimulus | 127/8552 | 204/18723 | 1.26e-06 | 1.55e-05 | 127 |
| GO:004340119 | Esophagus | ESCC | steroid hormone mediated signaling pathway | 87/8552 | 136/18723 | 1.25e-05 | 1.15e-04 | 87 |
| GO:000975516 | Esophagus | ESCC | hormone-mediated signaling pathway | 106/8552 | 190/18723 | 3.13e-03 | 1.30e-02 | 106 |
| GO:004838412 | Esophagus | ESCC | retinoic acid receptor signaling pathway | 22/8552 | 31/18723 | 3.90e-03 | 1.58e-02 | 22 |
| GO:00485457 | Liver | NAFLD | response to steroid hormone | 75/1882 | 339/18723 | 3.44e-11 | 1.12e-08 | 75 |
| GO:00713836 | Liver | NAFLD | cellular response to steroid hormone stimulus | 48/1882 | 204/18723 | 1.50e-08 | 1.83e-06 | 48 |
| GO:00305226 | Liver | NAFLD | intracellular receptor signaling pathway | 55/1882 | 265/18723 | 1.39e-07 | 1.03e-05 | 55 |
| GO:00097556 | Liver | NAFLD | hormone-mediated signaling pathway | 39/1882 | 190/18723 | 1.15e-05 | 3.58e-04 | 39 |
| GO:00434016 | Liver | NAFLD | steroid hormone mediated signaling pathway | 28/1882 | 136/18723 | 1.78e-04 | 3.14e-03 | 28 |
| GO:004854512 | Liver | Cirrhotic | response to steroid hormone | 146/4634 | 339/18723 | 7.87e-14 | 6.76e-12 | 146 |
| GO:007138312 | Liver | Cirrhotic | cellular response to steroid hormone stimulus | 90/4634 | 204/18723 | 1.04e-09 | 4.70e-08 | 90 |
| GO:003052212 | Liver | Cirrhotic | intracellular receptor signaling pathway | 105/4634 | 265/18723 | 5.44e-08 | 1.69e-06 | 105 |
| GO:004340111 | Liver | Cirrhotic | steroid hormone mediated signaling pathway | 58/4634 | 136/18723 | 3.44e-06 | 5.95e-05 | 58 |
| GO:000975511 | Liver | Cirrhotic | hormone-mediated signaling pathway | 71/4634 | 190/18723 | 7.09e-05 | 7.98e-04 | 71 |
| GO:0048385 | Liver | Cirrhotic | regulation of retinoic acid receptor signaling pathway | 9/4634 | 16/18723 | 6.94e-03 | 3.38e-02 | 9 |
| GO:0048384 | Liver | Cirrhotic | retinoic acid receptor signaling pathway | 14/4634 | 31/18723 | 1.05e-02 | 4.65e-02 | 14 |
| GO:003052222 | Liver | HCC | intracellular receptor signaling pathway | 171/7958 | 265/18723 | 3.00e-13 | 1.61e-11 | 171 |
| GO:004854522 | Liver | HCC | response to steroid hormone | 206/7958 | 339/18723 | 6.81e-12 | 2.92e-10 | 206 |
| Page: 1 2 |
| Pathway ID | Tissue | Disease Stage | Description | Gene Ratio | Bg Ratio | pvalue | p.adjust | qvalue | Count |
| Page: 1 |
Top |
Cell-cell communication analysis |
| Identification of potential cell-cell interactions between two cell types and their ligand-receptor pairs for different disease states |
| Ligand | Receptor | LRpair | Pathway | Tissue | Disease Stage |
| Page: 1 |
Top |
Single-cell gene regulatory network inference analysis |
| Find out the significant the regulons (TFs) and the target genes of each regulon across cell types for different disease states |
| TF | Cell Type | Tissue | Disease Stage | Target Gene | RSS | Regulon Activity |
| NR2C1 | CD8TEX | Breast | ADJ | INTS6-AS1,PATL2,TCF12, etc. | 2.27e-02 |  |
| NR2C1 | pDC | Liver | Cirrhotic | ZNF90,PRKRIP1,EAF1, etc. | 2.21e-01 |  |
| NR2C1 | pDC | Liver | HCC | ZNF90,PRKRIP1,EAF1, etc. | 5.67e-02 |  |
| NR2C1 | PLA | Lung | ADJ | ZNF286A,AL031602.2,NDUFA6-DT, etc. | 6.97e-03 |  |
| NR2C1 | MSC.MVA | Lung | Healthy | ZNF615,LINC02615,SATB2, etc. | 2.19e-02 |  |
| NR2C1 | CD8TEXP | Oral cavity | LP | NFIA,MORN3,NT5DC3, etc. | 2.01e-02 |  |
| NR2C1 | TH17 | Oral cavity | LP | NFIA,MORN3,NT5DC3, etc. | 3.38e-02 | |
| NR2C1 | CD8TEXP | Oral cavity | OSCC | NFIA,MORN3,NT5DC3, etc. | 1.09e-02 |  |
| NR2C1 | SMC | Oral cavity | LP | STAT4,VPS54,RORB, etc. | 2.23e-01 | |
| NR2C1 | SMC | Oral cavity | OSCC | STAT4,VPS54,RORB, etc. | 2.63e-01 | |
| ∗The dot plots of a searched regulon are shown for all cell subpopulations in each disease state of each tissue based on the regulon specific score inferred using pySCENIC and by calculating the average expression. |
| Page: 1 2 3 |
Top |
Somatic mutation of malignant transformation related genes |
| Annotation of somatic variants for genes involved in malignant transformation |
| Hugo Symbol | Variant Class | Variant Classification | dbSNP RS | HGVSc | HGVSp | HGVSp Short | SWISSPROT | BIOTYPE | SIFT | PolyPhen | Tumor Sample Barcode | Tissue | Histology | Sex | Age | Stage | Therapy Types | Drugs | Outcome |
| NR2C1 | SNV | Missense_Mutation | c.265N>G | p.Leu89Val | p.L89V | P13056 | protein_coding | tolerated_low_confidence(0.06) | benign(0.007) | TCGA-AN-A0AJ-01 | Breast | breast invasive carcinoma | Female | >=65 | I/II | Unknown | Unknown | SD | |
| NR2C1 | SNV | Missense_Mutation | c.883N>C | p.Met295Leu | p.M295L | P13056 | protein_coding | tolerated(1) | benign(0) | TCGA-E9-A22B-01 | Breast | breast invasive carcinoma | Female | >=65 | I/II | Hormone Therapy | tamoxiphen | SD | |
| NR2C1 | SNV | Missense_Mutation | novel | c.1210N>A | p.Ser404Thr | p.S404T | P13056 | protein_coding | deleterious(0.03) | probably_damaging(0.99) | TCGA-C5-A8XH-01 | Cervix | cervical & endocervical cancer | Female | <65 | I/II | Unknown | Unknown | SD |
| NR2C1 | SNV | Missense_Mutation | c.1156G>A | p.Glu386Lys | p.E386K | P13056 | protein_coding | tolerated(0.12) | benign(0.009) | TCGA-EK-A2H0-01 | Cervix | cervical & endocervical cancer | Female | <65 | I/II | Chemotherapy | cisplatin | CR | |
| NR2C1 | SNV | Missense_Mutation | c.1429N>C | p.Glu477Gln | p.E477Q | P13056 | protein_coding | deleterious(0.01) | benign(0.277) | TCGA-EK-A3GK-01 | Cervix | cervical & endocervical cancer | Female | <65 | I/II | Unknown | Unknown | SD | |
| NR2C1 | SNV | Missense_Mutation | c.1156G>A | p.Glu386Lys | p.E386K | P13056 | protein_coding | tolerated(0.12) | benign(0.009) | TCGA-ZJ-A8QQ-01 | Cervix | cervical & endocervical cancer | Female | <65 | I/II | Chemotherapy | cisplatin | SD | |
| NR2C1 | SNV | Missense_Mutation | novel | c.967N>A | p.Ala323Thr | p.A323T | P13056 | protein_coding | deleterious(0.04) | probably_damaging(0.989) | TCGA-5M-AAT6-01 | Colorectum | colon adenocarcinoma | Female | <65 | III/IV | Unknown | Unknown | PD |
| NR2C1 | SNV | Missense_Mutation | novel | c.1366A>G | p.Asn456Asp | p.N456D | P13056 | protein_coding | deleterious(0.02) | probably_damaging(0.98) | TCGA-AA-3845-01 | Colorectum | colon adenocarcinoma | Female | >=65 | I/II | Unknown | Unknown | PD |
| NR2C1 | SNV | Missense_Mutation | c.1687A>G | p.Thr563Ala | p.T563A | P13056 | protein_coding | tolerated(0.7) | benign(0.005) | TCGA-AD-6964-01 | Colorectum | colon adenocarcinoma | Male | <65 | III/IV | Chemotherapy | folfox | PD | |
| NR2C1 | SNV | Missense_Mutation | c.432T>A | p.Asn144Lys | p.N144K | P13056 | protein_coding | tolerated(0.17) | probably_damaging(0.996) | TCGA-AZ-6605-01 | Colorectum | colon adenocarcinoma | Male | >=65 | III/IV | Chemotherapy | folfox | SD |
| Page: 1 2 3 4 5 6 |
Top |
Related drugs of malignant transformation related genes |
| Identification of chemicals and drugs interact with genes involved in malignant transfromation |
| (DGIdb 4.0) |
| Entrez ID | Symbol | Category | Interaction Types | Drug Claim Name | Drug Name | PMIDs |
| 7181 | NR2C1 | NUCLEAR HORMONE RECEPTOR, TRANSCRIPTION FACTOR, DRUGGABLE GENOME | RETINOIC ACID | 9071982 |
| Page: 1 |

Copyright 2023-Present -The University of Texas Health Science Center at Houston |