
|
|||||
|
 | |
| |
| |
| |
| |
| |
|
Gene: NR1H4 |
Gene summary for NR1H4 |
| Gene information | Species | Human | Gene symbol | NR1H4 | Gene ID | 9971 |
| Gene name | nuclear receptor subfamily 1 group H member 4 | |
| Gene Alias | BAR | |
| Cytomap | 12q23.1 | |
| Gene Type | protein-coding | GO ID | GO:0000122 | UniProtAcc | F1DAL1 |
Top |
Malignant transformation analysis |
| Identification of the aberrant gene expression in precancerous and cancerous lesions by comparing the gene expression of stem-like cells in diseased tissues with normal stem cells |
| Entrez ID | Symbol | Replicates | Species | Organ | Tissue | Adj P-value | Log2FC | Malignancy |
| 9971 | NR1H4 | HTA11_99999970781_79442 | Human | Colorectum | MSS | 5.01e-04 | -2.52e-01 | 0.294 |
| 9971 | NR1H4 | HTA11_99999971662_82457 | Human | Colorectum | MSS | 1.10e-08 | -2.77e-01 | 0.3859 |
| 9971 | NR1H4 | HTA11_99999974143_84620 | Human | Colorectum | MSS | 1.40e-10 | -2.87e-01 | 0.3005 |
| 9971 | NR1H4 | A002-C-010 | Human | Colorectum | FAP | 1.48e-08 | -2.74e-01 | 0.242 |
| 9971 | NR1H4 | A015-C-203 | Human | Colorectum | FAP | 1.64e-09 | -2.69e-01 | -0.1294 |
| 9971 | NR1H4 | A002-C-201 | Human | Colorectum | FAP | 2.00e-04 | -2.51e-01 | 0.0324 |
| 9971 | NR1H4 | A002-C-203 | Human | Colorectum | FAP | 7.75e-08 | -2.32e-01 | 0.2786 |
| 9971 | NR1H4 | A001-C-119 | Human | Colorectum | FAP | 5.95e-03 | -2.70e-01 | -0.1557 |
| 9971 | NR1H4 | A001-C-108 | Human | Colorectum | FAP | 4.33e-08 | -2.50e-01 | -0.0272 |
| 9971 | NR1H4 | A002-C-021 | Human | Colorectum | FAP | 1.95e-11 | -2.88e-01 | 0.1171 |
| 9971 | NR1H4 | A002-C-205 | Human | Colorectum | FAP | 9.67e-07 | -2.85e-01 | -0.1236 |
| 9971 | NR1H4 | A001-C-104 | Human | Colorectum | FAP | 2.74e-04 | -2.36e-01 | 0.0184 |
| 9971 | NR1H4 | A015-C-005 | Human | Colorectum | FAP | 8.48e-03 | -2.60e-01 | -0.0336 |
| 9971 | NR1H4 | A015-C-006 | Human | Colorectum | FAP | 1.57e-05 | -2.96e-01 | -0.0994 |
| 9971 | NR1H4 | A015-C-106 | Human | Colorectum | FAP | 1.27e-10 | -2.67e-01 | -0.0511 |
| 9971 | NR1H4 | A002-C-114 | Human | Colorectum | FAP | 2.69e-07 | -2.96e-01 | -0.1561 |
| 9971 | NR1H4 | A015-C-104 | Human | Colorectum | FAP | 1.58e-13 | -2.84e-01 | -0.1899 |
| 9971 | NR1H4 | A001-C-014 | Human | Colorectum | FAP | 9.34e-11 | -2.89e-01 | 0.0135 |
| 9971 | NR1H4 | A002-C-016 | Human | Colorectum | FAP | 1.06e-07 | -2.57e-01 | 0.0521 |
| 9971 | NR1H4 | A015-C-002 | Human | Colorectum | FAP | 2.85e-04 | -2.96e-01 | -0.0763 |
| Page: 1 2 3 |
| Tissue | Expression Dynamics | Abbreviation |
| Colorectum (GSE201348) |  | FAP: Familial adenomatous polyposis |
| CRC: Colorectal cancer | ||
| Colorectum (HTA11) | 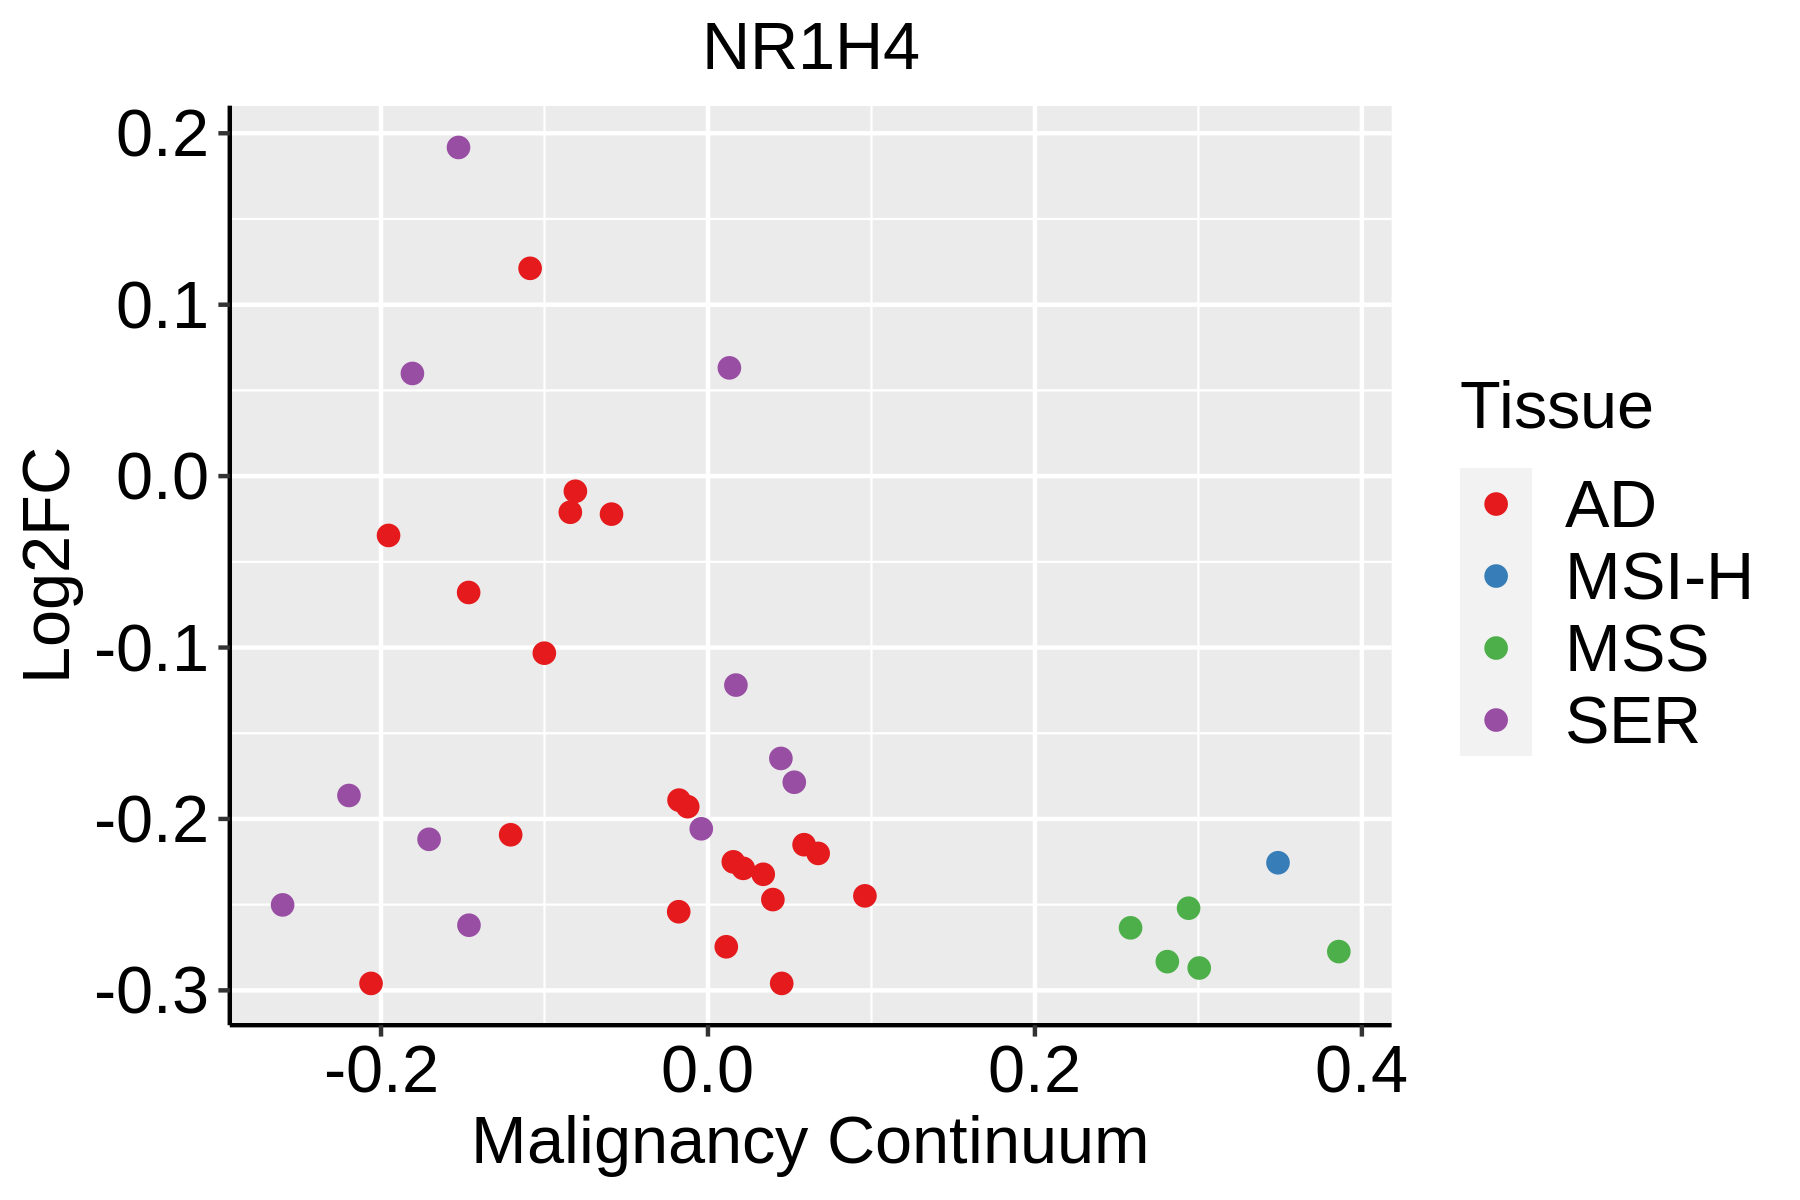 | AD: Adenomas |
| SER: Sessile serrated lesions | ||
| MSI-H: Microsatellite-high colorectal cancer | ||
| MSS: Microsatellite stable colorectal cancer | ||
| Liver |  | HCC: Hepatocellular carcinoma |
| NAFLD: Non-alcoholic fatty liver disease |
| ∗log2FC in expression of this searched gene in stem-like cells from each diseased tissue sample relative to stem-like cells in normal samples in each tissue plotted against the malignancy continuum. Samples are colored based on if they are from different disease stage. |
Top |
Malignant transformation related pathway analysis |
| Find out the enriched GO biological processes and KEGG pathways involved in transition from healthy to precancer to cancer |
| Tissue | Disease Stage | Enriched GO biological Processes |
| Colorectum | AD |  |
| Colorectum | SER |  |
| Colorectum | MSS |  |
| Colorectum | MSI-H |  |
| Colorectum | FAP |  |
| ∗Top 15 enriched GO BP terms are showed in the bar plot of each disease state in each tissue. Each row represents a significant GO biological process which is colored according to the -log10(p.adjust). |
| Page: 1 2 3 4 5 6 7 8 9 |
| GO ID | Tissue | Disease Stage | Description | Gene Ratio | Bg Ratio | pvalue | p.adjust | Count |
| GO:00305222 | Colorectum | MSS | intracellular receptor signaling pathway | 84/3467 | 265/18723 | 1.47e-07 | 6.79e-06 | 84 |
| GO:00097432 | Colorectum | MSS | response to carbohydrate | 77/3467 | 253/18723 | 2.75e-06 | 8.25e-05 | 77 |
| GO:00342842 | Colorectum | MSS | response to monosaccharide | 70/3467 | 225/18723 | 3.27e-06 | 9.57e-05 | 70 |
| GO:00713222 | Colorectum | MSS | cellular response to carbohydrate stimulus | 53/3467 | 163/18723 | 1.23e-05 | 2.87e-04 | 53 |
| GO:00316672 | Colorectum | MSS | response to nutrient levels | 125/3467 | 474/18723 | 1.24e-05 | 2.88e-04 | 125 |
| GO:00335002 | Colorectum | MSS | carbohydrate homeostasis | 76/3467 | 259/18723 | 1.37e-05 | 3.14e-04 | 76 |
| GO:00507082 | Colorectum | MSS | regulation of protein secretion | 78/3467 | 268/18723 | 1.47e-05 | 3.33e-04 | 78 |
| GO:00097462 | Colorectum | MSS | response to hexose | 66/3467 | 219/18723 | 1.94e-05 | 4.18e-04 | 66 |
| GO:00425932 | Colorectum | MSS | glucose homeostasis | 75/3467 | 258/18723 | 2.22e-05 | 4.69e-04 | 75 |
| GO:00097492 | Colorectum | MSS | response to glucose | 64/3467 | 212/18723 | 2.43e-05 | 5.09e-04 | 64 |
| GO:00093062 | Colorectum | MSS | protein secretion | 98/3467 | 359/18723 | 2.43e-05 | 5.09e-04 | 98 |
| GO:00713332 | Colorectum | MSS | cellular response to glucose stimulus | 49/3467 | 151/18723 | 2.73e-05 | 5.58e-04 | 49 |
| GO:00355922 | Colorectum | MSS | establishment of protein localization to extracellular region | 98/3467 | 360/18723 | 2.75e-05 | 5.58e-04 | 98 |
| GO:00016782 | Colorectum | MSS | cellular glucose homeostasis | 54/3467 | 172/18723 | 3.11e-05 | 6.25e-04 | 54 |
| GO:00713312 | Colorectum | MSS | cellular response to hexose stimulus | 49/3467 | 153/18723 | 4.01e-05 | 7.61e-04 | 49 |
| GO:00716922 | Colorectum | MSS | protein localization to extracellular region | 99/3467 | 368/18723 | 4.17e-05 | 7.83e-04 | 99 |
| GO:00713262 | Colorectum | MSS | cellular response to monosaccharide stimulus | 49/3467 | 154/18723 | 4.84e-05 | 8.80e-04 | 49 |
| GO:00431221 | Colorectum | MSS | regulation of I-kappaB kinase/NF-kappaB signaling | 71/3467 | 249/18723 | 7.12e-05 | 1.21e-03 | 71 |
| GO:00072491 | Colorectum | MSS | I-kappaB kinase/NF-kappaB signaling | 77/3467 | 281/18723 | 1.51e-04 | 2.19e-03 | 77 |
| GO:00507962 | Colorectum | MSS | regulation of insulin secretion | 50/3467 | 165/18723 | 1.61e-04 | 2.31e-03 | 50 |
| Page: 1 2 3 4 5 6 7 8 9 10 11 12 13 14 15 16 |
| Pathway ID | Tissue | Disease Stage | Description | Gene Ratio | Bg Ratio | pvalue | p.adjust | qvalue | Count |
| hsa04976 | Colorectum | FAP | Bile secretion | 24/1404 | 89/8465 | 8.76e-03 | 3.21e-02 | 1.96e-02 | 24 |
| hsa049761 | Colorectum | FAP | Bile secretion | 24/1404 | 89/8465 | 8.76e-03 | 3.21e-02 | 1.96e-02 | 24 |
| hsa049762 | Liver | NAFLD | Bile secretion | 20/1043 | 89/8465 | 5.08e-03 | 4.43e-02 | 3.57e-02 | 20 |
| hsa0497611 | Liver | NAFLD | Bile secretion | 20/1043 | 89/8465 | 5.08e-03 | 4.43e-02 | 3.57e-02 | 20 |
| Page: 1 |
Top |
Cell-cell communication analysis |
| Identification of potential cell-cell interactions between two cell types and their ligand-receptor pairs for different disease states |
| Ligand | Receptor | LRpair | Pathway | Tissue | Disease Stage |
| Page: 1 |
Top |
Single-cell gene regulatory network inference analysis |
| Find out the significant the regulons (TFs) and the target genes of each regulon across cell types for different disease states |
| TF | Cell Type | Tissue | Disease Stage | Target Gene | RSS | Regulon Activity |
| NR1H4 | ABS | Colorectum | ADJ | SLC26A2,SLC43A2,ANPEP, etc. | 3.24e-01 |  |
| NR1H4 | HEP | Liver | HCC | AF165147.1,ADAMTSL1,MARC1, etc. | 8.18e-01 |  |
| NR1H4 | HEP | Liver | Healthy | CFH,GC,SLC13A5, etc. | 6.79e-01 |  |
| ∗The dot plots of a searched regulon are shown for all cell subpopulations in each disease state of each tissue based on the regulon specific score inferred using pySCENIC and by calculating the average expression. |
| Page: 1 |
Top |
Somatic mutation of malignant transformation related genes |
| Annotation of somatic variants for genes involved in malignant transformation |
| Hugo Symbol | Variant Class | Variant Classification | dbSNP RS | HGVSc | HGVSp | HGVSp Short | SWISSPROT | BIOTYPE | SIFT | PolyPhen | Tumor Sample Barcode | Tissue | Histology | Sex | Age | Stage | Therapy Types | Drugs | Outcome |
| NR1H4 | SNV | Missense_Mutation | c.691N>C | p.Asp231His | p.D231H | Q96RI1 | protein_coding | tolerated(0.07) | benign(0.017) | TCGA-A2-A04Y-01 | Breast | breast invasive carcinoma | Female | <65 | I/II | Chemotherapy | cytoxan | SD | |
| NR1H4 | SNV | Missense_Mutation | rs760756841 | c.1373N>G | p.Asn458Ser | p.N458S | Q96RI1 | protein_coding | tolerated(0.33) | benign(0.037) | TCGA-A2-A3Y0-01 | Breast | breast invasive carcinoma | Female | <65 | I/II | Chemotherapy | adriamycin | CR |
| NR1H4 | SNV | Missense_Mutation | novel | c.888N>T | p.Glu296Asp | p.E296D | Q96RI1 | protein_coding | tolerated(0.48) | benign(0.003) | TCGA-AN-A046-01 | Breast | breast invasive carcinoma | Female | >=65 | I/II | Unknown | Unknown | SD |
| NR1H4 | SNV | Missense_Mutation | c.1117G>A | p.Asp373Asn | p.D373N | Q96RI1 | protein_coding | deleterious(0.01) | benign(0.087) | TCGA-C8-A26Y-01 | Breast | breast invasive carcinoma | Female | >=65 | I/II | Unknown | Unknown | SD | |
| NR1H4 | SNV | Missense_Mutation | rs768234999 | c.1064N>T | p.Pro355Leu | p.P355L | Q96RI1 | protein_coding | tolerated(0.12) | benign(0.037) | TCGA-LD-A7W5-01 | Breast | breast invasive carcinoma | Female | <65 | III/IV | Chemotherapy | taxotere | SD |
| NR1H4 | insertion | Frame_Shift_Ins | novel | c.568_569insTTAGAAAACAAATTCACATTTTTCCT | p.Gln190LeufsTer14 | p.Q190Lfs*14 | Q96RI1 | protein_coding | TCGA-A7-A0CJ-01 | Breast | breast invasive carcinoma | Female | <65 | I/II | Chemotherapy | cytoxan | SD | ||
| NR1H4 | SNV | Missense_Mutation | rs769086612 | c.367N>T | p.Arg123Cys | p.R123C | Q96RI1 | protein_coding | deleterious(0) | probably_damaging(0.997) | TCGA-C5-A1BK-01 | Cervix | cervical & endocervical cancer | Female | <65 | I/II | Unknown | Unknown | SD |
| NR1H4 | SNV | Missense_Mutation | rs767846303 | c.595G>C | p.Glu199Gln | p.E199Q | Q96RI1 | protein_coding | tolerated(0.14) | benign(0.034) | TCGA-VS-A94X-01 | Cervix | cervical & endocervical cancer | Female | <65 | I/II | Chemotherapy | cisplatin | PD |
| NR1H4 | SNV | Missense_Mutation | c.1414N>T | p.Asp472Tyr | p.D472Y | Q96RI1 | protein_coding | deleterious(0) | probably_damaging(0.998) | TCGA-AA-A010-01 | Colorectum | colon adenocarcinoma | Female | <65 | I/II | Chemotherapy | folinic | CR | |
| NR1H4 | SNV | Missense_Mutation | c.1256N>C | p.Glu419Ala | p.E419A | Q96RI1 | protein_coding | deleterious(0.01) | probably_damaging(0.997) | TCGA-AY-6197-01 | Colorectum | colon adenocarcinoma | Male | <65 | I/II | Unknown | Unknown | SD |
| Page: 1 2 3 4 5 6 7 8 9 10 |
Top |
Related drugs of malignant transformation related genes |
| Identification of chemicals and drugs interact with genes involved in malignant transfromation |
| (DGIdb 4.0) |
| Entrez ID | Symbol | Category | Interaction Types | Drug Claim Name | Drug Name | PMIDs |
| 9971 | NR1H4 | DRUGGABLE GENOME, NUCLEAR HORMONE RECEPTOR, KINASE, TRANSCRIPTION FACTOR | PENTACHLOROPHENOL | PENTACHLOROPHENOL | ||
| 9971 | NR1H4 | DRUGGABLE GENOME, NUCLEAR HORMONE RECEPTOR, KINASE, TRANSCRIPTION FACTOR | agonist | 354702202 | TROPIFEXOR | |
| 9971 | NR1H4 | DRUGGABLE GENOME, NUCLEAR HORMONE RECEPTOR, KINASE, TRANSCRIPTION FACTOR | LITHOCHOLIC ACID | LITHOCHOLIC ACID | 17963371 | |
| 9971 | NR1H4 | DRUGGABLE GENOME, NUCLEAR HORMONE RECEPTOR, KINASE, TRANSCRIPTION FACTOR | agonist | 404859091 | CILOFEXOR | |
| 9971 | NR1H4 | DRUGGABLE GENOME, NUCLEAR HORMONE RECEPTOR, KINASE, TRANSCRIPTION FACTOR | PMID29649907-Compound-12 | |||
| 9971 | NR1H4 | DRUGGABLE GENOME, NUCLEAR HORMONE RECEPTOR, KINASE, TRANSCRIPTION FACTOR | 12-EPISCALARIN | CHEMBL269105 | 17988093 | |
| 9971 | NR1H4 | DRUGGABLE GENOME, NUCLEAR HORMONE RECEPTOR, KINASE, TRANSCRIPTION FACTOR | GANODERIOL F | GANODERIOL F | 22014750 | |
| 9971 | NR1H4 | DRUGGABLE GENOME, NUCLEAR HORMONE RECEPTOR, KINASE, TRANSCRIPTION FACTOR | BENZO(K)FLUORANTHENE | BENZO(K)FLUORANTHENE | ||
| 9971 | NR1H4 | DRUGGABLE GENOME, NUCLEAR HORMONE RECEPTOR, KINASE, TRANSCRIPTION FACTOR | PMID29649907-Compound-11 | |||
| 9971 | NR1H4 | DRUGGABLE GENOME, NUCLEAR HORMONE RECEPTOR, KINASE, TRANSCRIPTION FACTOR | PMID29649907-Compound-8 |
| Page: 1 2 3 4 5 6 7 8 9 10 11 12 13 |

Copyright 2023-Present -The University of Texas Health Science Center at Houston |