
|
|||||
|
 | |
| |
| |
| |
| |
| |
|
Gene: NR1H3 |
Gene summary for NR1H3 |
| Gene information | Species | Human | Gene symbol | NR1H3 | Gene ID | 10062 |
| Gene name | nuclear receptor subfamily 1 group H member 3 | |
| Gene Alias | LXR-a | |
| Cytomap | 11p11.2 | |
| Gene Type | protein-coding | GO ID | GO:0000122 | UniProtAcc | Q13133 |
Top |
Malignant transformation analysis |
| Identification of the aberrant gene expression in precancerous and cancerous lesions by comparing the gene expression of stem-like cells in diseased tissues with normal stem cells |
| Entrez ID | Symbol | Replicates | Species | Organ | Tissue | Adj P-value | Log2FC | Malignancy |
| 10062 | NR1H3 | HTA11_1938_2000001011 | Human | Colorectum | AD | 6.50e-05 | 3.62e-01 | -0.0811 |
| 10062 | NR1H3 | HTA11_347_2000001011 | Human | Colorectum | AD | 1.52e-09 | 3.03e-01 | -0.1954 |
| 10062 | NR1H3 | HTA11_83_2000001011 | Human | Colorectum | SER | 3.70e-04 | 2.63e-01 | -0.1526 |
| 10062 | NR1H3 | HTA11_696_2000001011 | Human | Colorectum | AD | 6.56e-03 | 2.53e-01 | -0.1464 |
| 10062 | NR1H3 | HTA11_1391_2000001011 | Human | Colorectum | AD | 6.17e-07 | 2.91e-01 | -0.059 |
| 10062 | NR1H3 | HTA11_99999971662_82457 | Human | Colorectum | MSS | 7.77e-03 | 3.27e-01 | 0.3859 |
| 10062 | NR1H3 | HTA11_99999974143_84620 | Human | Colorectum | MSS | 7.69e-06 | 3.05e-01 | 0.3005 |
| 10062 | NR1H3 | LZE24T | Human | Esophagus | ESCC | 4.23e-08 | 2.22e-01 | 0.0596 |
| 10062 | NR1H3 | P4T-E | Human | Esophagus | ESCC | 5.92e-04 | 1.39e-01 | 0.1323 |
| 10062 | NR1H3 | P5T-E | Human | Esophagus | ESCC | 3.67e-07 | 4.92e-02 | 0.1327 |
| 10062 | NR1H3 | P8T-E | Human | Esophagus | ESCC | 3.28e-08 | 1.83e-01 | 0.0889 |
| 10062 | NR1H3 | P9T-E | Human | Esophagus | ESCC | 1.16e-05 | 1.65e-01 | 0.1131 |
| 10062 | NR1H3 | P12T-E | Human | Esophagus | ESCC | 2.22e-08 | 1.19e-01 | 0.1122 |
| 10062 | NR1H3 | P15T-E | Human | Esophagus | ESCC | 1.76e-04 | 1.28e-01 | 0.1149 |
| 10062 | NR1H3 | P16T-E | Human | Esophagus | ESCC | 7.04e-04 | 5.07e-02 | 0.1153 |
| 10062 | NR1H3 | P20T-E | Human | Esophagus | ESCC | 3.60e-04 | 1.29e-01 | 0.1124 |
| 10062 | NR1H3 | P21T-E | Human | Esophagus | ESCC | 1.30e-03 | 5.35e-02 | 0.1617 |
| 10062 | NR1H3 | P22T-E | Human | Esophagus | ESCC | 1.52e-11 | 1.58e-01 | 0.1236 |
| 10062 | NR1H3 | P24T-E | Human | Esophagus | ESCC | 3.18e-09 | 1.12e-01 | 0.1287 |
| 10062 | NR1H3 | P27T-E | Human | Esophagus | ESCC | 1.98e-04 | 7.77e-02 | 0.1055 |
| Page: 1 2 3 |
| Tissue | Expression Dynamics | Abbreviation |
| Colorectum (GSE201348) |  | FAP: Familial adenomatous polyposis |
| CRC: Colorectal cancer | ||
| Colorectum (HTA11) |  | AD: Adenomas |
| SER: Sessile serrated lesions | ||
| MSI-H: Microsatellite-high colorectal cancer | ||
| MSS: Microsatellite stable colorectal cancer | ||
| Esophagus | 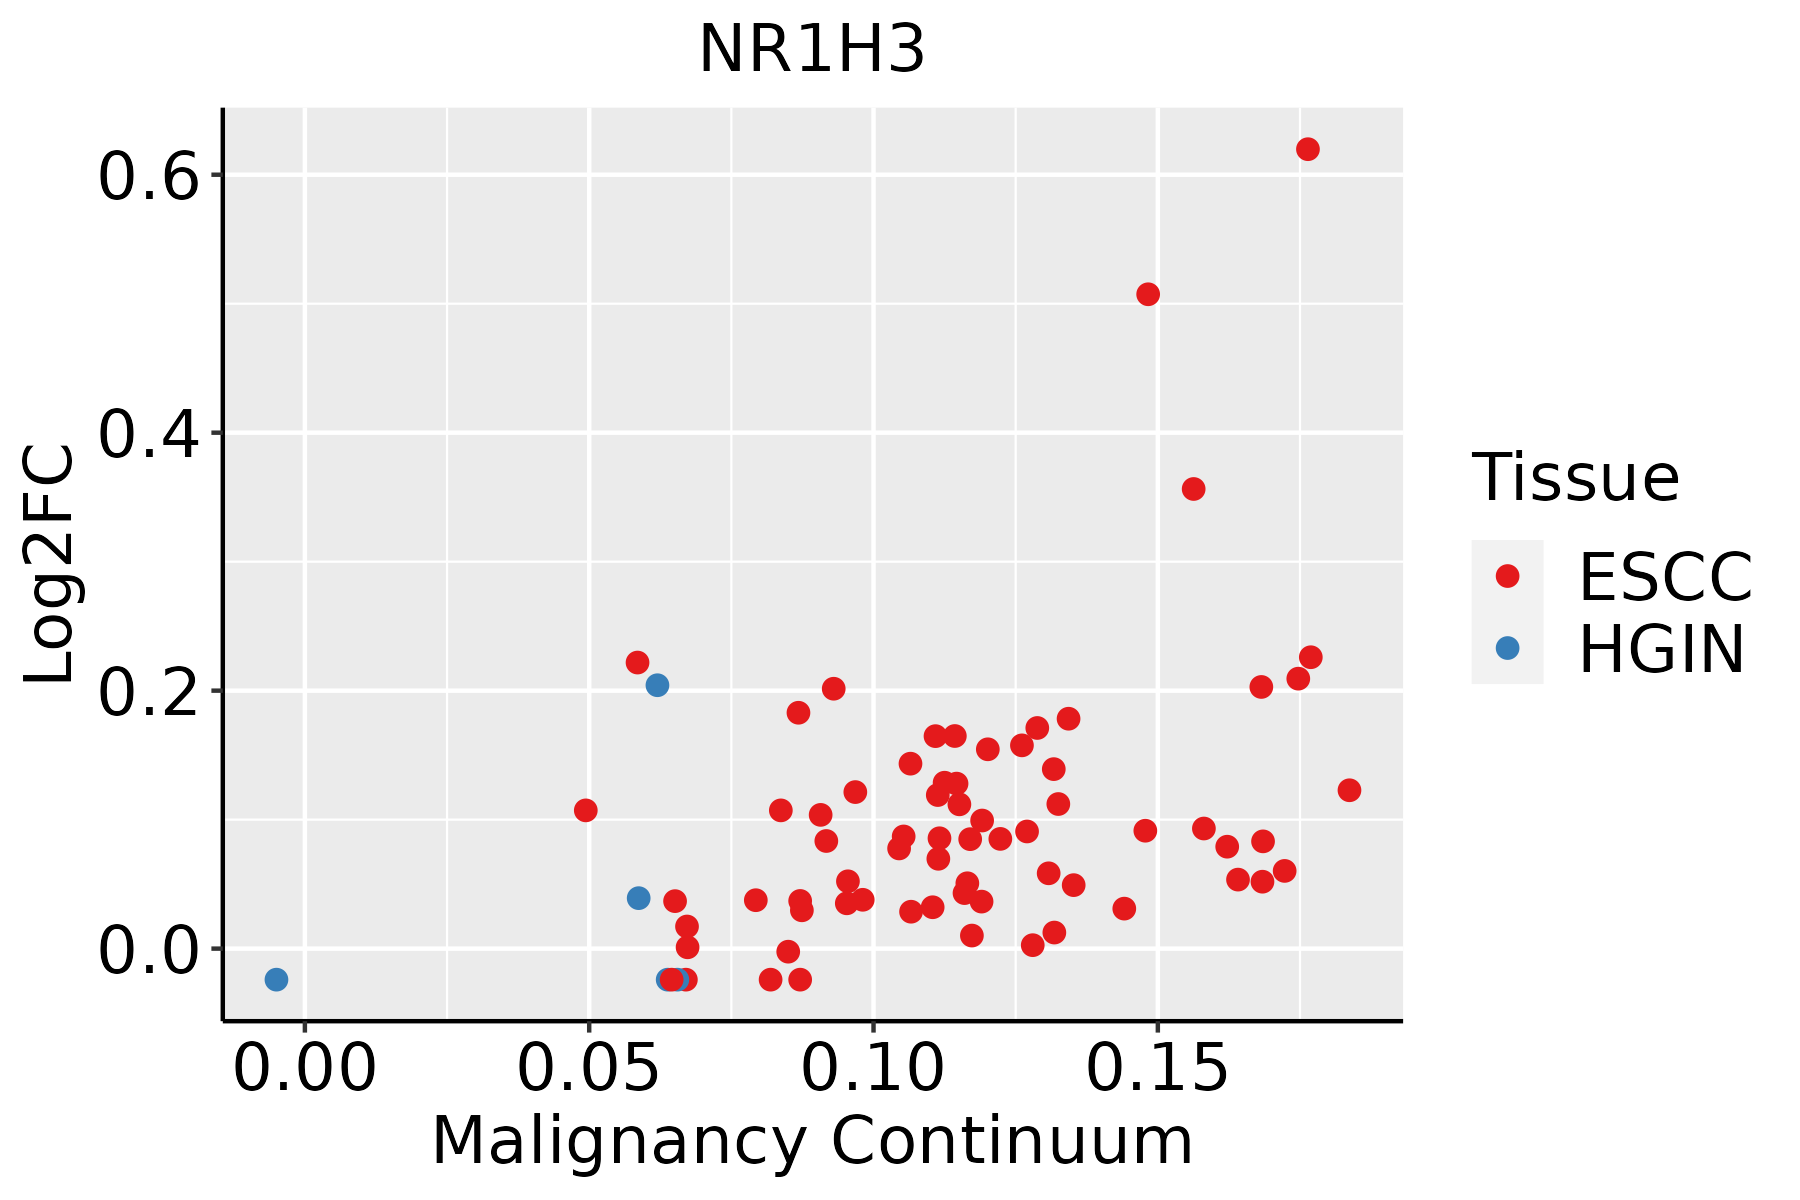 | ESCC: Esophageal squamous cell carcinoma |
| HGIN: High-grade intraepithelial neoplasias | ||
| LGIN: Low-grade intraepithelial neoplasias | ||
| Liver | 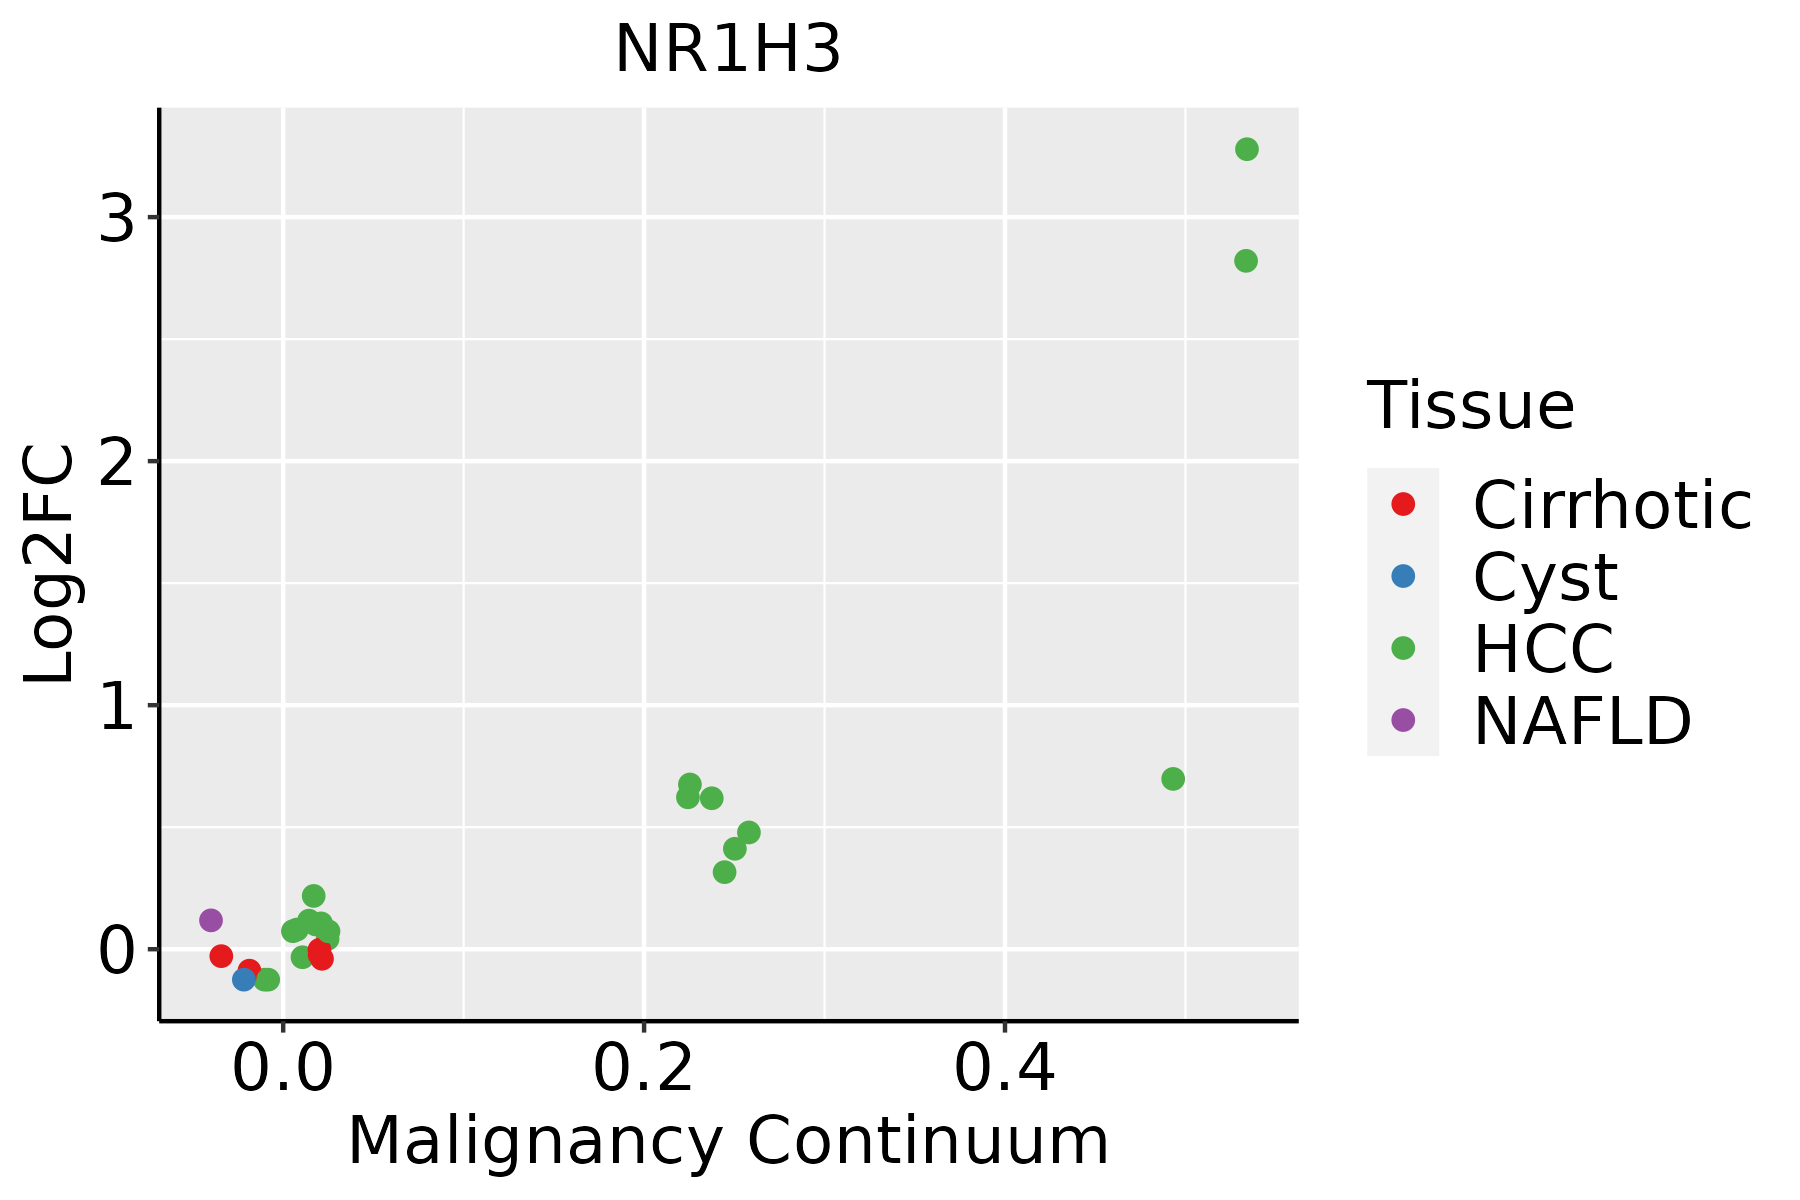 | HCC: Hepatocellular carcinoma |
| NAFLD: Non-alcoholic fatty liver disease |
| ∗log2FC in expression of this searched gene in stem-like cells from each diseased tissue sample relative to stem-like cells in normal samples in each tissue plotted against the malignancy continuum. Samples are colored based on if they are from different disease stage. |
Top |
Malignant transformation related pathway analysis |
| Find out the enriched GO biological processes and KEGG pathways involved in transition from healthy to precancer to cancer |
| Tissue | Disease Stage | Enriched GO biological Processes |
| Colorectum | AD |  |
| Colorectum | SER |  |
| Colorectum | MSS |  |
| Colorectum | MSI-H |  |
| Colorectum | FAP |  |
| ∗Top 15 enriched GO BP terms are showed in the bar plot of each disease state in each tissue. Each row represents a significant GO biological process which is colored according to the -log10(p.adjust). |
| Page: 1 2 3 4 5 6 7 8 9 |
| GO ID | Tissue | Disease Stage | Description | Gene Ratio | Bg Ratio | pvalue | p.adjust | Count |
| GO:0034976 | Colorectum | AD | response to endoplasmic reticulum stress | 90/3918 | 256/18723 | 8.48e-08 | 4.28e-06 | 90 |
| GO:0030522 | Colorectum | AD | intracellular receptor signaling pathway | 87/3918 | 265/18723 | 3.69e-06 | 1.03e-04 | 87 |
| GO:0007623 | Colorectum | AD | circadian rhythm | 72/3918 | 210/18723 | 4.50e-06 | 1.21e-04 | 72 |
| GO:0048511 | Colorectum | AD | rhythmic process | 94/3918 | 298/18723 | 1.00e-05 | 2.34e-04 | 94 |
| GO:0048545 | Colorectum | AD | response to steroid hormone | 104/3918 | 339/18723 | 1.33e-05 | 2.90e-04 | 104 |
| GO:0045861 | Colorectum | AD | negative regulation of proteolysis | 106/3918 | 351/18723 | 2.33e-05 | 4.57e-04 | 106 |
| GO:0006631 | Colorectum | AD | fatty acid metabolic process | 114/3918 | 390/18723 | 5.58e-05 | 9.44e-04 | 114 |
| GO:0050708 | Colorectum | AD | regulation of protein secretion | 83/3918 | 268/18723 | 6.59e-05 | 1.07e-03 | 83 |
| GO:0009306 | Colorectum | AD | protein secretion | 105/3918 | 359/18723 | 1.05e-04 | 1.57e-03 | 105 |
| GO:0035592 | Colorectum | AD | establishment of protein localization to extracellular region | 105/3918 | 360/18723 | 1.18e-04 | 1.73e-03 | 105 |
| GO:1905897 | Colorectum | AD | regulation of response to endoplasmic reticulum stress | 32/3918 | 82/18723 | 1.37e-04 | 1.95e-03 | 32 |
| GO:0030100 | Colorectum | AD | regulation of endocytosis | 67/3918 | 211/18723 | 1.42e-04 | 2.01e-03 | 67 |
| GO:0071692 | Colorectum | AD | protein localization to extracellular region | 106/3918 | 368/18723 | 1.86e-04 | 2.49e-03 | 106 |
| GO:0050878 | Colorectum | AD | regulation of body fluid levels | 108/3918 | 379/18723 | 2.54e-04 | 3.20e-03 | 108 |
| GO:0007589 | Colorectum | AD | body fluid secretion | 33/3918 | 93/18723 | 8.26e-04 | 8.13e-03 | 33 |
| GO:1901654 | Colorectum | AD | response to ketone | 59/3918 | 194/18723 | 1.14e-03 | 1.04e-02 | 59 |
| GO:0042752 | Colorectum | AD | regulation of circadian rhythm | 40/3918 | 121/18723 | 1.24e-03 | 1.09e-02 | 40 |
| GO:0062012 | Colorectum | AD | regulation of small molecule metabolic process | 93/3918 | 334/18723 | 1.46e-03 | 1.24e-02 | 93 |
| GO:0010876 | Colorectum | AD | lipid localization | 120/3918 | 448/18723 | 1.59e-03 | 1.33e-02 | 120 |
| GO:0006869 | Colorectum | AD | lipid transport | 108/3918 | 398/18723 | 1.67e-03 | 1.39e-02 | 108 |
| Page: 1 2 3 4 5 6 7 8 9 10 11 12 13 14 15 |
| Pathway ID | Tissue | Disease Stage | Description | Gene Ratio | Bg Ratio | pvalue | p.adjust | qvalue | Count |
| hsa04932 | Colorectum | AD | Non-alcoholic fatty liver disease | 90/2092 | 155/8465 | 4.83e-19 | 1.80e-17 | 1.15e-17 | 90 |
| hsa05160 | Colorectum | AD | Hepatitis C | 54/2092 | 157/8465 | 3.87e-03 | 1.96e-02 | 1.25e-02 | 54 |
| hsa049321 | Colorectum | AD | Non-alcoholic fatty liver disease | 90/2092 | 155/8465 | 4.83e-19 | 1.80e-17 | 1.15e-17 | 90 |
| hsa051601 | Colorectum | AD | Hepatitis C | 54/2092 | 157/8465 | 3.87e-03 | 1.96e-02 | 1.25e-02 | 54 |
| hsa049322 | Colorectum | SER | Non-alcoholic fatty liver disease | 75/1580 | 155/8465 | 2.16e-17 | 5.99e-16 | 4.35e-16 | 75 |
| hsa049323 | Colorectum | SER | Non-alcoholic fatty liver disease | 75/1580 | 155/8465 | 2.16e-17 | 5.99e-16 | 4.35e-16 | 75 |
| hsa049324 | Colorectum | MSS | Non-alcoholic fatty liver disease | 85/1875 | 155/8465 | 4.19e-19 | 1.17e-17 | 7.17e-18 | 85 |
| hsa051602 | Colorectum | MSS | Hepatitis C | 52/1875 | 157/8465 | 9.29e-04 | 5.58e-03 | 3.42e-03 | 52 |
| hsa04931 | Colorectum | MSS | Insulin resistance | 36/1875 | 108/8465 | 4.74e-03 | 2.01e-02 | 1.23e-02 | 36 |
| hsa049325 | Colorectum | MSS | Non-alcoholic fatty liver disease | 85/1875 | 155/8465 | 4.19e-19 | 1.17e-17 | 7.17e-18 | 85 |
| hsa051603 | Colorectum | MSS | Hepatitis C | 52/1875 | 157/8465 | 9.29e-04 | 5.58e-03 | 3.42e-03 | 52 |
| hsa049311 | Colorectum | MSS | Insulin resistance | 36/1875 | 108/8465 | 4.74e-03 | 2.01e-02 | 1.23e-02 | 36 |
| hsa04932210 | Esophagus | ESCC | Non-alcoholic fatty liver disease | 122/4205 | 155/8465 | 5.69e-14 | 1.59e-12 | 8.14e-13 | 122 |
| hsa051609 | Esophagus | ESCC | Hepatitis C | 107/4205 | 157/8465 | 1.75e-06 | 1.08e-05 | 5.55e-06 | 107 |
| hsa049318 | Esophagus | ESCC | Insulin resistance | 69/4205 | 108/8465 | 1.92e-03 | 5.54e-03 | 2.84e-03 | 69 |
| hsa0493238 | Esophagus | ESCC | Non-alcoholic fatty liver disease | 122/4205 | 155/8465 | 5.69e-14 | 1.59e-12 | 8.14e-13 | 122 |
| hsa0516016 | Esophagus | ESCC | Hepatitis C | 107/4205 | 157/8465 | 1.75e-06 | 1.08e-05 | 5.55e-06 | 107 |
| hsa0493113 | Esophagus | ESCC | Insulin resistance | 69/4205 | 108/8465 | 1.92e-03 | 5.54e-03 | 2.84e-03 | 69 |
| hsa0493222 | Liver | Cirrhotic | Non-alcoholic fatty liver disease | 106/2530 | 155/8465 | 2.16e-23 | 2.40e-21 | 1.48e-21 | 106 |
| hsa051605 | Liver | Cirrhotic | Hepatitis C | 63/2530 | 157/8465 | 3.67e-03 | 1.49e-02 | 9.20e-03 | 63 |
| Page: 1 2 |
Top |
Cell-cell communication analysis |
| Identification of potential cell-cell interactions between two cell types and their ligand-receptor pairs for different disease states |
| Ligand | Receptor | LRpair | Pathway | Tissue | Disease Stage |
| Page: 1 |
Top |
Single-cell gene regulatory network inference analysis |
| Find out the significant the regulons (TFs) and the target genes of each regulon across cell types for different disease states |
| TF | Cell Type | Tissue | Disease Stage | Target Gene | RSS | Regulon Activity |
| NR1H3 | M1MAC | Breast | DCIS | APOC1,APOE,CTSD, etc. | 1.79e-01 |  |
| NR1H3 | INMON | Breast | DCIS | APOC1,APOE,CTSD, etc. | 1.01e-01 | |
| NR1H3 | INMON | Breast | Healthy | APOC1,APOE,CTSD, etc. | 2.16e-01 |  |
| NR1H3 | M1MAC | Breast | Healthy | APOC1,APOE,CTSD, etc. | 5.82e-02 | |
| NR1H3 | MON | Breast | Healthy | APOC1,APOE,CTSD, etc. | 1.08e-01 | |
| NR1H3 | M1MAC | Breast | IDC | APOC1,APOE,CTSD, etc. | 3.05e-01 |  |
| NR1H3 | M2MAC | Breast | IDC | APOC1,APOE,CTSD, etc. | 3.23e-02 | |
| NR1H3 | INMON | Breast | IDC | APOC1,APOE,CTSD, etc. | 1.88e-01 | |
| NR1H3 | MON | Breast | IDC | APOC1,APOE,CTSD, etc. | 5.09e-02 | |
| NR1H3 | INMON | Breast | Precancer | APOC1,APOE,CTSD, etc. | 3.70e-01 |  |
| ∗The dot plots of a searched regulon are shown for all cell subpopulations in each disease state of each tissue based on the regulon specific score inferred using pySCENIC and by calculating the average expression. |
| Page: 1 2 3 4 |
Top |
Somatic mutation of malignant transformation related genes |
| Annotation of somatic variants for genes involved in malignant transformation |
| Hugo Symbol | Variant Class | Variant Classification | dbSNP RS | HGVSc | HGVSp | HGVSp Short | SWISSPROT | BIOTYPE | SIFT | PolyPhen | Tumor Sample Barcode | Tissue | Histology | Sex | Age | Stage | Therapy Types | Drugs | Outcome |
| NR1H3 | SNV | Missense_Mutation | novel | c.275N>G | p.Lys92Arg | p.K92R | protein_coding | tolerated(0.06) | benign(0.41) | TCGA-VS-A8EI-01 | Cervix | cervical & endocervical cancer | Female | <65 | I/II | Chemotherapy | cisplatin | CR | |
| NR1H3 | SNV | Missense_Mutation | rs565653980 | c.776G>A | p.Arg259His | p.R259H | protein_coding | deleterious(0.05) | possibly_damaging(0.589) | TCGA-AA-3864-01 | Colorectum | colon adenocarcinoma | Male | >=65 | I/II | Unknown | Unknown | SD | |
| NR1H3 | SNV | Missense_Mutation | rs556085486 | c.899N>T | p.Ala300Val | p.A300V | protein_coding | deleterious(0) | benign(0.071) | TCGA-AA-A02J-01 | Colorectum | colon adenocarcinoma | Female | >=65 | III/IV | Unknown | Unknown | PD | |
| NR1H3 | SNV | Missense_Mutation | rs778600458 | c.757C>T | p.Arg253Trp | p.R253W | protein_coding | tolerated(0.05) | benign(0.012) | TCGA-AA-A02R-01 | Colorectum | colon adenocarcinoma | Female | >=65 | I/II | Unknown | Unknown | PD | |
| NR1H3 | SNV | Missense_Mutation | c.1327N>T | p.Pro443Ser | p.P443S | protein_coding | deleterious(0) | benign(0.322) | TCGA-AM-5821-01 | Colorectum | colon adenocarcinoma | Female | >=65 | I/II | Unknown | Unknown | SD | ||
| NR1H3 | SNV | Missense_Mutation | rs565653980 | c.776N>A | p.Arg259His | p.R259H | protein_coding | deleterious(0.05) | possibly_damaging(0.589) | TCGA-CM-6171-01 | Colorectum | colon adenocarcinoma | Female | >=65 | I/II | Unknown | Unknown | SD | |
| NR1H3 | SNV | Missense_Mutation | c.385N>T | p.Arg129Cys | p.R129C | protein_coding | deleterious(0) | probably_damaging(1) | TCGA-D5-6541-01 | Colorectum | colon adenocarcinoma | Male | <65 | I/II | Unknown | Unknown | SD | ||
| NR1H3 | SNV | Missense_Mutation | rs556085486 | c.899N>T | p.Ala300Val | p.A300V | protein_coding | deleterious(0) | benign(0.071) | TCGA-G4-6309-01 | Colorectum | colon adenocarcinoma | Female | <65 | III/IV | Chemotherapy | xeloda | PD | |
| NR1H3 | deletion | Frame_Shift_Del | c.271delN | p.Lys92ArgfsTer28 | p.K92Rfs*28 | protein_coding | TCGA-CM-6674-01 | Colorectum | colon adenocarcinoma | Male | <65 | I/II | Unknown | Unknown | SD | ||||
| NR1H3 | insertion | Frame_Shift_Ins | novel | c.600dupC | p.Arg201GlnfsTer31 | p.R201Qfs*31 | protein_coding | TCGA-G4-6628-01 | Colorectum | colon adenocarcinoma | Male | >=65 | I/II | Unknown | Unknown | SD |
| Page: 1 2 3 4 5 |
Top |
Related drugs of malignant transformation related genes |
| Identification of chemicals and drugs interact with genes involved in malignant transfromation |
| (DGIdb 4.0) |
| Entrez ID | Symbol | Category | Interaction Types | Drug Claim Name | Drug Name | PMIDs |
| 10062 | NR1H3 | DRUGGABLE GENOME, NUCLEAR HORMONE RECEPTOR | US9006244, E2a | |||
| 10062 | NR1H3 | DRUGGABLE GENOME, NUCLEAR HORMONE RECEPTOR | US9073931, E3 | |||
| 10062 | NR1H3 | DRUGGABLE GENOME, NUCLEAR HORMONE RECEPTOR | GSK9772 | CHEMBL493241 | 18800767,22873709 | |
| 10062 | NR1H3 | DRUGGABLE GENOME, NUCLEAR HORMONE RECEPTOR | agonist | 135651391 | ||
| 10062 | NR1H3 | DRUGGABLE GENOME, NUCLEAR HORMONE RECEPTOR | T091317 | T091317 | 22579484,24480357,24268541 | |
| 10062 | NR1H3 | DRUGGABLE GENOME, NUCLEAR HORMONE RECEPTOR | agonist | 375973222 | ||
| 10062 | NR1H3 | DRUGGABLE GENOME, NUCLEAR HORMONE RECEPTOR | agonist | 135650789 | PAXILLINE | |
| 10062 | NR1H3 | DRUGGABLE GENOME, NUCLEAR HORMONE RECEPTOR | agonist | 135649888 | ||
| 10062 | NR1H3 | DRUGGABLE GENOME, NUCLEAR HORMONE RECEPTOR | BDBM50177019 | |||
| 10062 | NR1H3 | DRUGGABLE GENOME, NUCLEAR HORMONE RECEPTOR | US9006244, E2b |
| Page: 1 2 3 4 |

Copyright 2023-Present -The University of Texas Health Science Center at Houston |