Schematic overview of the cellular and molecular mechanisms involved in the cancer progression, including the proposed cellular and molecular mechanisms in cancer cells trajectory. AT1: alveolar type 1 cells; AT2: alveolar type 2 cells; AAH: atypical adenomatous hyperplasia; AIS: adenocarcinoma in situ; MIA: minimally invasive adenocarcinoma; IA: invasive adenocarcinoma; EMT: epithelial-mesenchymal transition

Home

Download

Statistics

Help

Contact

Center for Computational Systems Medicine
leaf

Gene summary

leaf

Malignant transformation analysis

leaf

Malignant transformation related pathway analysis

leaf

Cell-cell communication analysis

leaf

Single-cell gene regulatory network inference analysis

leaf

Somatic mutation of malignant transformation related genes

leaf

Related drugs of malignant transformation related genes

Gene: NR1H2

Gene summary for NR1H2

check button Gene summary.

Gene informationSpeciesHuman
Gene symbol

NR1H2

Gene ID

7376

Gene namenuclear receptor subfamily 1 group H member 2
Gene AliasLXR-b
Cytomap19q13.33
Gene Typeprotein-coding
GO ID

GO:0000122

UniProtAcc

P55055


Top

Malignant transformation analysis

check button Identification of the aberrant gene expression in precancerous and cancerous lesions by comparing the gene expression of stem-like cells in diseased tissues with normal stem cells
check button Malignant transformation involving gene list.
Entrez IDSymbolReplicatesSpeciesOrganTissueAdj P-valueLog2FCMalignancy
7376NR1H2LZE2DHumanEsophagusHGIN8.09e-032.42e-010.0642
7376NR1H2LZE4THumanEsophagusESCC4.08e-143.38e-010.0811
7376NR1H2LZE7THumanEsophagusESCC5.33e-105.36e-010.0667
7376NR1H2LZE8THumanEsophagusESCC3.25e-153.16e-010.067
7376NR1H2LZE20THumanEsophagusESCC1.52e-051.66e-010.0662
7376NR1H2LZE22D1HumanEsophagusHGIN8.83e-031.55e-010.0595
7376NR1H2LZE22THumanEsophagusESCC4.29e-055.37e-010.068
7376NR1H2LZE24THumanEsophagusESCC7.40e-308.11e-010.0596
7376NR1H2LZE21THumanEsophagusESCC1.46e-022.08e-010.0655
7376NR1H2LZE6THumanEsophagusESCC2.91e-054.79e-010.0845
7376NR1H2P1T-EHumanEsophagusESCC4.90e-145.47e-010.0875
7376NR1H2P2T-EHumanEsophagusESCC1.58e-315.36e-010.1177
7376NR1H2P4T-EHumanEsophagusESCC1.08e-265.69e-010.1323
7376NR1H2P5T-EHumanEsophagusESCC2.44e-141.89e-010.1327
7376NR1H2P8T-EHumanEsophagusESCC1.55e-641.33e+000.0889
7376NR1H2P9T-EHumanEsophagusESCC5.81e-225.24e-010.1131
7376NR1H2P10T-EHumanEsophagusESCC8.68e-437.94e-010.116
7376NR1H2P11T-EHumanEsophagusESCC3.25e-278.98e-010.1426
7376NR1H2P12T-EHumanEsophagusESCC4.34e-254.13e-010.1122
7376NR1H2P15T-EHumanEsophagusESCC2.91e-326.83e-010.1149
Page: 1 2 3 4 5 6 

check button Transcriptomic changes along malignancy continuum.
TissueExpression DynamicsAbbreviation
EsophagusThe image shows the transcriptomic changes along malignancy continuum.log2FC in expression of this searched gene in stem-like cells from each diseased tissue sample relative to stem-like cells in normal samples in each tissue plotted against the malignancy continuum. Samples are colored based on if they are from different disease stage.
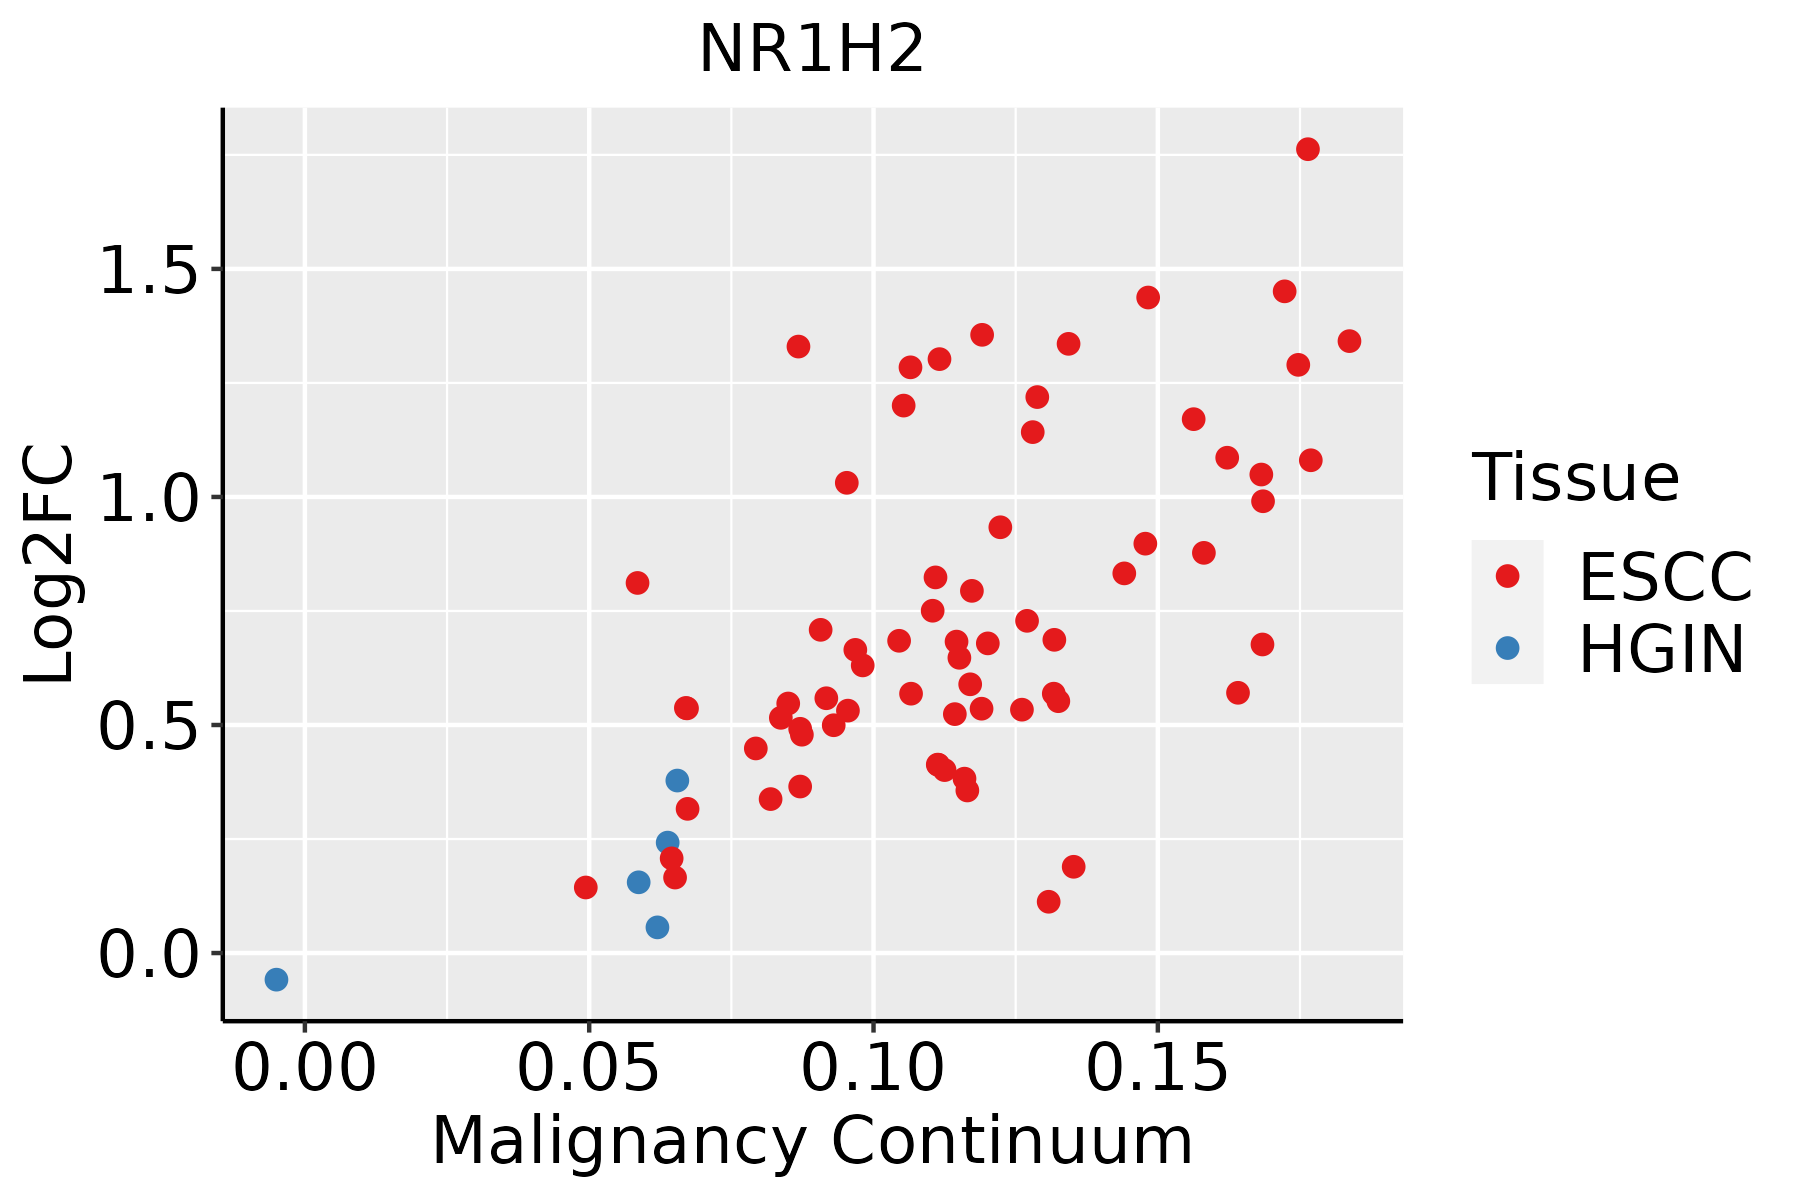
ESCC: Esophageal squamous cell carcinoma
HGIN: High-grade intraepithelial neoplasias
LGIN: Low-grade intraepithelial neoplasias
LiverThe image shows the transcriptomic changes along malignancy continuum.log2FC in expression of this searched gene in stem-like cells from each diseased tissue sample relative to stem-like cells in normal samples in each tissue plotted against the malignancy continuum. Samples are colored based on if they are from different disease stage.
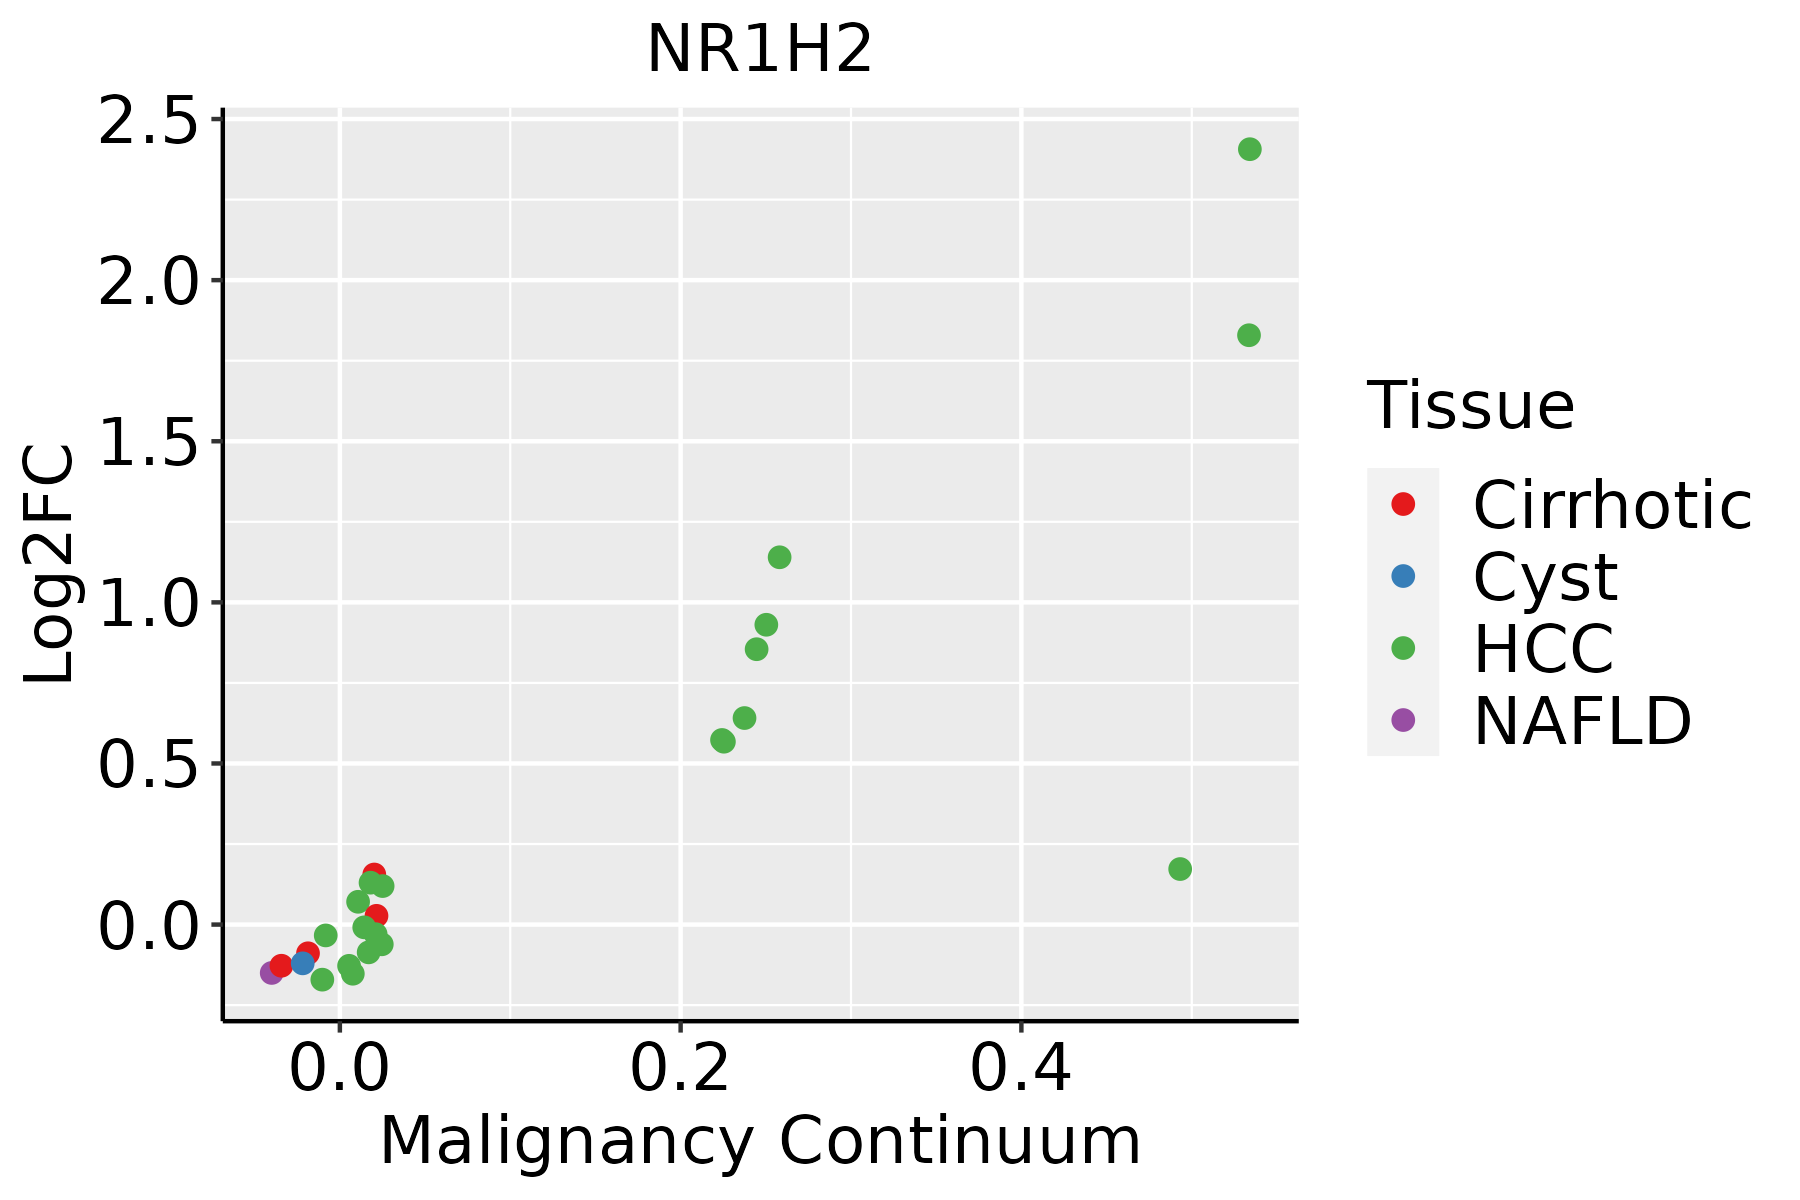
HCC: Hepatocellular carcinoma
NAFLD: Non-alcoholic fatty liver disease
Oral CavityThe image shows the transcriptomic changes along malignancy continuum.log2FC in expression of this searched gene in stem-like cells from each diseased tissue sample relative to stem-like cells in normal samples in each tissue plotted against the malignancy continuum. Samples are colored based on if they are from different disease stage.
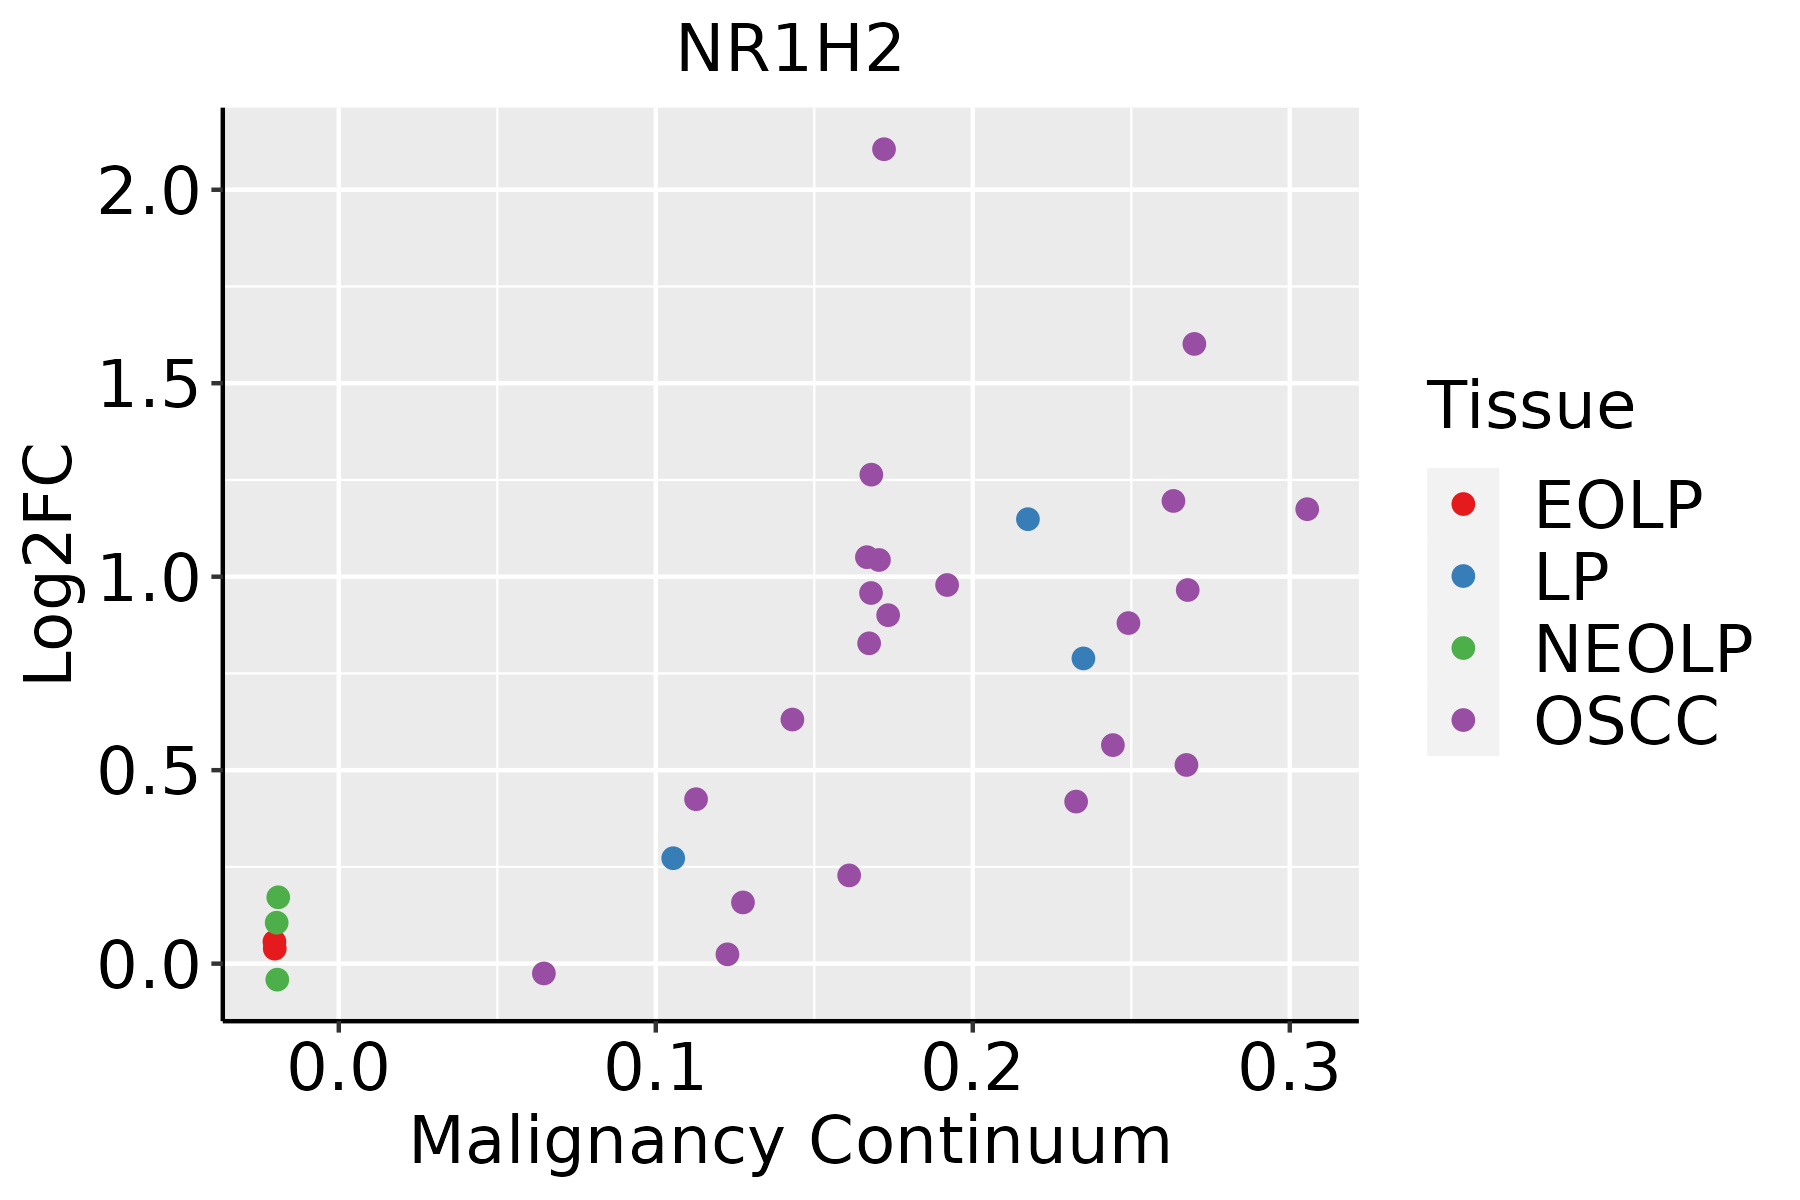
EOLP: Erosive Oral lichen planus
LP: leukoplakia
NEOLP: Non-erosive oral lichen planus
OSCC: Oral squamous cell carcinoma
SkinThe image shows the transcriptomic changes along malignancy continuum.log2FC in expression of this searched gene in stem-like cells from each diseased tissue sample relative to stem-like cells in normal samples in each tissue plotted against the malignancy continuum. Samples are colored based on if they are from different disease stage.
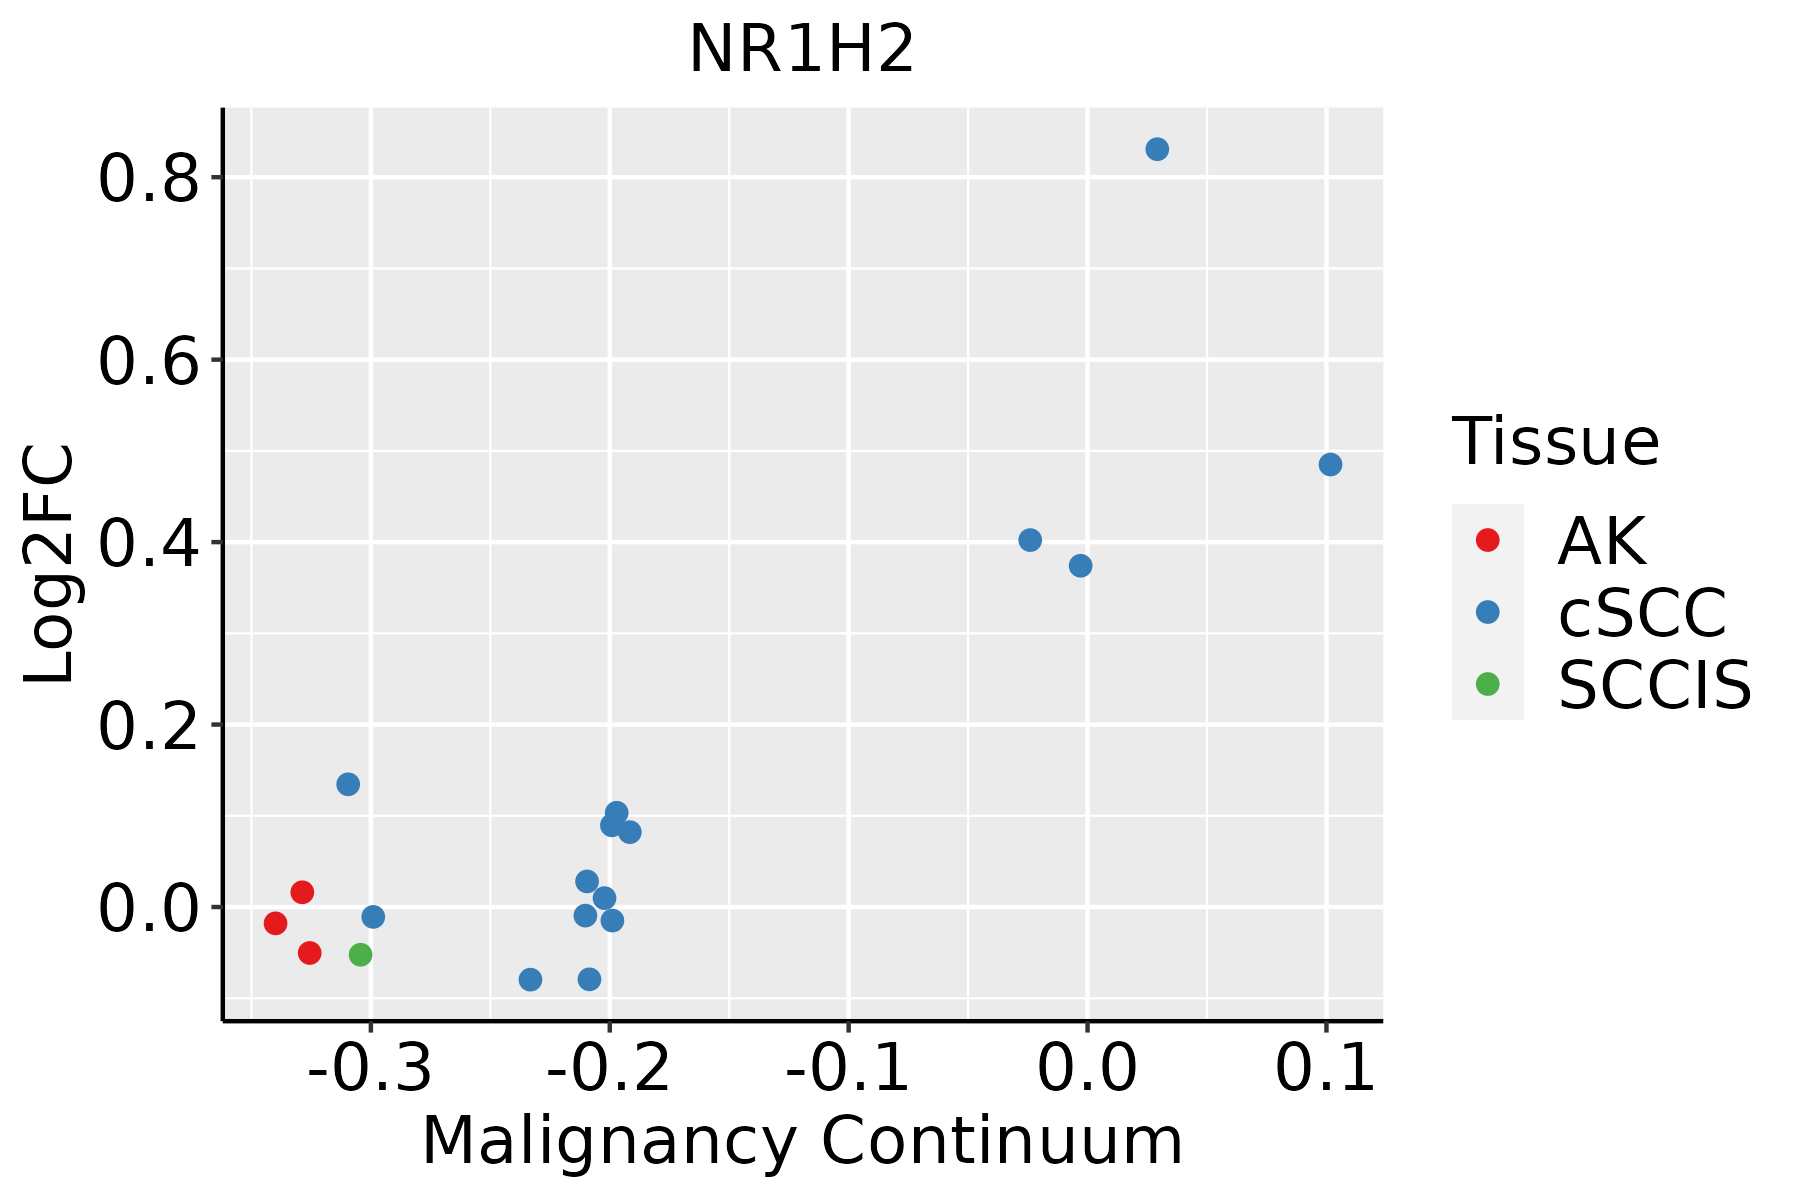
AK: Actinic keratosis
cSCC: Cutaneous squamous cell carcinoma
SCCIS:squamous cell carcinoma in situ
ThyroidThe image shows the transcriptomic changes along malignancy continuum.log2FC in expression of this searched gene in stem-like cells from each diseased tissue sample relative to stem-like cells in normal samples in each tissue plotted against the malignancy continuum. Samples are colored based on if they are from different disease stage.ATC: Anaplastic thyroid cancer
HT: Hashimoto's thyroiditis
PTC: Papillary thyroid cancer
∗log2FC in expression of this searched gene in stem-like cells from each diseased tissue sample relative to stem-like cells in normal samples in each tissue plotted against the malignancy continuum. Samples are colored based on if they are from different disease stage.

Top

Malignant transformation related pathway analysis

check buttonFind out the enriched GO biological processes and KEGG pathways involved in transition from healthy to precancer to cancer
check button Figure of enriched GO biological processes.
TissueDisease StageEnriched GO biological Processes
ColorectumADGO analysis - Figure of enriched GO biological processes: Top 15 enriched GO BP terms are showed in the bar plot of each disease state in each tissue. Each row represents a significant GO biological process which is colored according to the -log10(p.adjust).
ColorectumSERGO analysis - Figure of enriched GO biological processes: Top 15 enriched GO BP terms are showed in the bar plot of each disease state in each tissue. Each row represents a significant GO biological process which is colored according to the -log10(p.adjust).
ColorectumMSSGO analysis - Figure of enriched GO biological processes: Top 15 enriched GO BP terms are showed in the bar plot of each disease state in each tissue. Each row represents a significant GO biological process which is colored according to the -log10(p.adjust).
ColorectumMSI-HGO analysis - Figure of enriched GO biological processes: Top 15 enriched GO BP terms are showed in the bar plot of each disease state in each tissue. Each row represents a significant GO biological process which is colored according to the -log10(p.adjust).
ColorectumFAPGO analysis - Figure of enriched GO biological processes: Top 15 enriched GO BP terms are showed in the bar plot of each disease state in each tissue. Each row represents a significant GO biological process which is colored according to the -log10(p.adjust).
∗Top 15 enriched GO BP terms are showed in the bar plot of each disease state in each tissue. Each row represents a significant GO biological process which is colored according to the -log10(p.adjust).
Page: 1 2 3 4 5 6 7 8 9 

check button Enriched GO biological processes.
GO IDTissueDisease StageDescriptionGene RatioBg Ratiopvaluep.adjustCount
GO:003497625EsophagusHGINresponse to endoplasmic reticulum stress81/2587256/187231.47e-132.32e-1181
GO:190589725EsophagusHGINregulation of response to endoplasmic reticulum stress31/258782/187235.25e-082.91e-0631
GO:003133425EsophagusHGINpositive regulation of protein-containing complex assembly61/2587237/187237.10e-073.00e-0561
GO:004325427EsophagusHGINregulation of protein-containing complex assembly94/2587428/187232.39e-068.55e-0594
GO:190495120EsophagusHGINpositive regulation of establishment of protein localization73/2587319/187236.99e-062.14e-0473
GO:190357320EsophagusHGINnegative regulation of response to endoplasmic reticulum stress18/258744/187238.97e-062.64e-0418
GO:003052220EsophagusHGINintracellular receptor signaling pathway62/2587265/187231.63e-054.50e-0462
GO:005123520EsophagusHGINmaintenance of location73/2587327/187231.73e-054.71e-0473
GO:005122220EsophagusHGINpositive regulation of protein transport67/2587303/187235.13e-051.22e-0367
GO:003166726EsophagusHGINresponse to nutrient levels89/2587474/187231.41e-031.64e-0289
GO:00483844EsophagusHGINretinoic acid receptor signaling pathway11/258731/187232.02e-032.12e-0211
GO:004586126EsophagusHGINnegative regulation of proteolysis68/2587351/187232.21e-032.28e-0268
GO:00028325EsophagusHGINnegative regulation of response to biotic stimulus25/2587108/187235.87e-034.77e-0225
GO:0034976111EsophagusESCCresponse to endoplasmic reticulum stress192/8552256/187237.15e-221.30e-19192
GO:0043254111EsophagusESCCregulation of protein-containing complex assembly278/8552428/187233.81e-162.77e-14278
GO:1904951111EsophagusESCCpositive regulation of establishment of protein localization216/8552319/187231.01e-156.86e-14216
GO:0051222111EsophagusESCCpositive regulation of protein transport204/8552303/187231.56e-148.38e-13204
GO:0031334111EsophagusESCCpositive regulation of protein-containing complex assembly166/8552237/187232.06e-141.07e-12166
GO:0031667111EsophagusESCCresponse to nutrient levels289/8552474/187239.25e-123.47e-10289
GO:0030522110EsophagusESCCintracellular receptor signaling pathway170/8552265/187238.58e-102.09e-08170
Page: 1 2 3 4 5 6 7 8 9 10 11 12 13 14 15 16 17 18 19 20 

check button Enriched KEGG pathways.
Pathway IDTissueDisease StageDescriptionGene RatioBg Ratiopvaluep.adjustqvalueCount
hsa049318EsophagusESCCInsulin resistance69/4205108/84651.92e-035.54e-032.84e-0369
hsa0493113EsophagusESCCInsulin resistance69/4205108/84651.92e-035.54e-032.84e-0369
hsa0493121LiverHCCInsulin resistance77/4020108/84653.89e-074.46e-062.48e-0677
hsa0493131LiverHCCInsulin resistance77/4020108/84653.89e-074.46e-062.48e-0677
hsa049317Oral cavityOSCCInsulin resistance60/3704108/84658.66e-031.97e-021.00e-0260
hsa0493112Oral cavityOSCCInsulin resistance60/3704108/84658.66e-031.97e-021.00e-0260
Page: 1 

Top

Cell-cell communication analysis

check buttonIdentification of potential cell-cell interactions between two cell types and their ligand-receptor pairs for different disease states
LigandReceptorLRpairPathwayTissueDisease Stage
Page: 1 

Top

Single-cell gene regulatory network inference analysis

check buttonFind out the significant the regulons (TFs) and the target genes of each regulon across cell types for different disease states
TFCell TypeTissueDisease StageTarget GeneRSSRegulon Activity
NR1H2M1MACCervixADJLRRN3,CPB2-AS1,PTN, etc.1.33e-01The dot plots of a searched regulon are shown for all cell subpopulations in each disease state of each tissue based on the regulon specific score inferred using pySCENIC and by calculating the average expression.
NR1H2M2MACCervixADJLRRN3,CPB2-AS1,PTN, etc.1.88e-01The dot plots of a searched regulon are shown for all cell subpopulations in each disease state of each tissue based on the regulon specific score inferred using pySCENIC and by calculating the average expression.
NR1H2CD8TEXINTCervixADJLRRN3,CPB2-AS1,PTN, etc.6.29e-03The dot plots of a searched regulon are shown for all cell subpopulations in each disease state of each tissue based on the regulon specific score inferred using pySCENIC and by calculating the average expression.
NR1H2M1MACCervixCCLRRN3,CPB2-AS1,PTN, etc.4.87e-02The dot plots of a searched regulon are shown for all cell subpopulations in each disease state of each tissue based on the regulon specific score inferred using pySCENIC and by calculating the average expression.
NR1H2CD8TCMCervixCCLRRN3,CPB2-AS1,PTN, etc.7.56e-02The dot plots of a searched regulon are shown for all cell subpopulations in each disease state of each tissue based on the regulon specific score inferred using pySCENIC and by calculating the average expression.
NR1H2INMONCervixCCLRRN3,CPB2-AS1,PTN, etc.1.73e-01The dot plots of a searched regulon are shown for all cell subpopulations in each disease state of each tissue based on the regulon specific score inferred using pySCENIC and by calculating the average expression.
NR1H2MONCervixCCLRRN3,CPB2-AS1,PTN, etc.1.54e-01The dot plots of a searched regulon are shown for all cell subpopulations in each disease state of each tissue based on the regulon specific score inferred using pySCENIC and by calculating the average expression.
NR1H2NEUTCervixCCLRRN3,CPB2-AS1,PTN, etc.1.26e-01The dot plots of a searched regulon are shown for all cell subpopulations in each disease state of each tissue based on the regulon specific score inferred using pySCENIC and by calculating the average expression.
NR1H2M2MACCervixHealthyLRRN3,CPB2-AS1,PTN, etc.1.38e-02The dot plots of a searched regulon are shown for all cell subpopulations in each disease state of each tissue based on the regulon specific score inferred using pySCENIC and by calculating the average expression.
NR1H2INMONCervixHealthyLRRN3,CPB2-AS1,PTN, etc.2.12e-02The dot plots of a searched regulon are shown for all cell subpopulations in each disease state of each tissue based on the regulon specific score inferred using pySCENIC and by calculating the average expression.
∗The dot plots of a searched regulon are shown for all cell subpopulations in each disease state of each tissue based on the regulon specific score inferred using pySCENIC and by calculating the average expression.
Page: 1 2 3 4 5 

Top

Somatic mutation of malignant transformation related genes

check buttonAnnotation of somatic variants for genes involved in malignant transformation
Hugo SymbolVariant ClassVariant ClassificationdbSNP RSHGVScHGVSpHGVSp ShortSWISSPROTBIOTYPESIFTPolyPhenTumor Sample BarcodeTissueHistologySexAgeStageTherapy TypesDrugsOutcome
NR1H2SNVMissense_Mutationc.796N>Tp.Arg266Cysp.R266CP55055protein_codingdeleterious(0)probably_damaging(0.998)TCGA-A8-A08Z-01Breastbreast invasive carcinomaFemale>=65III/IVUnknownUnknownSD
NR1H2SNVMissense_Mutationrs140558724c.643N>Ap.Glu215Lysp.E215KP55055protein_codingtolerated(0.74)benign(0.029)TCGA-AN-A046-01Breastbreast invasive carcinomaFemale>=65I/IIUnknownUnknownSD
NR1H2SNVMissense_Mutationrs750204613c.376N>Tp.Arg126Trpp.R126WP55055protein_codingdeleterious(0)probably_damaging(0.97)TCGA-C8-A12M-01Breastbreast invasive carcinomaFemale>=65I/IIUnknownUnknownSD
NR1H2SNVMissense_Mutationc.1049A>Tp.Asn350Ilep.N350IP55055protein_codingdeleterious(0)possibly_damaging(0.881)TCGA-E2-A15E-01Breastbreast invasive carcinomaFemale<65I/IIChemotherapydoxorubicinSD
NR1H2SNVMissense_Mutationc.253N>Ap.Glu85Lysp.E85KP55055protein_codingdeleterious(0)probably_damaging(0.994)TCGA-2W-A8YY-01Cervixcervical & endocervical cancerFemale<65I/IIChemotherapycisplatinCR
NR1H2SNVMissense_Mutationrs763608025c.788N>Ap.Arg263Hisp.R263HP55055protein_codingtolerated(0.1)benign(0.086)TCGA-2W-A8YY-01Cervixcervical & endocervical cancerFemale<65I/IIChemotherapycisplatinCR
NR1H2SNVMissense_Mutationc.254N>Cp.Glu85Alap.E85AP55055protein_codingdeleterious(0)probably_damaging(0.999)TCGA-FU-A3HZ-01Cervixcervical & endocervical cancerFemale<65I/IIChemotherapycisplatinCR
NR1H2SNVMissense_Mutationrs771140870c.341N>Ap.Ser114Asnp.S114NP55055protein_codingdeleterious(0)probably_damaging(0.999)TCGA-MA-AA43-01Cervixcervical & endocervical cancerFemale<65III/IVUnknownUnknownSD
NR1H2SNVMissense_Mutationc.659C>Tp.Thr220Ilep.T220IP55055protein_codingdeleterious(0.02)benign(0.302)TCGA-MY-A5BF-01Cervixcervical & endocervical cancerFemale>=65I/IIChemotherapycisplatinCR
NR1H2SNVMissense_Mutationrs772224466c.67N>Ap.Ala23Thrp.A23TP55055protein_codingtolerated(0.76)benign(0)TCGA-A6-3809-01Colorectumcolon adenocarcinomaFemale>=65I/IIUnknownUnknownSD
Page: 1 2 3 4 

Top

Related drugs of malignant transformation related genes

check buttonIdentification of chemicals and drugs interact with genes involved in malignant transfromation
(DGIdb 4.0)
Entrez IDSymbolCategoryInteraction TypesDrug Claim NameDrug NamePMIDs
7376NR1H2NUCLEAR HORMONE RECEPTOR, DRUGGABLE GENOMEagonist135651470DESMOSTEROL
7376NR1H2NUCLEAR HORMONE RECEPTOR, DRUGGABLE GENOMEagonist223366058
7376NR1H2NUCLEAR HORMONE RECEPTOR, DRUGGABLE GENOMEGW3965CHEMBL5903018800767
7376NR1H2NUCLEAR HORMONE RECEPTOR, DRUGGABLE GENOMEagonist135651391
7376NR1H2NUCLEAR HORMONE RECEPTOR, DRUGGABLE GENOMEDESMOSTEROLDESMOSTEROL23910990
7376NR1H2NUCLEAR HORMONE RECEPTOR, DRUGGABLE GENOMEagonist135650496
7376NR1H2NUCLEAR HORMONE RECEPTOR, DRUGGABLE GENOMEVTB-38543
7376NR1H2NUCLEAR HORMONE RECEPTOR, DRUGGABLE GENOMEagonist135651390
7376NR1H2NUCLEAR HORMONE RECEPTOR, DRUGGABLE GENOMEagonistCHEMBL3545418BMS-779788
7376NR1H2NUCLEAR HORMONE RECEPTOR, DRUGGABLE GENOMEagonistCHEMBL3545238CS-8080
Page: 1 2 3