
|
|||||
|
 | |
| |
| |
| |
| |
| |
|
Gene: NR1D2 |
Gene summary for NR1D2 |
| Gene information | Species | Human | Gene symbol | NR1D2 | Gene ID | 9975 |
| Gene name | nuclear receptor subfamily 1 group D member 2 | |
| Gene Alias | BD73 | |
| Cytomap | 3p24.2 | |
| Gene Type | protein-coding | GO ID | GO:0000122 | UniProtAcc | B4DXD3 |
Top |
Malignant transformation analysis |
| Identification of the aberrant gene expression in precancerous and cancerous lesions by comparing the gene expression of stem-like cells in diseased tissues with normal stem cells |
| Entrez ID | Symbol | Replicates | Species | Organ | Tissue | Adj P-value | Log2FC | Malignancy |
| 9975 | NR1D2 | CA_HPV_3 | Human | Cervix | CC | 3.84e-04 | 2.01e-01 | 0.0414 |
| 9975 | NR1D2 | CCI_2 | Human | Cervix | CC | 8.76e-07 | 7.67e-01 | 0.5249 |
| 9975 | NR1D2 | CCI_3 | Human | Cervix | CC | 6.63e-05 | 5.46e-01 | 0.516 |
| 9975 | NR1D2 | LZE4T | Human | Esophagus | ESCC | 2.25e-04 | -8.07e-02 | 0.0811 |
| 9975 | NR1D2 | LZE7T | Human | Esophagus | ESCC | 1.07e-02 | 1.29e-01 | 0.0667 |
| 9975 | NR1D2 | LZE24T | Human | Esophagus | ESCC | 1.93e-06 | 1.87e-01 | 0.0596 |
| 9975 | NR1D2 | P1T-E | Human | Esophagus | ESCC | 4.25e-02 | 2.72e-01 | 0.0875 |
| 9975 | NR1D2 | P2T-E | Human | Esophagus | ESCC | 2.83e-20 | 3.72e-01 | 0.1177 |
| 9975 | NR1D2 | P4T-E | Human | Esophagus | ESCC | 8.81e-09 | 3.06e-01 | 0.1323 |
| 9975 | NR1D2 | P8T-E | Human | Esophagus | ESCC | 1.50e-13 | 2.86e-01 | 0.0889 |
| 9975 | NR1D2 | P9T-E | Human | Esophagus | ESCC | 9.60e-11 | 9.81e-02 | 0.1131 |
| 9975 | NR1D2 | P10T-E | Human | Esophagus | ESCC | 1.83e-08 | 2.35e-01 | 0.116 |
| 9975 | NR1D2 | P11T-E | Human | Esophagus | ESCC | 4.13e-02 | 5.77e-02 | 0.1426 |
| 9975 | NR1D2 | P12T-E | Human | Esophagus | ESCC | 2.35e-04 | 2.20e-01 | 0.1122 |
| 9975 | NR1D2 | P15T-E | Human | Esophagus | ESCC | 7.24e-15 | 1.78e-01 | 0.1149 |
| 9975 | NR1D2 | P16T-E | Human | Esophagus | ESCC | 4.76e-15 | 6.30e-02 | 0.1153 |
| 9975 | NR1D2 | P17T-E | Human | Esophagus | ESCC | 1.82e-04 | 1.58e-02 | 0.1278 |
| 9975 | NR1D2 | P20T-E | Human | Esophagus | ESCC | 3.29e-18 | 3.30e-01 | 0.1124 |
| 9975 | NR1D2 | P21T-E | Human | Esophagus | ESCC | 4.00e-08 | 7.24e-02 | 0.1617 |
| 9975 | NR1D2 | P22T-E | Human | Esophagus | ESCC | 2.68e-13 | 4.99e-02 | 0.1236 |
| Page: 1 2 3 4 5 |
| Tissue | Expression Dynamics | Abbreviation |
| Cervix | 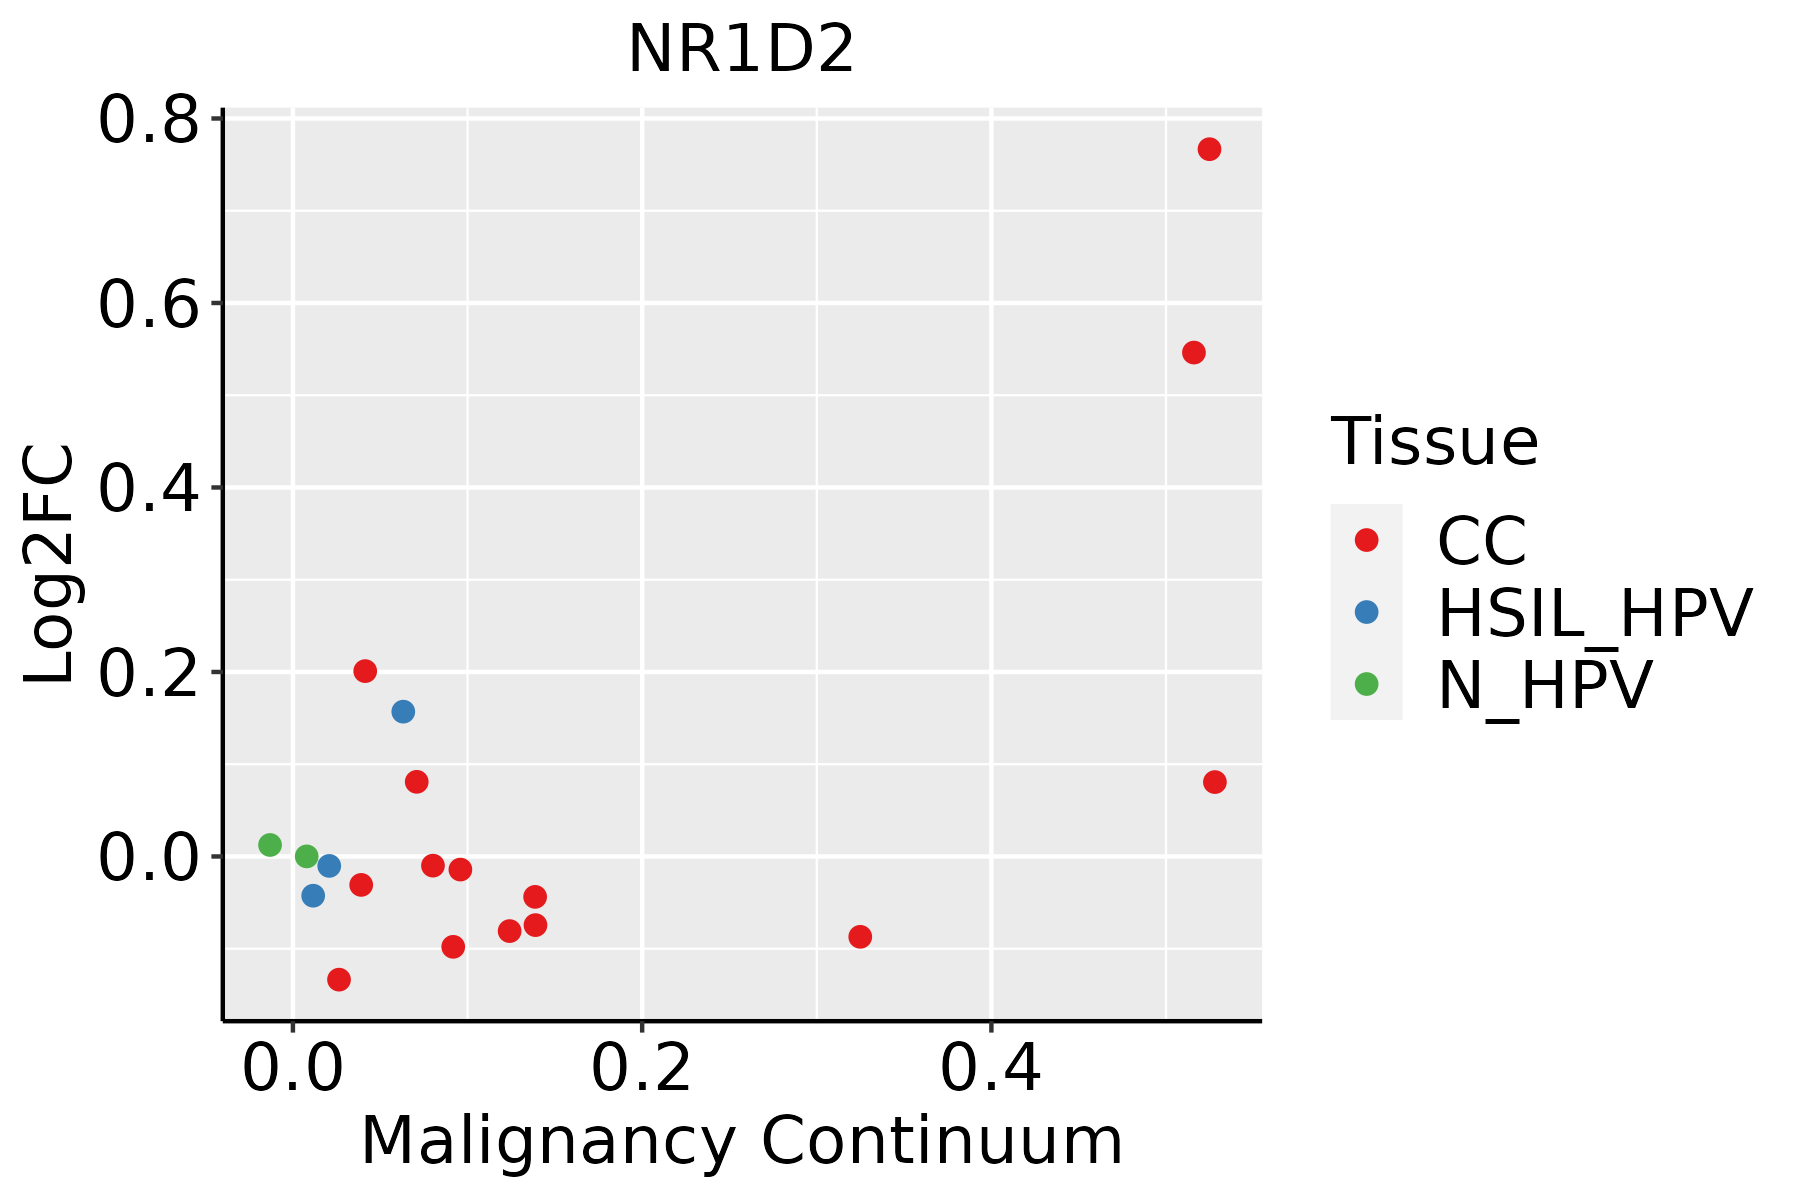 | CC: Cervix cancer |
| HSIL_HPV: HPV-infected high-grade squamous intraepithelial lesions | ||
| N_HPV: HPV-infected normal cervix | ||
| Esophagus | 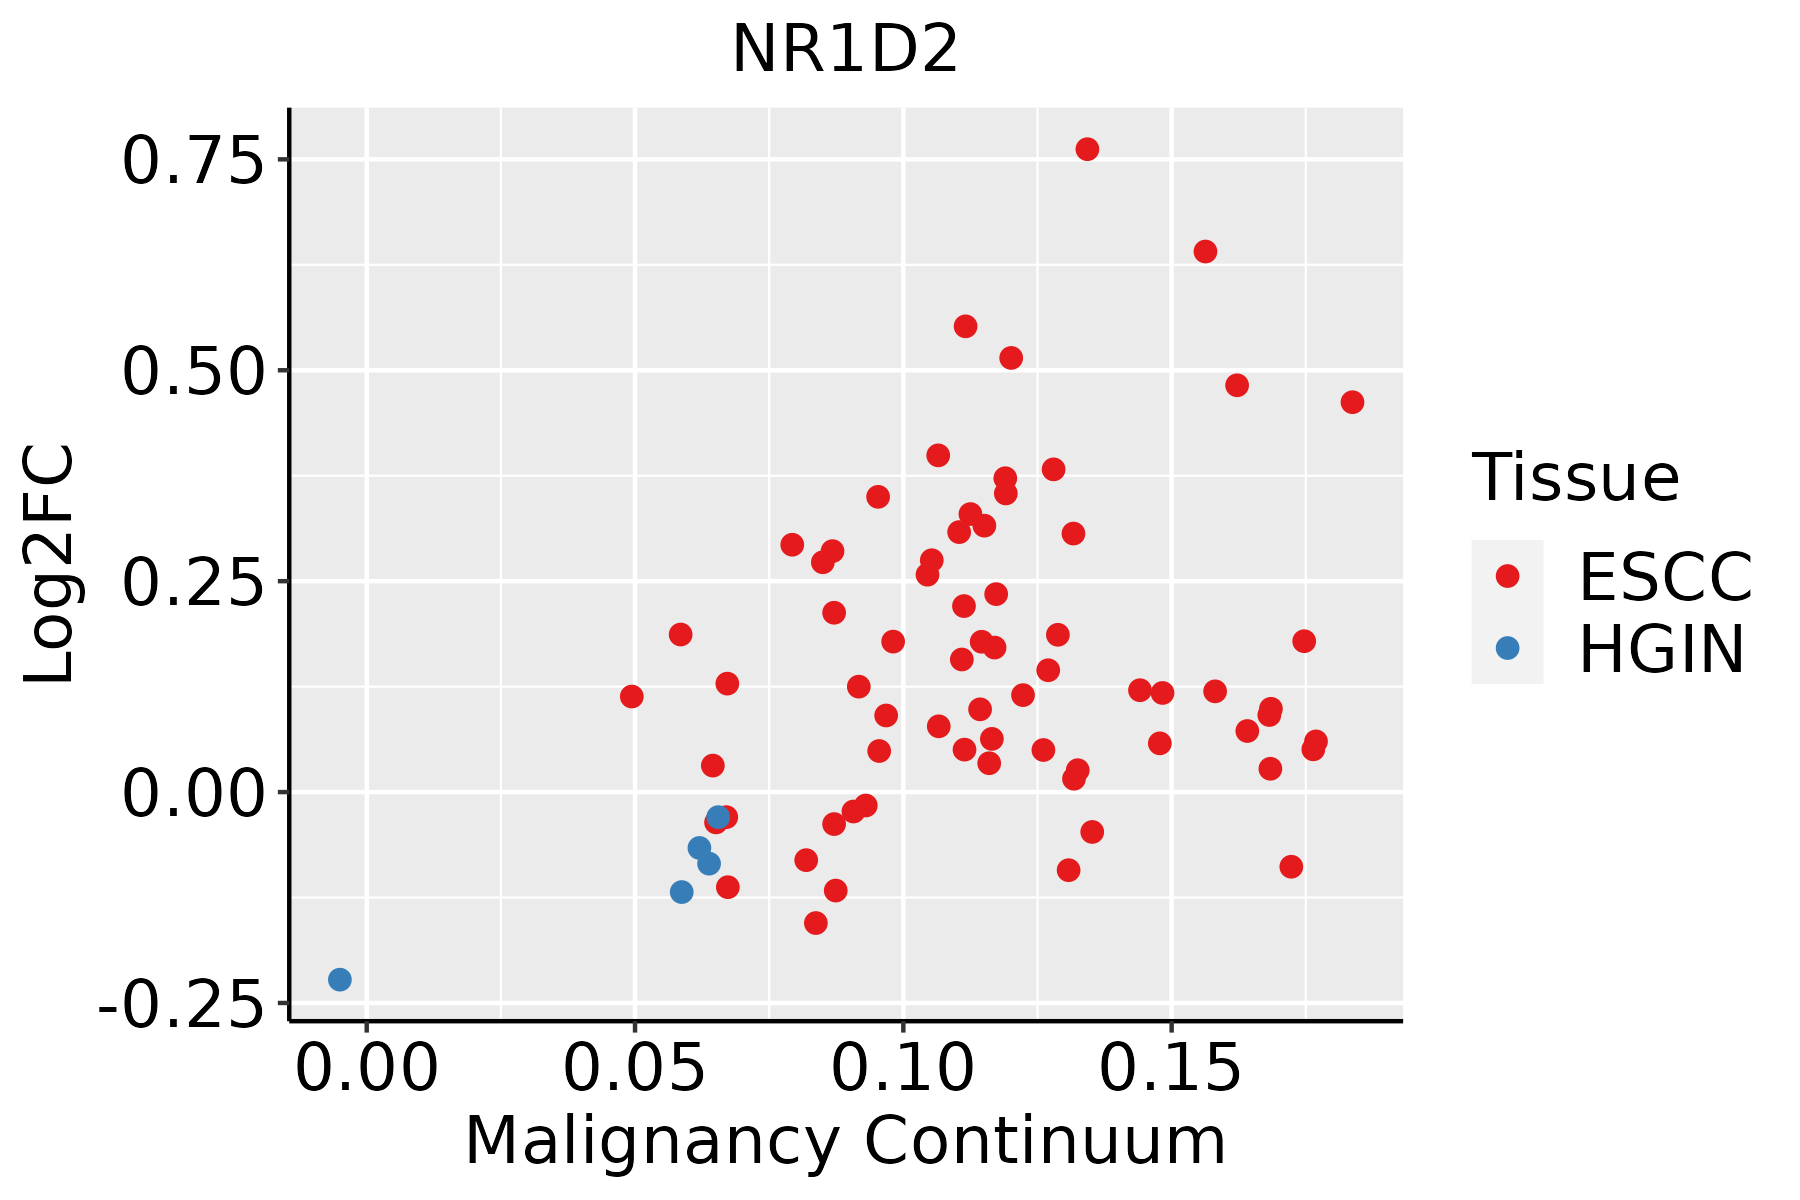 | ESCC: Esophageal squamous cell carcinoma |
| HGIN: High-grade intraepithelial neoplasias | ||
| LGIN: Low-grade intraepithelial neoplasias | ||
| Liver | 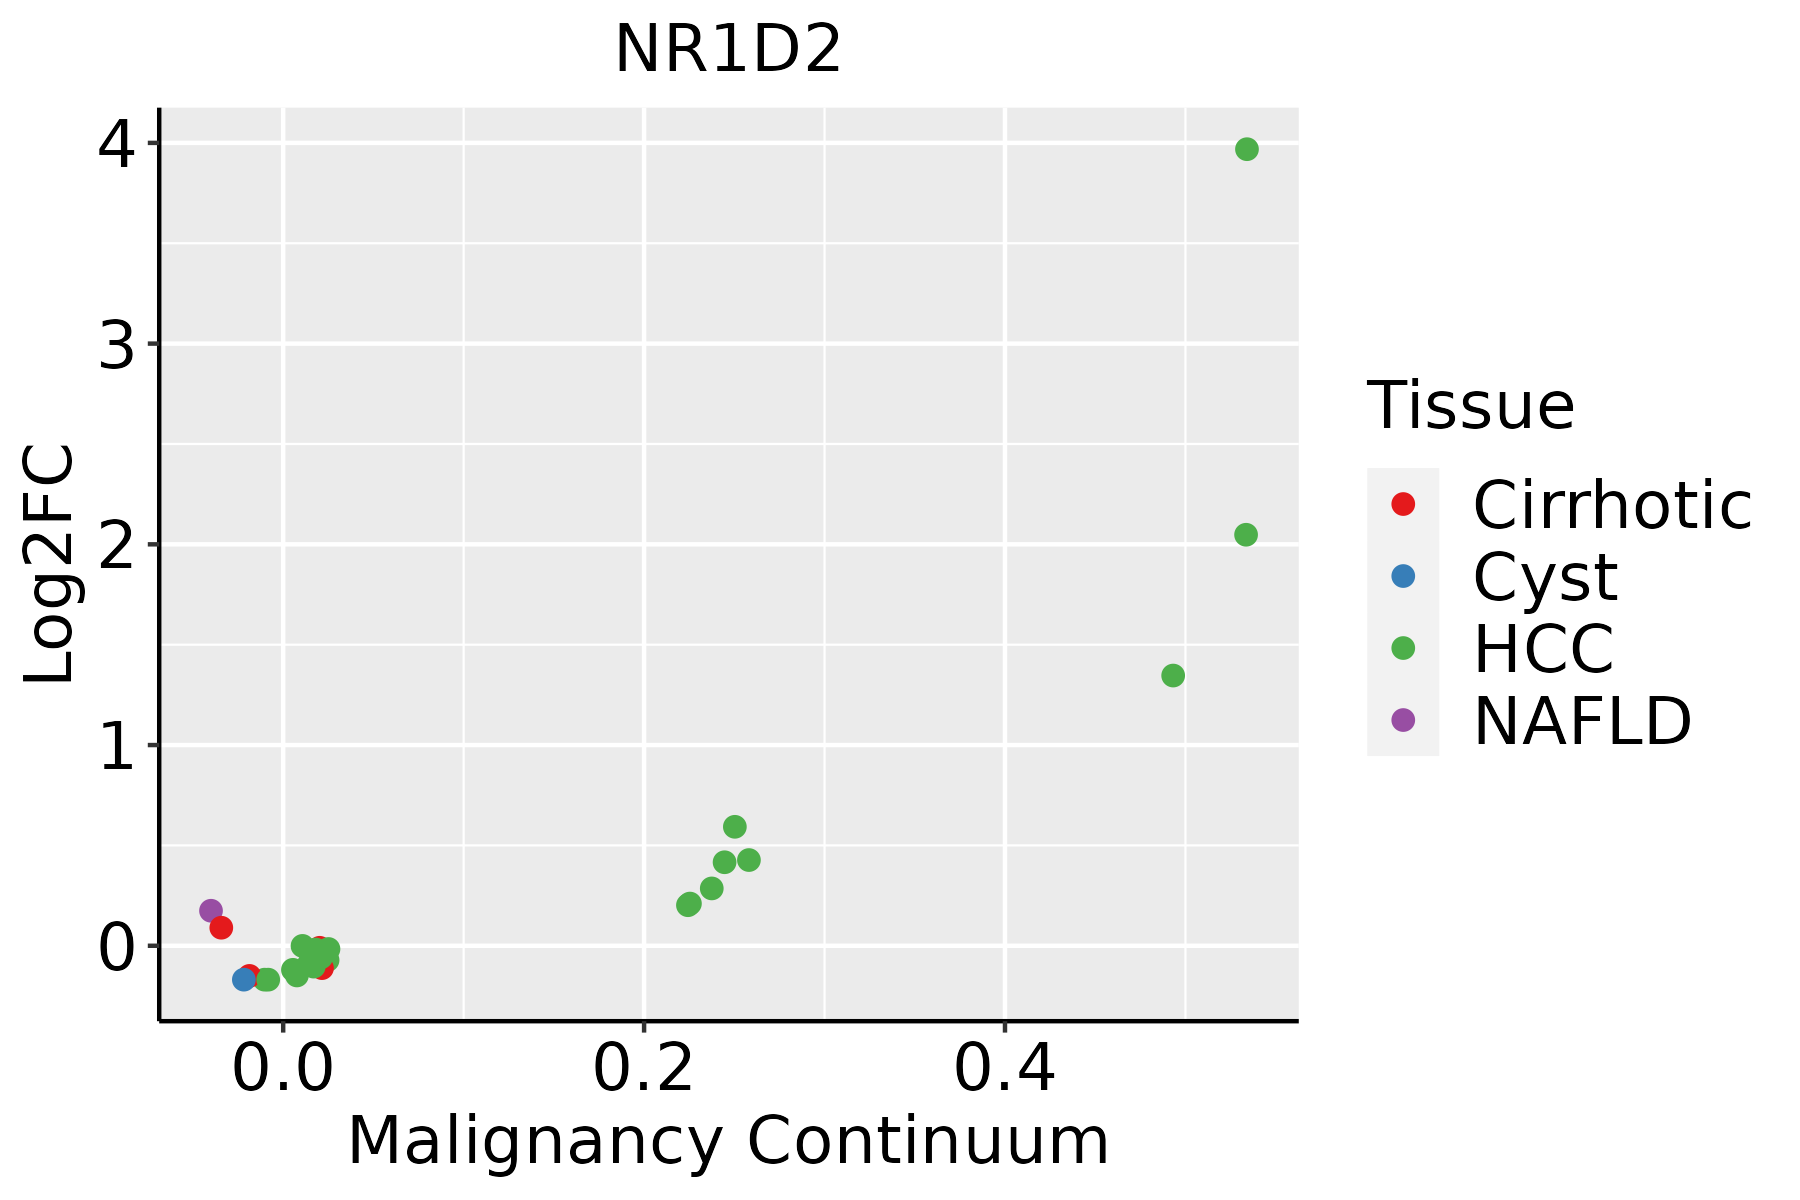 | HCC: Hepatocellular carcinoma |
| NAFLD: Non-alcoholic fatty liver disease | ||
| Prostate |  | BPH: Benign Prostatic Hyperplasia |
| Skin | 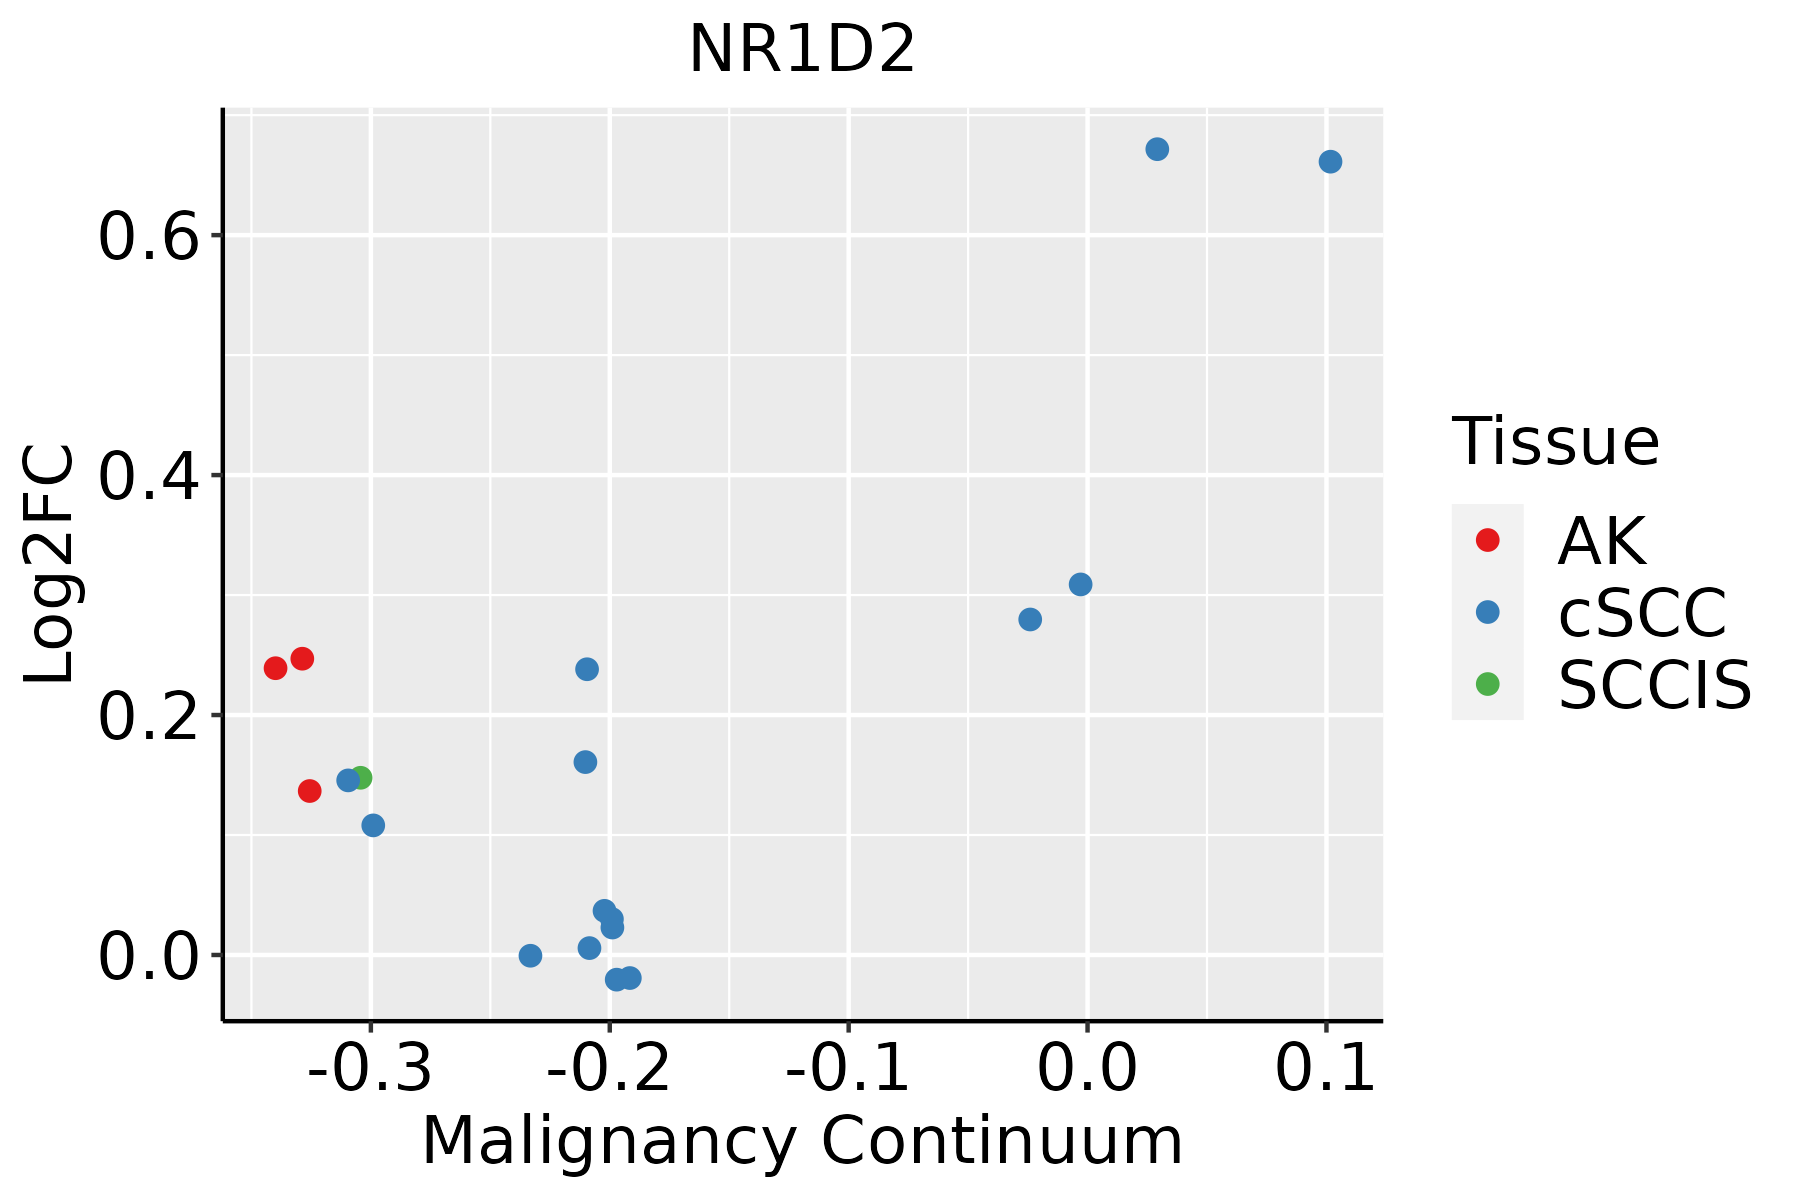 | AK: Actinic keratosis |
| cSCC: Cutaneous squamous cell carcinoma | ||
| SCCIS:squamous cell carcinoma in situ | ||
| Thyroid |  | ATC: Anaplastic thyroid cancer |
| HT: Hashimoto's thyroiditis | ||
| PTC: Papillary thyroid cancer |
| ∗log2FC in expression of this searched gene in stem-like cells from each diseased tissue sample relative to stem-like cells in normal samples in each tissue plotted against the malignancy continuum. Samples are colored based on if they are from different disease stage. |
Top |
Malignant transformation related pathway analysis |
| Find out the enriched GO biological processes and KEGG pathways involved in transition from healthy to precancer to cancer |
| Tissue | Disease Stage | Enriched GO biological Processes |
| Colorectum | AD |  |
| Colorectum | SER |  |
| Colorectum | MSS |  |
| Colorectum | MSI-H |  |
| Colorectum | FAP |  |
| ∗Top 15 enriched GO BP terms are showed in the bar plot of each disease state in each tissue. Each row represents a significant GO biological process which is colored according to the -log10(p.adjust). |
| Page: 1 2 3 4 5 6 7 8 9 |
| GO ID | Tissue | Disease Stage | Description | Gene Ratio | Bg Ratio | pvalue | p.adjust | Count |
| GO:00305229 | Cervix | CC | intracellular receptor signaling pathway | 60/2311 | 265/18723 | 1.89e-06 | 5.97e-05 | 60 |
| GO:00485118 | Cervix | CC | rhythmic process | 65/2311 | 298/18723 | 2.79e-06 | 8.04e-05 | 65 |
| GO:00507273 | Cervix | CC | regulation of inflammatory response | 75/2311 | 386/18723 | 3.95e-05 | 6.18e-04 | 75 |
| GO:00076238 | Cervix | CC | circadian rhythm | 46/2311 | 210/18723 | 6.76e-05 | 9.60e-04 | 46 |
| GO:00605375 | Cervix | CC | muscle tissue development | 76/2311 | 403/18723 | 9.76e-05 | 1.27e-03 | 76 |
| GO:00147064 | Cervix | CC | striated muscle tissue development | 72/2311 | 384/18723 | 1.76e-04 | 2.07e-03 | 72 |
| GO:00321022 | Cervix | CC | negative regulation of response to external stimulus | 75/2311 | 420/18723 | 5.96e-04 | 5.61e-03 | 75 |
| GO:0031348 | Cervix | CC | negative regulation of defense response | 48/2311 | 258/18723 | 2.30e-03 | 1.65e-02 | 48 |
| GO:00075173 | Cervix | CC | muscle organ development | 58/2311 | 327/18723 | 2.73e-03 | 1.85e-02 | 58 |
| GO:00075192 | Cervix | CC | skeletal muscle tissue development | 30/2311 | 155/18723 | 7.97e-03 | 4.18e-02 | 30 |
| GO:0030522110 | Esophagus | ESCC | intracellular receptor signaling pathway | 170/8552 | 265/18723 | 8.58e-10 | 2.09e-08 | 170 |
| GO:004851118 | Esophagus | ESCC | rhythmic process | 164/8552 | 298/18723 | 6.80e-04 | 3.57e-03 | 164 |
| GO:000762319 | Esophagus | ESCC | circadian rhythm | 119/8552 | 210/18723 | 8.47e-04 | 4.36e-03 | 119 |
| GO:000975516 | Esophagus | ESCC | hormone-mediated signaling pathway | 106/8552 | 190/18723 | 3.13e-03 | 1.30e-02 | 106 |
| GO:006053716 | Esophagus | ESCC | muscle tissue development | 211/8552 | 403/18723 | 3.84e-03 | 1.56e-02 | 211 |
| GO:00192168 | Esophagus | ESCC | regulation of lipid metabolic process | 172/8552 | 331/18723 | 1.20e-02 | 4.02e-02 | 172 |
| GO:00427529 | Esophagus | ESCC | regulation of circadian rhythm | 68/8552 | 121/18723 | 1.27e-02 | 4.21e-02 | 68 |
| GO:001470615 | Esophagus | ESCC | striated muscle tissue development | 197/8552 | 384/18723 | 1.46e-02 | 4.74e-02 | 197 |
| GO:003052222 | Liver | HCC | intracellular receptor signaling pathway | 171/7958 | 265/18723 | 3.00e-13 | 1.61e-11 | 171 |
| GO:00550882 | Liver | HCC | lipid homeostasis | 103/7958 | 167/18723 | 4.27e-07 | 7.18e-06 | 103 |
| Page: 1 2 3 4 |
| Pathway ID | Tissue | Disease Stage | Description | Gene Ratio | Bg Ratio | pvalue | p.adjust | qvalue | Count |
| hsa047105 | Esophagus | ESCC | Circadian rhythm | 24/4205 | 34/8465 | 1.09e-02 | 2.51e-02 | 1.29e-02 | 24 |
| hsa0471012 | Esophagus | ESCC | Circadian rhythm | 24/4205 | 34/8465 | 1.09e-02 | 2.51e-02 | 1.29e-02 | 24 |
| hsa047104 | Prostate | BPH | Circadian rhythm | 15/1718 | 34/8465 | 1.40e-03 | 5.85e-03 | 3.62e-03 | 15 |
| hsa0471011 | Prostate | BPH | Circadian rhythm | 15/1718 | 34/8465 | 1.40e-03 | 5.85e-03 | 3.62e-03 | 15 |
| hsa0471021 | Prostate | Tumor | Circadian rhythm | 14/1791 | 34/8465 | 6.44e-03 | 2.16e-02 | 1.34e-02 | 14 |
| hsa0471031 | Prostate | Tumor | Circadian rhythm | 14/1791 | 34/8465 | 6.44e-03 | 2.16e-02 | 1.34e-02 | 14 |
| Page: 1 |
Top |
Cell-cell communication analysis |
| Identification of potential cell-cell interactions between two cell types and their ligand-receptor pairs for different disease states |
| Ligand | Receptor | LRpair | Pathway | Tissue | Disease Stage |
| Page: 1 |
Top |
Single-cell gene regulatory network inference analysis |
| Find out the significant the regulons (TFs) and the target genes of each regulon across cell types for different disease states |
| TF | Cell Type | Tissue | Disease Stage | Target Gene | RSS | Regulon Activity |
| NR1D2 | TREG | Breast | ADJ | TCTN1,KIF5C,ECI1, etc. | 6.21e-02 |  |
| NR1D2 | CD8TRM | Breast | ADJ | TCTN1,KIF5C,ECI1, etc. | 5.01e-02 | |
| NR1D2 | CD8TRM | Breast | DCIS | TCTN1,KIF5C,ECI1, etc. | 1.36e-02 |  |
| NR1D2 | TH17 | Breast | Healthy | TCTN1,KIF5C,ECI1, etc. | 3.92e-02 |  |
| NR1D2 | ECM | Colorectum | Healthy | NCKAP1L,ZNF66,PERP, etc. | 7.85e-02 |  |
| NR1D2 | LYMEND | Colorectum | MSS | NCKAP1L,ZNF66,PERP, etc. | 1.11e-16 |  |
| NR1D2 | VFIB | Colorectum | MSS | NCKAP1L,ZNF66,PERP, etc. | 1.11e-16 | |
| NR1D2 | INCAF | Colorectum | SER | NCKAP1L,ZNF66,PERP, etc. | 1.27e-01 |  |
| NR1D2 | ECM | Esophagus | ESCC | NR1D1,PER3,TEF, etc. | 1.34e-01 |  |
| NR1D2 | CD8TEXP | Lung | MIAC | KLHL24,RORA,PPP1R16B, etc. | 1.47e-01 |  |
| ∗The dot plots of a searched regulon are shown for all cell subpopulations in each disease state of each tissue based on the regulon specific score inferred using pySCENIC and by calculating the average expression. |
| Page: 1 2 3 |
Top |
Somatic mutation of malignant transformation related genes |
| Annotation of somatic variants for genes involved in malignant transformation |
| Hugo Symbol | Variant Class | Variant Classification | dbSNP RS | HGVSc | HGVSp | HGVSp Short | SWISSPROT | BIOTYPE | SIFT | PolyPhen | Tumor Sample Barcode | Tissue | Histology | Sex | Age | Stage | Therapy Types | Drugs | Outcome |
| NR1D2 | SNV | Missense_Mutation | rs375583060 | c.1151G>T | p.Cys384Phe | p.C384F | Q14995 | protein_coding | deleterious(0) | probably_damaging(0.994) | TCGA-5T-A9QA-01 | Breast | breast invasive carcinoma | Female | <65 | I/II | Chemotherapy | taxol | SD |
| NR1D2 | SNV | Missense_Mutation | c.1221N>T | p.Met407Ile | p.M407I | Q14995 | protein_coding | deleterious(0.05) | benign(0.1) | TCGA-D8-A1JA-01 | Breast | breast invasive carcinoma | Female | <65 | III/IV | Chemotherapy | adriamycin | PD | |
| NR1D2 | SNV | Missense_Mutation | novel | c.1303N>T | p.Val435Phe | p.V435F | Q14995 | protein_coding | deleterious(0) | probably_damaging(0.953) | TCGA-GM-A2DL-01 | Breast | breast invasive carcinoma | Female | <65 | I/II | Hormone Therapy | tamoxiphen | CR |
| NR1D2 | insertion | Nonsense_Mutation | novel | c.193_194insAGGACGAATAATGGGAAATAAGGAAATACTTTATTTTTT | p.Gly65delinsGluAspGluTerTrpGluIleArgLysTyrPheIlePheCys | p.G65delinsEDE*WEIRKYFIFC | Q14995 | protein_coding | TCGA-A2-A04T-01 | Breast | breast invasive carcinoma | Female | <65 | I/II | Chemotherapy | cyclophosphamide | SD | ||
| NR1D2 | insertion | Nonsense_Mutation | novel | c.1669_1670insTTAGCAAAATAAAATAATGTAGTATATAAACAT | p.Lys557delinsIleSerLysIleLysTerCysSerIleTerThrTer | p.K557delinsISKIK*CSI*T* | Q14995 | protein_coding | TCGA-A8-A085-01 | Breast | breast invasive carcinoma | Male | <65 | I/II | Hormone Therapy | tamoxiphen | SD | ||
| NR1D2 | deletion | Frame_Shift_Del | novel | c.481delN | p.Phe161SerfsTer28 | p.F161Sfs*28 | Q14995 | protein_coding | TCGA-EW-A2FV-01 | Breast | breast invasive carcinoma | Female | <65 | III/IV | Chemotherapy | docetaxel | SD | ||
| NR1D2 | SNV | Missense_Mutation | rs769207208 | c.1564G>A | p.Val522Ile | p.V522I | Q14995 | protein_coding | tolerated(0.11) | benign(0.13) | TCGA-2W-A8YY-01 | Cervix | cervical & endocervical cancer | Female | <65 | I/II | Chemotherapy | cisplatin | CR |
| NR1D2 | SNV | Missense_Mutation | novel | c.512N>C | p.Arg171Thr | p.R171T | Q14995 | protein_coding | deleterious(0) | probably_damaging(0.986) | TCGA-C5-A2LZ-01 | Cervix | cervical & endocervical cancer | Female | >=65 | III/IV | Unknown | Unknown | PD |
| NR1D2 | SNV | Missense_Mutation | c.382C>T | p.Arg128Trp | p.R128W | Q14995 | protein_coding | deleterious(0) | probably_damaging(1) | TCGA-IR-A3LK-01 | Cervix | cervical & endocervical cancer | Female | >=65 | I/II | Chemotherapy | cisplatin | PD | |
| NR1D2 | SNV | Missense_Mutation | c.1547N>A | p.Arg516Gln | p.R516Q | Q14995 | protein_coding | deleterious(0.02) | possibly_damaging(0.679) | TCGA-AA-3510-01 | Colorectum | colon adenocarcinoma | Male | >=65 | I/II | Unknown | Unknown | SD |
| Page: 1 2 3 4 5 6 7 8 |
Top |
Related drugs of malignant transformation related genes |
| Identification of chemicals and drugs interact with genes involved in malignant transfromation |
| (DGIdb 4.0) |
| Entrez ID | Symbol | Category | Interaction Types | Drug Claim Name | Drug Name | PMIDs |
| 9975 | NR1D2 | NUCLEAR HORMONE RECEPTOR, DRUGGABLE GENOME | antagonist | 310264683 | ||
| 9975 | NR1D2 | NUCLEAR HORMONE RECEPTOR, DRUGGABLE GENOME | agonist | 310264682 | SR9009 | |
| 9975 | NR1D2 | NUCLEAR HORMONE RECEPTOR, DRUGGABLE GENOME | antagonist | 310264684 | ||
| 9975 | NR1D2 | NUCLEAR HORMONE RECEPTOR, DRUGGABLE GENOME | agonist | 310264681 | SR9011 | |
| 9975 | NR1D2 | NUCLEAR HORMONE RECEPTOR, DRUGGABLE GENOME | agonist | 178101166 |
| Page: 1 |

Copyright 2023-Present -The University of Texas Health Science Center at Houston |