Schematic overview of the cellular and molecular mechanisms involved in the cancer progression, including the proposed cellular and molecular mechanisms in cancer cells trajectory. AT1: alveolar type 1 cells; AT2: alveolar type 2 cells; AAH: atypical adenomatous hyperplasia; AIS: adenocarcinoma in situ; MIA: minimally invasive adenocarcinoma; IA: invasive adenocarcinoma; EMT: epithelial-mesenchymal transition

Home

Download

Statistics

Help

Contact

Center for Computational Systems Medicine
leaf

Gene summary

leaf

Malignant transformation analysis

leaf

Malignant transformation related pathway analysis

leaf

Cell-cell communication analysis

leaf

Single-cell gene regulatory network inference analysis

leaf

Somatic mutation of malignant transformation related genes

leaf

Related drugs of malignant transformation related genes

Gene: NR1D1

Gene summary for NR1D1

check button Gene summary.

Gene informationSpeciesHuman
Gene symbol

NR1D1

Gene ID

9572

Gene namenuclear receptor subfamily 1 group D member 1
Gene AliasEAR1
Cytomap17q21.1
Gene Typeprotein-coding
GO ID

GO:0000122

UniProtAcc

F1D8S3


Top

Malignant transformation analysis

check button Identification of the aberrant gene expression in precancerous and cancerous lesions by comparing the gene expression of stem-like cells in diseased tissues with normal stem cells
check button Malignant transformation involving gene list.
Entrez IDSymbolReplicatesSpeciesOrganTissueAdj P-valueLog2FCMalignancy
9572NR1D1LZE7THumanEsophagusESCC3.93e-102.53e-010.0667
9572NR1D1LZE8THumanEsophagusESCC1.80e-052.20e-010.067
9572NR1D1LZE24THumanEsophagusESCC9.69e-043.82e-010.0596
9572NR1D1LZE6THumanEsophagusESCC1.59e-061.65e-010.0845
9572NR1D1P1T-EHumanEsophagusESCC6.47e-055.37e-010.0875
9572NR1D1P2T-EHumanEsophagusESCC2.50e-072.43e-010.1177
9572NR1D1P4T-EHumanEsophagusESCC1.15e-08-1.03e-020.1323
9572NR1D1P5T-EHumanEsophagusESCC2.11e-06-3.29e-020.1327
9572NR1D1P8T-EHumanEsophagusESCC1.27e-061.00e-010.0889
9572NR1D1P9T-EHumanEsophagusESCC6.60e-04-1.78e-020.1131
9572NR1D1P11T-EHumanEsophagusESCC1.29e-021.48e-010.1426
9572NR1D1P12T-EHumanEsophagusESCC3.95e-236.33e-010.1122
9572NR1D1P15T-EHumanEsophagusESCC1.88e-072.39e-010.1149
9572NR1D1P16T-EHumanEsophagusESCC3.48e-03-5.01e-020.1153
9572NR1D1P19T-EHumanEsophagusESCC9.19e-031.36e-010.1662
9572NR1D1P20T-EHumanEsophagusESCC6.28e-116.59e-010.1124
9572NR1D1P21T-EHumanEsophagusESCC5.94e-166.77e-010.1617
9572NR1D1P23T-EHumanEsophagusESCC1.15e-178.03e-010.108
9572NR1D1P24T-EHumanEsophagusESCC1.62e-052.70e-010.1287
9572NR1D1P26T-EHumanEsophagusESCC5.65e-185.51e-010.1276
Page: 1 2 3 4 

check button Transcriptomic changes along malignancy continuum.
TissueExpression DynamicsAbbreviation
EsophagusThe image shows the transcriptomic changes along malignancy continuum.log2FC in expression of this searched gene in stem-like cells from each diseased tissue sample relative to stem-like cells in normal samples in each tissue plotted against the malignancy continuum. Samples are colored based on if they are from different disease stage.
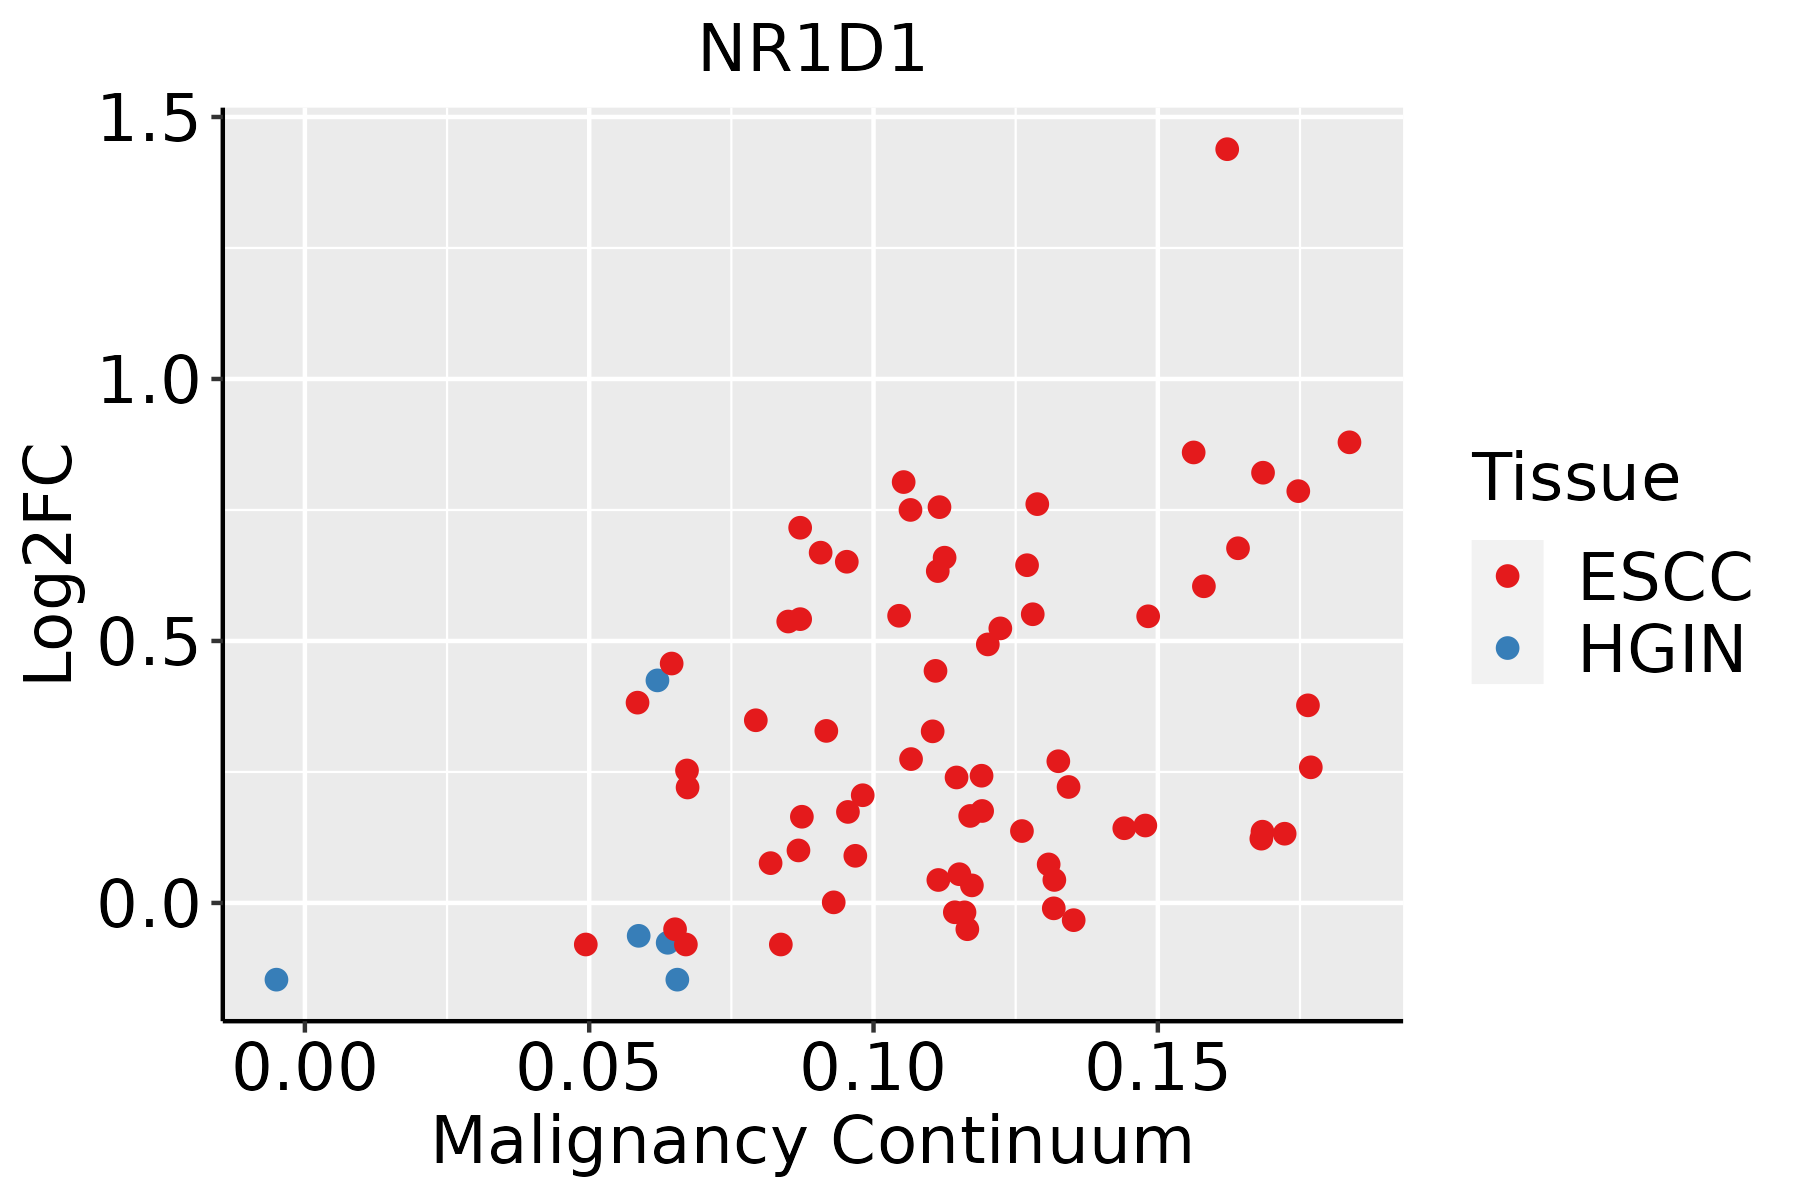
ESCC: Esophageal squamous cell carcinoma
HGIN: High-grade intraepithelial neoplasias
LGIN: Low-grade intraepithelial neoplasias
LiverThe image shows the transcriptomic changes along malignancy continuum.log2FC in expression of this searched gene in stem-like cells from each diseased tissue sample relative to stem-like cells in normal samples in each tissue plotted against the malignancy continuum. Samples are colored based on if they are from different disease stage.
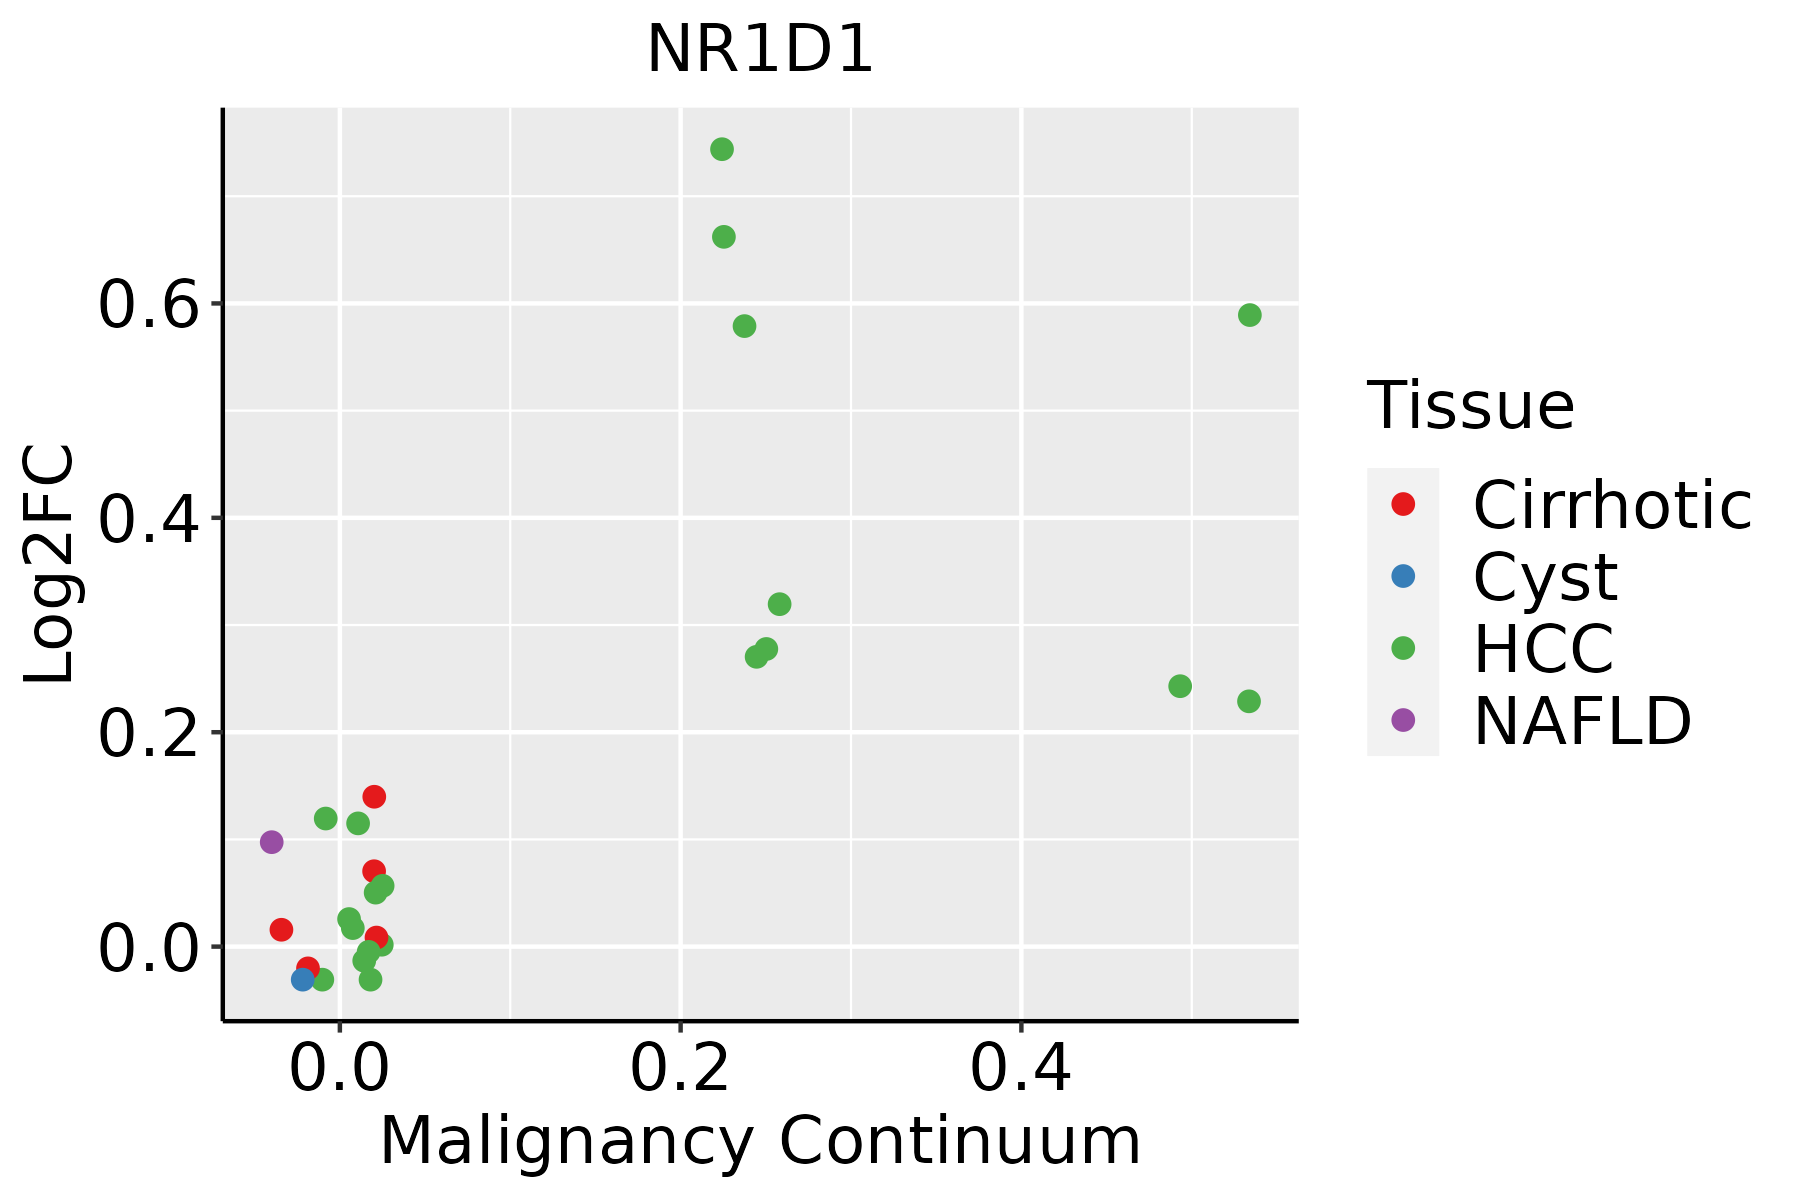
HCC: Hepatocellular carcinoma
NAFLD: Non-alcoholic fatty liver disease
Oral CavityThe image shows the transcriptomic changes along malignancy continuum.log2FC in expression of this searched gene in stem-like cells from each diseased tissue sample relative to stem-like cells in normal samples in each tissue plotted against the malignancy continuum. Samples are colored based on if they are from different disease stage.
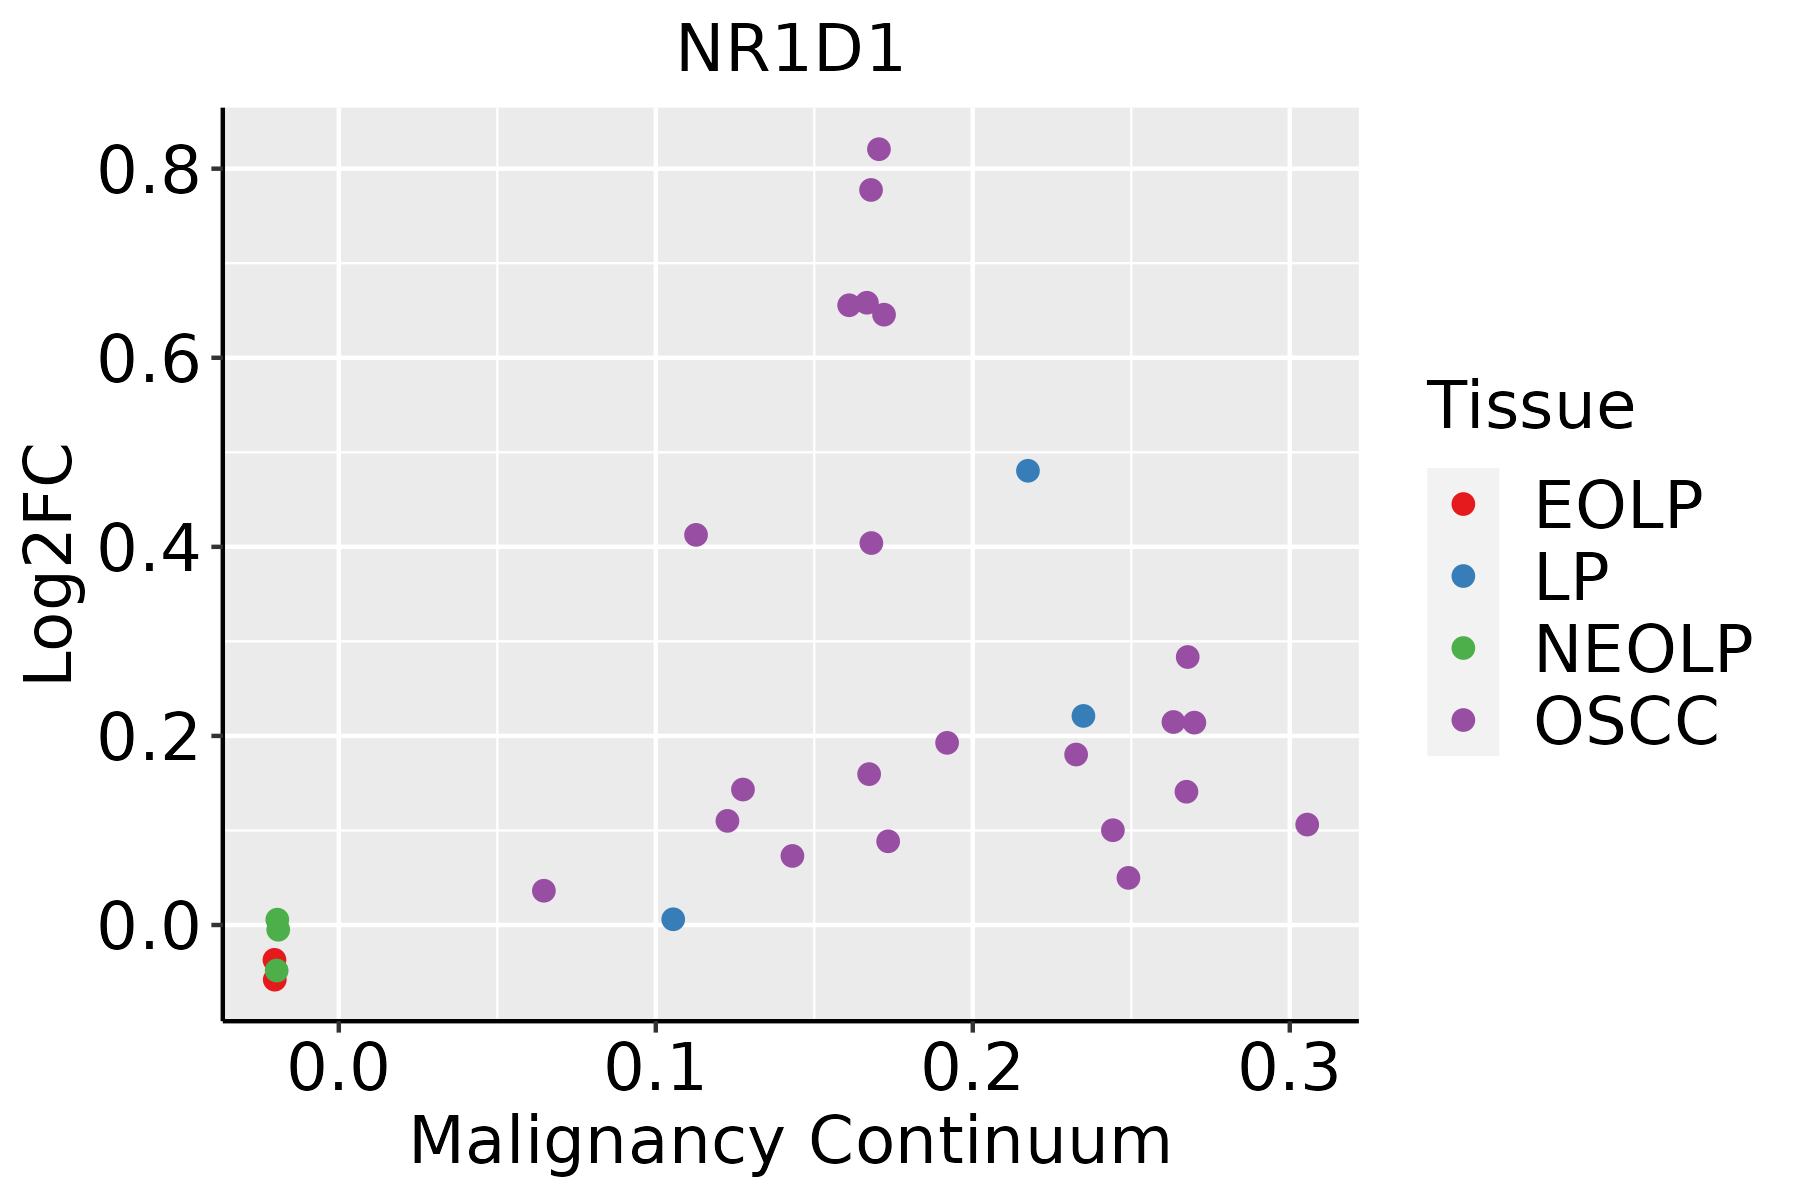
EOLP: Erosive Oral lichen planus
LP: leukoplakia
NEOLP: Non-erosive oral lichen planus
OSCC: Oral squamous cell carcinoma
SkinThe image shows the transcriptomic changes along malignancy continuum.log2FC in expression of this searched gene in stem-like cells from each diseased tissue sample relative to stem-like cells in normal samples in each tissue plotted against the malignancy continuum. Samples are colored based on if they are from different disease stage.AK: Actinic keratosis
cSCC: Cutaneous squamous cell carcinoma
SCCIS:squamous cell carcinoma in situ
∗log2FC in expression of this searched gene in stem-like cells from each diseased tissue sample relative to stem-like cells in normal samples in each tissue plotted against the malignancy continuum. Samples are colored based on if they are from different disease stage.

Top

Malignant transformation related pathway analysis

check buttonFind out the enriched GO biological processes and KEGG pathways involved in transition from healthy to precancer to cancer
check button Figure of enriched GO biological processes.
TissueDisease StageEnriched GO biological Processes
ColorectumADGO analysis - Figure of enriched GO biological processes: Top 15 enriched GO BP terms are showed in the bar plot of each disease state in each tissue. Each row represents a significant GO biological process which is colored according to the -log10(p.adjust).
ColorectumSERGO analysis - Figure of enriched GO biological processes: Top 15 enriched GO BP terms are showed in the bar plot of each disease state in each tissue. Each row represents a significant GO biological process which is colored according to the -log10(p.adjust).
ColorectumMSSGO analysis - Figure of enriched GO biological processes: Top 15 enriched GO BP terms are showed in the bar plot of each disease state in each tissue. Each row represents a significant GO biological process which is colored according to the -log10(p.adjust).
ColorectumMSI-HGO analysis - Figure of enriched GO biological processes: Top 15 enriched GO BP terms are showed in the bar plot of each disease state in each tissue. Each row represents a significant GO biological process which is colored according to the -log10(p.adjust).
ColorectumFAPGO analysis - Figure of enriched GO biological processes: Top 15 enriched GO BP terms are showed in the bar plot of each disease state in each tissue. Each row represents a significant GO biological process which is colored according to the -log10(p.adjust).
∗Top 15 enriched GO BP terms are showed in the bar plot of each disease state in each tissue. Each row represents a significant GO biological process which is colored according to the -log10(p.adjust).
Page: 1 2 3 4 5 6 7 8 9 

check button Enriched GO biological processes.
GO IDTissueDisease StageDescriptionGene RatioBg Ratiopvaluep.adjustCount
GO:0010498111EsophagusESCCproteasomal protein catabolic process369/8552490/187231.13e-411.80e-38369
GO:0031647111EsophagusESCCregulation of protein stability223/8552298/187235.76e-251.52e-22223
GO:0006091110EsophagusESCCgeneration of precursor metabolites and energy331/8552490/187233.86e-238.45e-21331
GO:0015980110EsophagusESCCenergy derivation by oxidation of organic compounds220/8552318/187231.20e-171.09e-15220
GO:0043122110EsophagusESCCregulation of I-kappaB kinase/NF-kappaB signaling167/8552249/187236.11e-122.32e-10167
GO:000724919EsophagusESCCI-kappaB kinase/NF-kappaB signaling183/8552281/187233.02e-111.01e-09183
GO:0030522110EsophagusESCCintracellular receptor signaling pathway170/8552265/187238.58e-102.09e-08170
GO:0048545111EsophagusESCCresponse to steroid hormone204/8552339/187234.47e-088.11e-07204
GO:0071383110EsophagusESCCcellular response to steroid hormone stimulus127/8552204/187231.26e-061.55e-05127
GO:004340119EsophagusESCCsteroid hormone mediated signaling pathway87/8552136/187231.25e-051.15e-0487
GO:003461220EsophagusESCCresponse to tumor necrosis factor149/8552253/187231.47e-051.33e-04149
GO:003292215EsophagusESCCcircadian regulation of gene expression48/855268/187232.76e-052.30e-0448
GO:00454449EsophagusESCCfat cell differentiation135/8552229/187233.38e-052.78e-04135
GO:00420636EsophagusESCCgliogenesis172/8552301/187233.75e-053.04e-04172
GO:005076710EsophagusESCCregulation of neurogenesis203/8552364/187236.10e-054.68e-04203
GO:003249619EsophagusESCCresponse to lipopolysaccharide191/8552343/187231.11e-047.73e-04191
GO:005067318EsophagusESCCepithelial cell proliferation238/8552437/187231.19e-048.20e-04238
GO:00442626EsophagusESCCcellular carbohydrate metabolic process160/8552283/187231.43e-049.66e-04160
GO:007135620EsophagusESCCcellular response to tumor necrosis factor132/8552229/187231.69e-041.11e-03132
GO:00463948EsophagusESCCcarboxylic acid biosynthetic process175/8552314/187231.98e-041.26e-03175
Page: 1 2 3 4 5 6 7 8 9 10 11 12 13 14 15 

check button Enriched KEGG pathways.
Pathway IDTissueDisease StageDescriptionGene RatioBg Ratiopvaluep.adjustqvalueCount
hsa047105EsophagusESCCCircadian rhythm24/420534/84651.09e-022.51e-021.29e-0224
hsa0471012EsophagusESCCCircadian rhythm24/420534/84651.09e-022.51e-021.29e-0224
Page: 1 

Top

Cell-cell communication analysis

check buttonIdentification of potential cell-cell interactions between two cell types and their ligand-receptor pairs for different disease states
LigandReceptorLRpairPathwayTissueDisease Stage
Page: 1 

Top

Single-cell gene regulatory network inference analysis

check buttonFind out the significant the regulons (TFs) and the target genes of each regulon across cell types for different disease states
TFCell TypeTissueDisease StageTarget GeneRSSRegulon Activity
NR1D1INCAFCervixN_HPVSERTAD4-AS1,DBP,NR1D2, etc.7.82e-01The dot plots of a searched regulon are shown for all cell subpopulations in each disease state of each tissue based on the regulon specific score inferred using pySCENIC and by calculating the average expression.
NR1D1SSCColorectumHealthyRNF2,PDP2,R3HDM4, etc.1.04e-01The dot plots of a searched regulon are shown for all cell subpopulations in each disease state of each tissue based on the regulon specific score inferred using pySCENIC and by calculating the average expression.
NR1D1SURFEndometriumAEHAL118506.1,ASH1L-AS1,AC015802.6, etc.2.76e-01The dot plots of a searched regulon are shown for all cell subpopulations in each disease state of each tissue based on the regulon specific score inferred using pySCENIC and by calculating the average expression.
NR1D1TRANSEsophagusADJGADD45B,MGLL,NR1D2, etc.4.81e-01The dot plots of a searched regulon are shown for all cell subpopulations in each disease state of each tissue based on the regulon specific score inferred using pySCENIC and by calculating the average expression.
NR1D1TRANSEsophagusESCCGADD45B,MGLL,NR1D2, etc.1.63e-01The dot plots of a searched regulon are shown for all cell subpopulations in each disease state of each tissue based on the regulon specific score inferred using pySCENIC and by calculating the average expression.
NR1D1TRANSEsophagusHGINGADD45B,MGLL,NR1D2, etc.2.80e-01The dot plots of a searched regulon are shown for all cell subpopulations in each disease state of each tissue based on the regulon specific score inferred using pySCENIC and by calculating the average expression.
NR1D1MAITOral cavityADJZNF414,DBP,RP11-841O20.2, etc.3.50e-02The dot plots of a searched regulon are shown for all cell subpopulations in each disease state of each tissue based on the regulon specific score inferred using pySCENIC and by calculating the average expression.
NR1D1TH17Oral cavityNEOLPZNF414,DBP,RP11-841O20.2, etc.3.98e-02The dot plots of a searched regulon are shown for all cell subpopulations in each disease state of each tissue based on the regulon specific score inferred using pySCENIC and by calculating the average expression.
NR1D1CD8TCMOral cavityNEOLPZNF414,DBP,RP11-841O20.2, etc.1.45e-02The dot plots of a searched regulon are shown for all cell subpopulations in each disease state of each tissue based on the regulon specific score inferred using pySCENIC and by calculating the average expression.
NR1D1CD8TEXPProstateADJNUDT15,LINC00330,SQLE, etc.3.63e-02The dot plots of a searched regulon are shown for all cell subpopulations in each disease state of each tissue based on the regulon specific score inferred using pySCENIC and by calculating the average expression.
∗The dot plots of a searched regulon are shown for all cell subpopulations in each disease state of each tissue based on the regulon specific score inferred using pySCENIC and by calculating the average expression.
Page: 1 2 3 

Top

Somatic mutation of malignant transformation related genes

check buttonAnnotation of somatic variants for genes involved in malignant transformation
Hugo SymbolVariant ClassVariant ClassificationdbSNP RSHGVScHGVSpHGVSp ShortSWISSPROTBIOTYPESIFTPolyPhenTumor Sample BarcodeTissueHistologySexAgeStageTherapy TypesDrugsOutcome
NR1D1SNVMissense_Mutationc.1053N>Ap.His351Glnp.H351QP20393protein_codingtolerated(0.27)benign(0.413)TCGA-A8-A07P-01Breastbreast invasive carcinomaFemale>=65I/IIChemotherapy5-fluorouracilSD
NR1D1SNVMissense_Mutationrs766624331c.71C>Ap.Pro24Glnp.P24QP20393protein_codingdeleterious(0)possibly_damaging(0.557)TCGA-B6-A0IE-01Breastbreast invasive carcinomaFemale<65III/IVUnknownUnknownPD
NR1D1SNVMissense_Mutationrs760740974c.611N>Ap.Arg204Hisp.R204HP20393protein_codingdeleterious(0)probably_damaging(0.994)TCGA-BH-A0HA-01Breastbreast invasive carcinomaFemale<65I/IIUnknownUnknownSD
NR1D1SNVMissense_Mutationrs766624331c.71N>Ap.Pro24Glnp.P24QP20393protein_codingdeleterious(0)possibly_damaging(0.557)TCGA-C8-A1HM-01Breastbreast invasive carcinomaFemale>=65I/IIChemotherapydoxorubicinCR
NR1D1SNVMissense_Mutationnovelc.844N>Cp.Glu282Glnp.E282QP20393protein_codingtolerated(0.11)benign(0.315)TCGA-C8-A8HP-01Breastbreast invasive carcinomaFemale<65III/IVChemotherapy5-fluorouracilCR
NR1D1insertionFrame_Shift_Insnovelc.126_127insAAp.Ser43AsnfsTer3p.S43Nfs*3P20393protein_codingTCGA-BH-A0BV-01Breastbreast invasive carcinomaFemale>=65I/IIChemotherapydoxorubicinSD
NR1D1SNVMissense_Mutationc.570N>Gp.Phe190Leup.F190LP20393protein_codingdeleterious(0.03)benign(0.436)TCGA-C5-A7CL-01Cervixcervical & endocervical cancerFemale<65III/IVChemotherapycisplatinPD
NR1D1SNVMissense_Mutationc.251C>Tp.Ser84Leup.S84LP20393protein_codingtolerated(0.12)benign(0.01)TCGA-JW-A5VL-01Cervixcervical & endocervical cancerFemale<65I/IIUnknownUnknownSD
NR1D1SNVMissense_Mutationnovelc.1055A>Gp.Asn352Serp.N352SP20393protein_codingtolerated(0.27)benign(0.005)TCGA-MA-AA42-01Cervixcervical & endocervical cancerFemale>=65I/IIUnknownUnknownSD
NR1D1SNVMissense_Mutationrs766286236c.263N>Tp.Ser88Leup.S88LP20393protein_codingtolerated(0.21)possibly_damaging(0.602)TCGA-AA-3510-01Colorectumcolon adenocarcinomaMale>=65I/IIUnknownUnknownSD
Page: 1 2 3 4 5 6 7 

Top

Related drugs of malignant transformation related genes

check buttonIdentification of chemicals and drugs interact with genes involved in malignant transfromation
(DGIdb 4.0)
Entrez IDSymbolCategoryInteraction TypesDrug Claim NameDrug NamePMIDs
9572NR1D1NUCLEAR HORMONE RECEPTOR, DRUGGABLE GENOME, TRANSCRIPTION FACTOR, ENZYMESR9011SR901123656296
9572NR1D1NUCLEAR HORMONE RECEPTOR, DRUGGABLE GENOME, TRANSCRIPTION FACTOR, ENZYMEagonist135650323GSK-4112
9572NR1D1NUCLEAR HORMONE RECEPTOR, DRUGGABLE GENOME, TRANSCRIPTION FACTOR, ENZYMEantagonist135651083
9572NR1D1NUCLEAR HORMONE RECEPTOR, DRUGGABLE GENOME, TRANSCRIPTION FACTOR, ENZYMEagonist310264681SR9011
9572NR1D1NUCLEAR HORMONE RECEPTOR, DRUGGABLE GENOME, TRANSCRIPTION FACTOR, ENZYMEGSK-4112GSK-411223656296
9572NR1D1NUCLEAR HORMONE RECEPTOR, DRUGGABLE GENOME, TRANSCRIPTION FACTOR, ENZYMElithiumLITHIUM20348464
9572NR1D1NUCLEAR HORMONE RECEPTOR, DRUGGABLE GENOME, TRANSCRIPTION FACTOR, ENZYMEagonist178101166
9572NR1D1NUCLEAR HORMONE RECEPTOR, DRUGGABLE GENOME, TRANSCRIPTION FACTOR, ENZYMEagonist310264682SR9009
Page: 1