
|
|||||
|
 | |
| |
| |
| |
| |
| |
|
Gene: NQO2 |
Gene summary for NQO2 |
| Gene information | Species | Human | Gene symbol | NQO2 | Gene ID | 4835 |
| Gene name | N-ribosyldihydronicotinamide:quinone reductase 2 | |
| Gene Alias | DHQV | |
| Cytomap | 6p25.2 | |
| Gene Type | protein-coding | GO ID | GO:0000165 | UniProtAcc | B3KPX6 |
Top |
Malignant transformation analysis |
| Identification of the aberrant gene expression in precancerous and cancerous lesions by comparing the gene expression of stem-like cells in diseased tissues with normal stem cells |
| Entrez ID | Symbol | Replicates | Species | Organ | Tissue | Adj P-value | Log2FC | Malignancy |
| 4835 | NQO2 | LZE2T | Human | Esophagus | ESCC | 2.25e-02 | 4.44e-01 | 0.082 |
| 4835 | NQO2 | LZE4T | Human | Esophagus | ESCC | 1.51e-16 | 5.20e-01 | 0.0811 |
| 4835 | NQO2 | LZE7T | Human | Esophagus | ESCC | 1.43e-04 | 4.60e-01 | 0.0667 |
| 4835 | NQO2 | LZE8T | Human | Esophagus | ESCC | 1.69e-08 | 2.59e-01 | 0.067 |
| 4835 | NQO2 | LZE20T | Human | Esophagus | ESCC | 9.26e-04 | 1.74e-01 | 0.0662 |
| 4835 | NQO2 | LZE22T | Human | Esophagus | ESCC | 2.59e-04 | 5.98e-01 | 0.068 |
| 4835 | NQO2 | LZE24T | Human | Esophagus | ESCC | 4.16e-17 | 5.71e-01 | 0.0596 |
| 4835 | NQO2 | LZE6T | Human | Esophagus | ESCC | 5.94e-05 | 4.85e-01 | 0.0845 |
| 4835 | NQO2 | P1T-E | Human | Esophagus | ESCC | 1.94e-08 | 5.79e-01 | 0.0875 |
| 4835 | NQO2 | P2T-E | Human | Esophagus | ESCC | 3.84e-13 | 2.61e-01 | 0.1177 |
| 4835 | NQO2 | P4T-E | Human | Esophagus | ESCC | 1.40e-13 | 3.63e-01 | 0.1323 |
| 4835 | NQO2 | P5T-E | Human | Esophagus | ESCC | 4.98e-04 | 1.28e-01 | 0.1327 |
| 4835 | NQO2 | P8T-E | Human | Esophagus | ESCC | 1.66e-05 | 8.70e-02 | 0.0889 |
| 4835 | NQO2 | P9T-E | Human | Esophagus | ESCC | 3.12e-25 | 5.19e-01 | 0.1131 |
| 4835 | NQO2 | P10T-E | Human | Esophagus | ESCC | 1.55e-06 | 6.92e-02 | 0.116 |
| 4835 | NQO2 | P11T-E | Human | Esophagus | ESCC | 1.30e-15 | 8.91e-01 | 0.1426 |
| 4835 | NQO2 | P12T-E | Human | Esophagus | ESCC | 3.55e-16 | 3.09e-01 | 0.1122 |
| 4835 | NQO2 | P15T-E | Human | Esophagus | ESCC | 1.02e-16 | 4.86e-01 | 0.1149 |
| 4835 | NQO2 | P16T-E | Human | Esophagus | ESCC | 9.35e-11 | 7.99e-02 | 0.1153 |
| 4835 | NQO2 | P17T-E | Human | Esophagus | ESCC | 9.99e-10 | 6.30e-01 | 0.1278 |
| Page: 1 2 3 4 5 6 |
| Tissue | Expression Dynamics | Abbreviation |
| Esophagus |  | ESCC: Esophageal squamous cell carcinoma |
| HGIN: High-grade intraepithelial neoplasias | ||
| LGIN: Low-grade intraepithelial neoplasias | ||
| Liver |  | HCC: Hepatocellular carcinoma |
| NAFLD: Non-alcoholic fatty liver disease | ||
| Oral Cavity |  | EOLP: Erosive Oral lichen planus |
| LP: leukoplakia | ||
| NEOLP: Non-erosive oral lichen planus | ||
| OSCC: Oral squamous cell carcinoma | ||
| Skin | 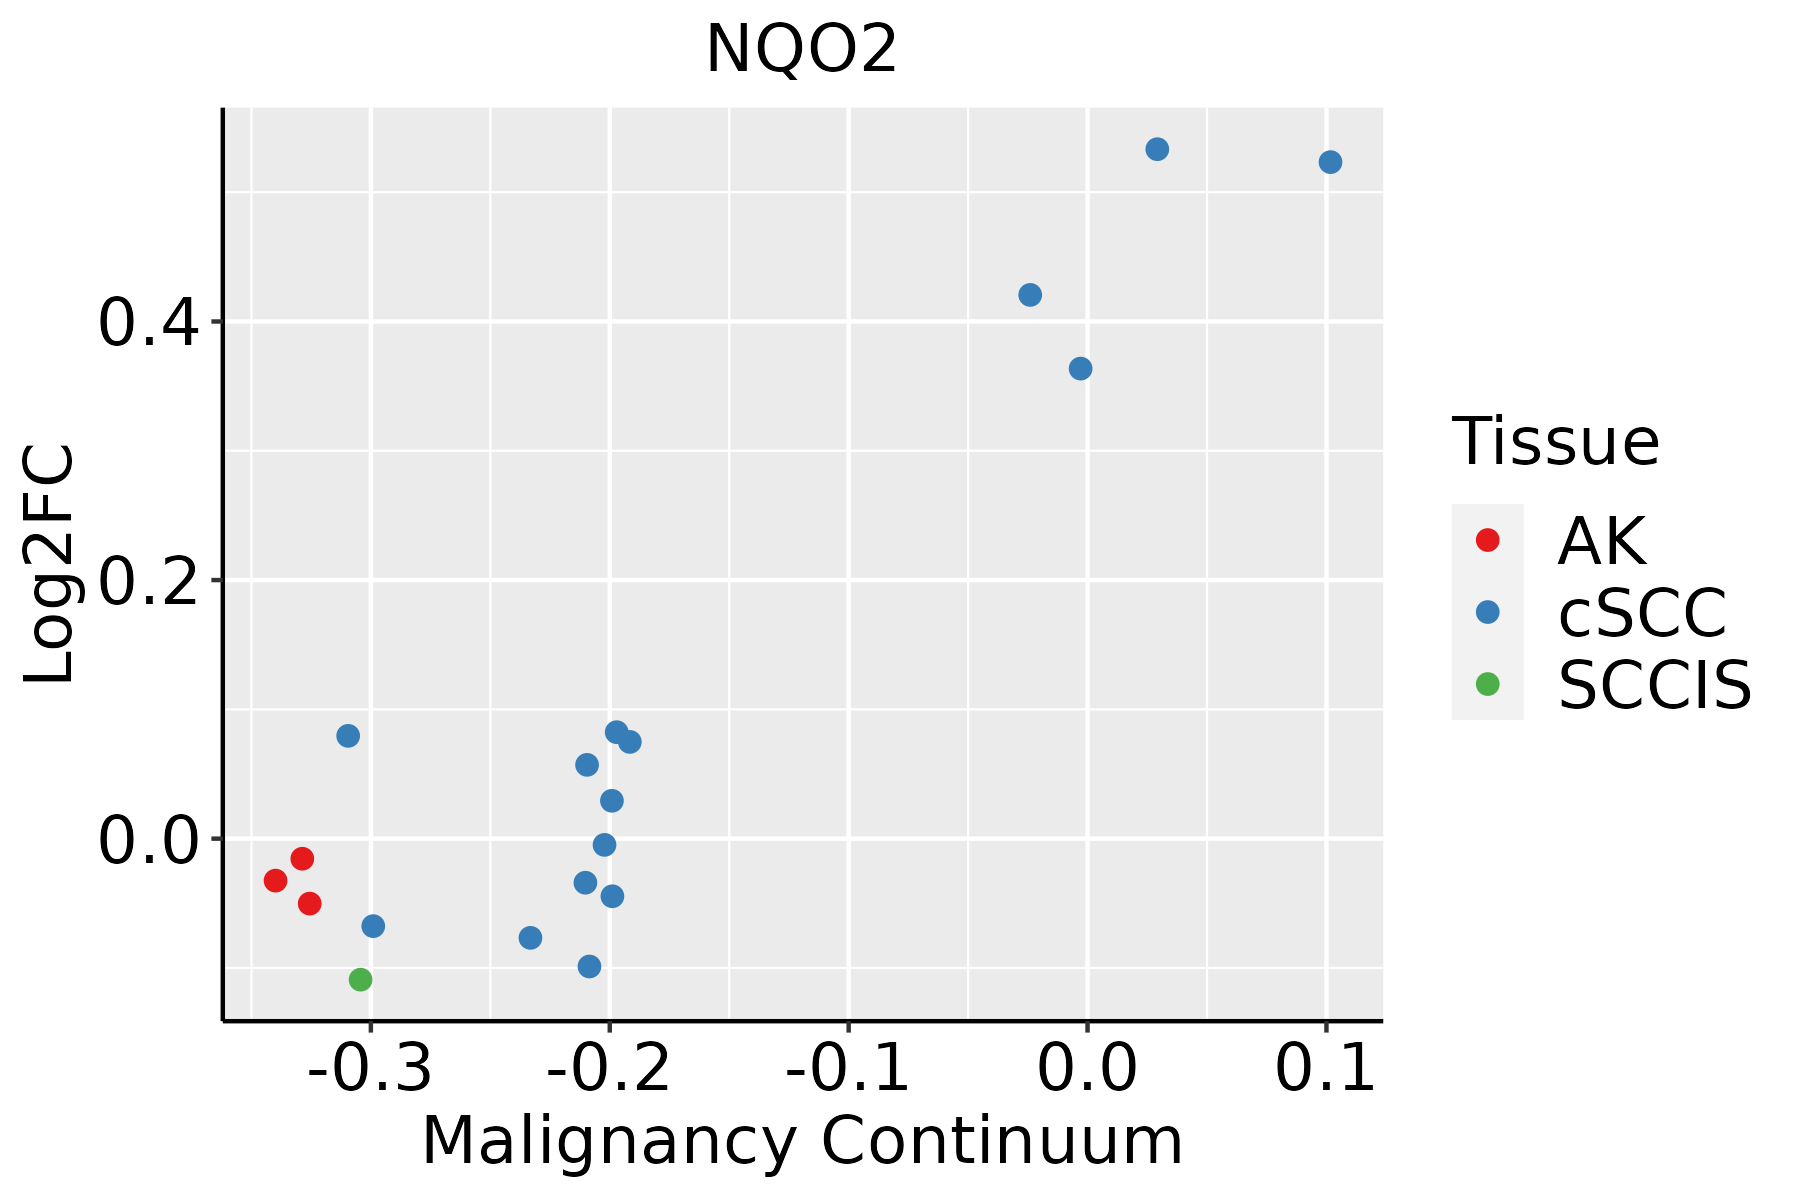 | AK: Actinic keratosis |
| cSCC: Cutaneous squamous cell carcinoma | ||
| SCCIS:squamous cell carcinoma in situ | ||
| Thyroid | 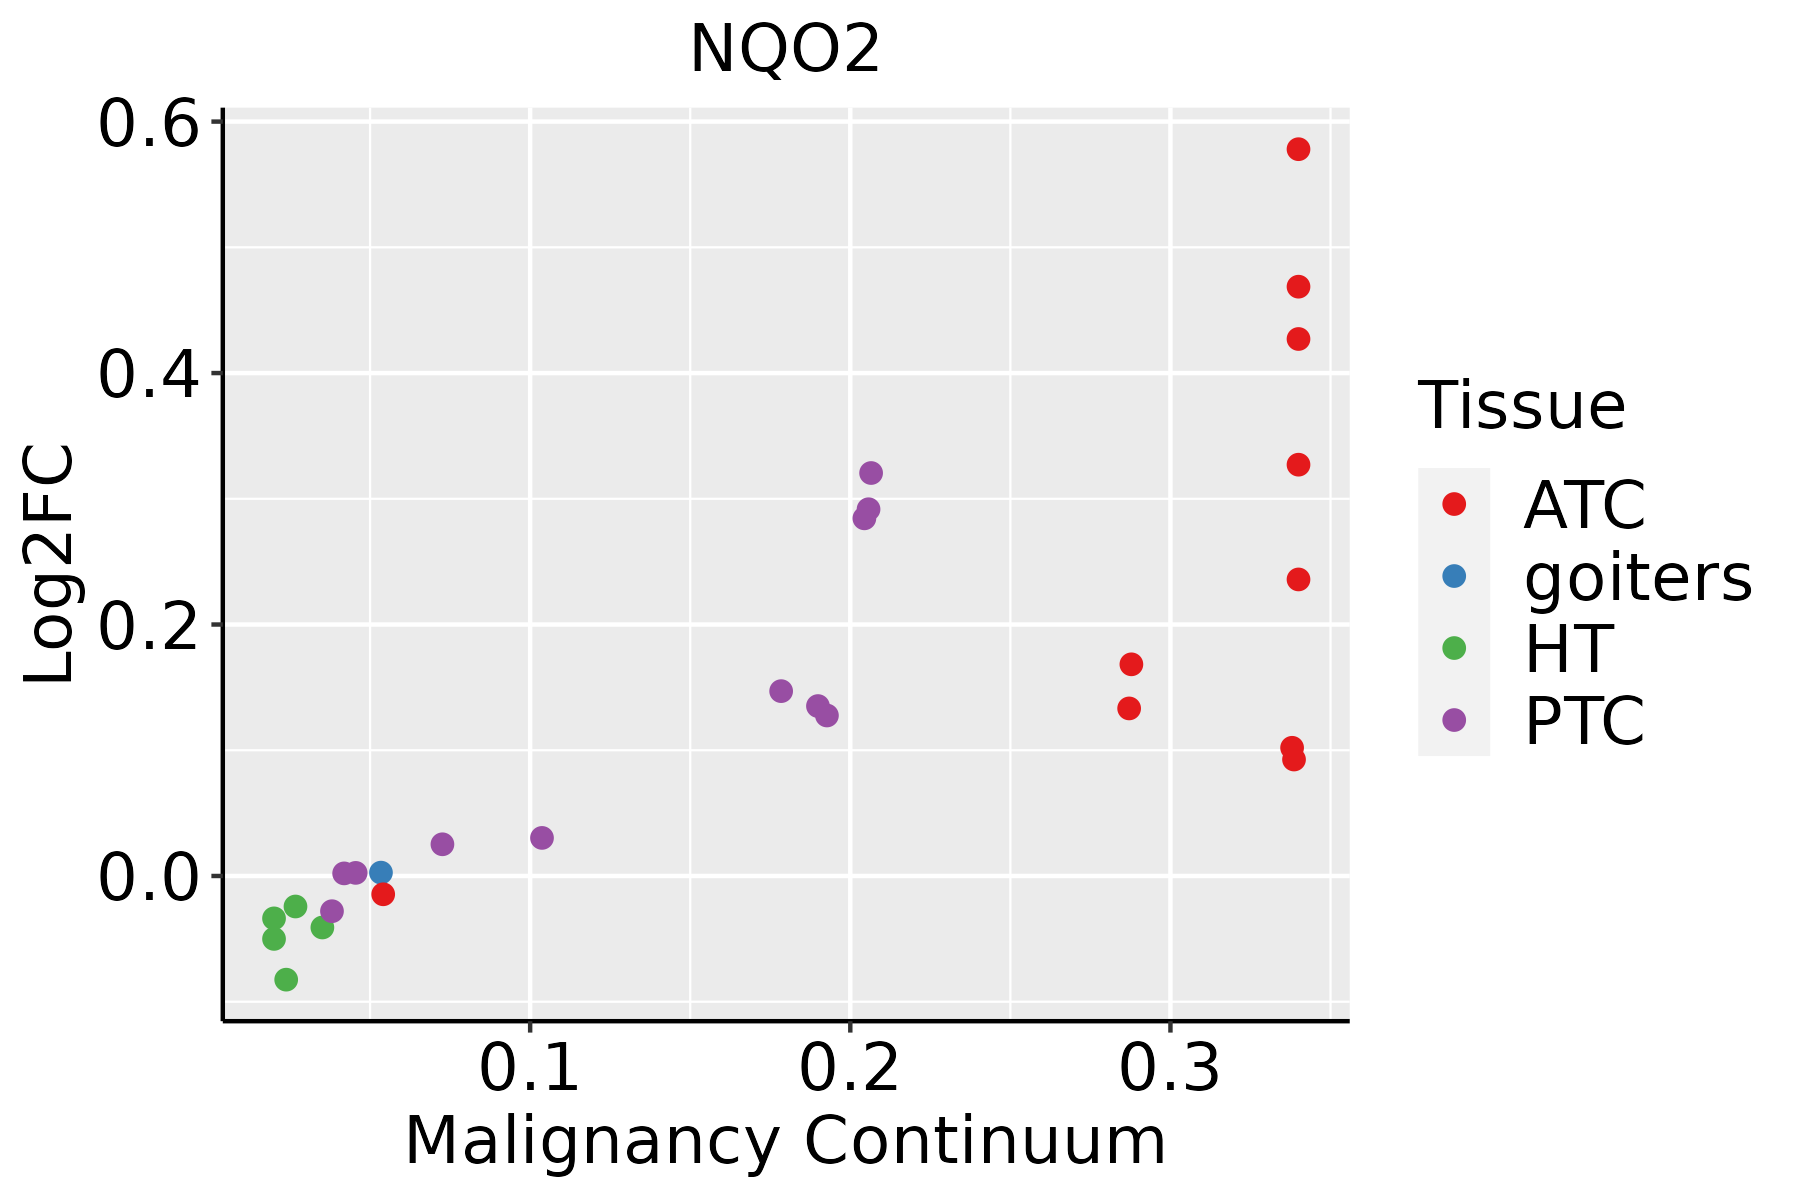 | ATC: Anaplastic thyroid cancer |
| HT: Hashimoto's thyroiditis | ||
| PTC: Papillary thyroid cancer |
| ∗log2FC in expression of this searched gene in stem-like cells from each diseased tissue sample relative to stem-like cells in normal samples in each tissue plotted against the malignancy continuum. Samples are colored based on if they are from different disease stage. |
Top |
Malignant transformation related pathway analysis |
| Find out the enriched GO biological processes and KEGG pathways involved in transition from healthy to precancer to cancer |
| Tissue | Disease Stage | Enriched GO biological Processes |
| Colorectum | AD |  |
| Colorectum | SER |  |
| Colorectum | MSS |  |
| Colorectum | MSI-H |  |
| Colorectum | FAP |  |
| ∗Top 15 enriched GO BP terms are showed in the bar plot of each disease state in each tissue. Each row represents a significant GO biological process which is colored according to the -log10(p.adjust). |
| Page: 1 2 3 4 5 6 7 8 9 |
| GO ID | Tissue | Disease Stage | Description | Gene Ratio | Bg Ratio | pvalue | p.adjust | Count |
| GO:0006091110 | Esophagus | ESCC | generation of precursor metabolites and energy | 331/8552 | 490/18723 | 3.86e-23 | 8.45e-21 | 331 |
| GO:0022900110 | Esophagus | ESCC | electron transport chain | 133/8552 | 175/18723 | 2.18e-16 | 1.67e-14 | 133 |
| GO:0070997111 | Esophagus | ESCC | neuron death | 216/8552 | 361/18723 | 3.49e-08 | 6.45e-07 | 216 |
| GO:190166112 | Esophagus | ESCC | quinone metabolic process | 34/8552 | 40/18723 | 3.00e-07 | 4.27e-06 | 34 |
| GO:0051402110 | Esophagus | ESCC | neuron apoptotic process | 148/8552 | 246/18723 | 3.08e-06 | 3.47e-05 | 148 |
| GO:1901214111 | Esophagus | ESCC | regulation of neuron death | 186/8552 | 319/18723 | 3.35e-06 | 3.73e-05 | 186 |
| GO:200037718 | Esophagus | ESCC | regulation of reactive oxygen species metabolic process | 100/8552 | 157/18723 | 3.87e-06 | 4.17e-05 | 100 |
| GO:1901216111 | Esophagus | ESCC | positive regulation of neuron death | 65/8552 | 97/18723 | 1.76e-05 | 1.56e-04 | 65 |
| GO:007259318 | Esophagus | ESCC | reactive oxygen species metabolic process | 137/8552 | 239/18723 | 1.82e-04 | 1.16e-03 | 137 |
| GO:0043525110 | Esophagus | ESCC | positive regulation of neuron apoptotic process | 40/8552 | 58/18723 | 2.83e-04 | 1.71e-03 | 40 |
| GO:004352317 | Esophagus | ESCC | regulation of neuron apoptotic process | 122/8552 | 212/18723 | 3.21e-04 | 1.90e-03 | 122 |
| GO:00421805 | Esophagus | ESCC | cellular ketone metabolic process | 120/8552 | 211/18723 | 6.70e-04 | 3.55e-03 | 120 |
| GO:00442827 | Esophagus | ESCC | small molecule catabolic process | 201/8552 | 376/18723 | 1.35e-03 | 6.41e-03 | 201 |
| GO:00486597 | Esophagus | ESCC | smooth muscle cell proliferation | 103/8552 | 184/18723 | 3.08e-03 | 1.28e-02 | 103 |
| GO:00486607 | Esophagus | ESCC | regulation of smooth muscle cell proliferation | 100/8552 | 180/18723 | 4.76e-03 | 1.85e-02 | 100 |
| GO:00330025 | Esophagus | ESCC | muscle cell proliferation | 134/8552 | 248/18723 | 4.80e-03 | 1.86e-02 | 134 |
| GO:00486615 | Esophagus | ESCC | positive regulation of smooth muscle cell proliferation | 61/8552 | 104/18723 | 5.22e-03 | 1.97e-02 | 61 |
| GO:200037918 | Esophagus | ESCC | positive regulation of reactive oxygen species metabolic process | 45/8552 | 76/18723 | 1.21e-02 | 4.04e-02 | 45 |
| GO:000609112 | Liver | Cirrhotic | generation of precursor metabolites and energy | 238/4634 | 490/18723 | 6.85e-31 | 1.07e-27 | 238 |
| GO:002290012 | Liver | Cirrhotic | electron transport chain | 111/4634 | 175/18723 | 1.94e-27 | 1.52e-24 | 111 |
| Page: 1 2 3 4 5 6 |
| Pathway ID | Tissue | Disease Stage | Description | Gene Ratio | Bg Ratio | pvalue | p.adjust | qvalue | Count |
| Page: 1 |
Top |
Cell-cell communication analysis |
| Identification of potential cell-cell interactions between two cell types and their ligand-receptor pairs for different disease states |
| Ligand | Receptor | LRpair | Pathway | Tissue | Disease Stage |
| Page: 1 |
Top |
Single-cell gene regulatory network inference analysis |
| Find out the significant the regulons (TFs) and the target genes of each regulon across cell types for different disease states |
| TF | Cell Type | Tissue | Disease Stage | Target Gene | RSS | Regulon Activity |
| ∗The dot plots of a searched regulon are shown for all cell subpopulations in each disease state of each tissue based on the regulon specific score inferred using pySCENIC and by calculating the average expression. |
| Page: 1 |
Top |
Somatic mutation of malignant transformation related genes |
| Annotation of somatic variants for genes involved in malignant transformation |
| Hugo Symbol | Variant Class | Variant Classification | dbSNP RS | HGVSc | HGVSp | HGVSp Short | SWISSPROT | BIOTYPE | SIFT | PolyPhen | Tumor Sample Barcode | Tissue | Histology | Sex | Age | Stage | Therapy Types | Drugs | Outcome |
| NQO2 | SNV | Missense_Mutation | c.479G>A | p.Gly160Glu | p.G160E | P16083 | protein_coding | deleterious(0.02) | possibly_damaging(0.9) | TCGA-A2-A0SY-01 | Breast | breast invasive carcinoma | Female | <65 | III/IV | Hormone Therapy | arimidex | SD | |
| NQO2 | SNV | Missense_Mutation | c.569N>C | p.Ser190Thr | p.S190T | P16083 | protein_coding | tolerated(0.58) | benign(0) | TCGA-EW-A1J3-01 | Breast | breast invasive carcinoma | Female | <65 | I/II | Chemotherapy | carboplatin | SD | |
| NQO2 | insertion | Frame_Shift_Ins | novel | c.472_473insCTCTTGG | p.Lys158ThrfsTer28 | p.K158Tfs*28 | P16083 | protein_coding | TCGA-AO-A03R-01 | Breast | breast invasive carcinoma | Female | <65 | I/II | Chemotherapy | doxorubicin | SD | ||
| NQO2 | insertion | Nonsense_Mutation | novel | c.473_474insTAAGGATCACTATGGATAGTTGGAGGGAGGG | p.Lys158AsnfsTer7 | p.K158Nfs*7 | P16083 | protein_coding | TCGA-AO-A03R-01 | Breast | breast invasive carcinoma | Female | <65 | I/II | Chemotherapy | doxorubicin | SD | ||
| NQO2 | SNV | Missense_Mutation | novel | c.77C>G | p.Ala26Gly | p.A26G | P16083 | protein_coding | deleterious(0) | benign(0.312) | TCGA-AM-5821-01 | Colorectum | colon adenocarcinoma | Female | >=65 | I/II | Unknown | Unknown | SD |
| NQO2 | SNV | Missense_Mutation | novel | c.313N>C | p.Tyr105His | p.Y105H | P16083 | protein_coding | tolerated(0.11) | possibly_damaging(0.845) | TCGA-CK-4951-01 | Colorectum | colon adenocarcinoma | Female | >=65 | I/II | Unknown | Unknown | PD |
| NQO2 | SNV | Missense_Mutation | c.221N>G | p.Glu74Gly | p.E74G | P16083 | protein_coding | tolerated(0.33) | benign(0.144) | TCGA-AG-A02N-01 | Colorectum | rectum adenocarcinoma | Male | >=65 | I/II | Chemotherapy | folinic | CR | |
| NQO2 | insertion | Frame_Shift_Ins | novel | c.76_77insT | p.Ala26ValfsTer4 | p.A26Vfs*4 | P16083 | protein_coding | TCGA-AM-5821-01 | Colorectum | colon adenocarcinoma | Female | >=65 | I/II | Unknown | Unknown | SD | ||
| NQO2 | SNV | Missense_Mutation | rs201753355 | c.688N>A | p.Gly230Arg | p.G230R | P16083 | protein_coding | deleterious(0) | benign(0.059) | TCGA-AP-A0LM-01 | Endometrium | uterine corpus endometrioid carcinoma | Female | <65 | III/IV | Chemotherapy | cisplatin | SD |
| NQO2 | SNV | Missense_Mutation | novel | c.77N>T | p.Ala26Val | p.A26V | P16083 | protein_coding | deleterious(0.02) | possibly_damaging(0.679) | TCGA-AX-A2HD-01 | Endometrium | uterine corpus endometrioid carcinoma | Female | >=65 | III/IV | Unknown | Unknown | SD |
| Page: 1 2 3 |
Top |
Related drugs of malignant transformation related genes |
| Identification of chemicals and drugs interact with genes involved in malignant transfromation |
| (DGIdb 4.0) |
| Entrez ID | Symbol | Category | Interaction Types | Drug Claim Name | Drug Name | PMIDs |
| 4835 | NQO2 | DRUGGABLE GENOME, ENZYME | NSC-640556 | CHEMBL1983317 | 21074425 | |
| 4835 | NQO2 | DRUGGABLE GENOME, ENZYME | NSC-640584 | CHEMBL476968 | 21074425 | |
| 4835 | NQO2 | DRUGGABLE GENOME, ENZYME | NSC-640566 | CHEMBL1287867 | 21074425 | |
| 4835 | NQO2 | DRUGGABLE GENOME, ENZYME | NSC-640559 | CHEMBL1287866 | 21074425 | |
| 4835 | NQO2 | DRUGGABLE GENOME, ENZYME | NSC-640558 | CHEMBL1288281 | 21074425 | |
| 4835 | NQO2 | DRUGGABLE GENOME, ENZYME | NSC-640353 | CHEMBL1288253 | 21074425 | |
| 4835 | NQO2 | DRUGGABLE GENOME, ENZYME | DABIGATRAN | DABIGATRAN | 22494098 | |
| 4835 | NQO2 | DRUGGABLE GENOME, ENZYME | NSC-640583 | CHEMBL1287895 | 21074425 | |
| 4835 | NQO2 | DRUGGABLE GENOME, ENZYME | NSC-645809 | C-1311 | ||
| 4835 | NQO2 | DRUGGABLE GENOME, ENZYME | Melatonin | MELATONIN |
| Page: 1 2 |

Copyright 2023-Present -The University of Texas Health Science Center at Houston |