
|
|||||
|
 | |
| |
| |
| |
| |
| |
|
Gene: NQO1 |
Gene summary for NQO1 |
| Gene information | Species | Human | Gene symbol | NQO1 | Gene ID | 1728 |
| Gene name | NAD(P)H quinone dehydrogenase 1 | |
| Gene Alias | DHQU | |
| Cytomap | 16q22.1 | |
| Gene Type | protein-coding | GO ID | GO:0000302 | UniProtAcc | P15559 |
Top |
Malignant transformation analysis |
| Identification of the aberrant gene expression in precancerous and cancerous lesions by comparing the gene expression of stem-like cells in diseased tissues with normal stem cells |
| Entrez ID | Symbol | Replicates | Species | Organ | Tissue | Adj P-value | Log2FC | Malignancy |
| 1728 | NQO1 | GSM4909282 | Human | Breast | IDC | 9.06e-04 | 2.53e-01 | -0.0288 |
| 1728 | NQO1 | GSM4909285 | Human | Breast | IDC | 2.56e-24 | 4.69e-01 | 0.21 |
| 1728 | NQO1 | GSM4909286 | Human | Breast | IDC | 5.96e-12 | -3.10e-01 | 0.1081 |
| 1728 | NQO1 | GSM4909290 | Human | Breast | IDC | 5.74e-08 | 5.59e-01 | 0.2096 |
| 1728 | NQO1 | GSM4909293 | Human | Breast | IDC | 6.15e-06 | 9.34e-02 | 0.1581 |
| 1728 | NQO1 | GSM4909297 | Human | Breast | IDC | 1.66e-02 | 3.11e-01 | 0.1517 |
| 1728 | NQO1 | GSM4909298 | Human | Breast | IDC | 6.10e-30 | 7.09e-01 | 0.1551 |
| 1728 | NQO1 | GSM4909304 | Human | Breast | IDC | 3.37e-45 | 9.23e-01 | 0.1636 |
| 1728 | NQO1 | GSM4909311 | Human | Breast | IDC | 7.07e-06 | 2.62e-02 | 0.1534 |
| 1728 | NQO1 | GSM4909313 | Human | Breast | IDC | 1.74e-03 | -2.28e-01 | 0.0391 |
| 1728 | NQO1 | GSM4909315 | Human | Breast | IDC | 1.27e-08 | 5.79e-01 | 0.21 |
| 1728 | NQO1 | GSM4909316 | Human | Breast | IDC | 2.54e-05 | 6.50e-01 | 0.21 |
| 1728 | NQO1 | GSM4909317 | Human | Breast | IDC | 2.04e-11 | 5.12e-01 | 0.1355 |
| 1728 | NQO1 | GSM4909318 | Human | Breast | IDC | 2.02e-02 | 6.31e-01 | 0.2031 |
| 1728 | NQO1 | GSM4909319 | Human | Breast | IDC | 2.41e-11 | -8.10e-02 | 0.1563 |
| 1728 | NQO1 | GSM4909321 | Human | Breast | IDC | 1.85e-08 | 5.55e-01 | 0.1559 |
| 1728 | NQO1 | brca1 | Human | Breast | Precancer | 1.53e-05 | 2.97e-01 | -0.0338 |
| 1728 | NQO1 | brca2 | Human | Breast | Precancer | 4.90e-23 | 6.92e-01 | -0.024 |
| 1728 | NQO1 | M2 | Human | Breast | IDC | 5.63e-03 | 6.31e-01 | 0.21 |
| 1728 | NQO1 | NCCBC14 | Human | Breast | DCIS | 1.10e-17 | 7.09e-01 | 0.2021 |
| Page: 1 2 3 4 5 6 7 8 9 10 11 |
| Tissue | Expression Dynamics | Abbreviation |
| Breast | 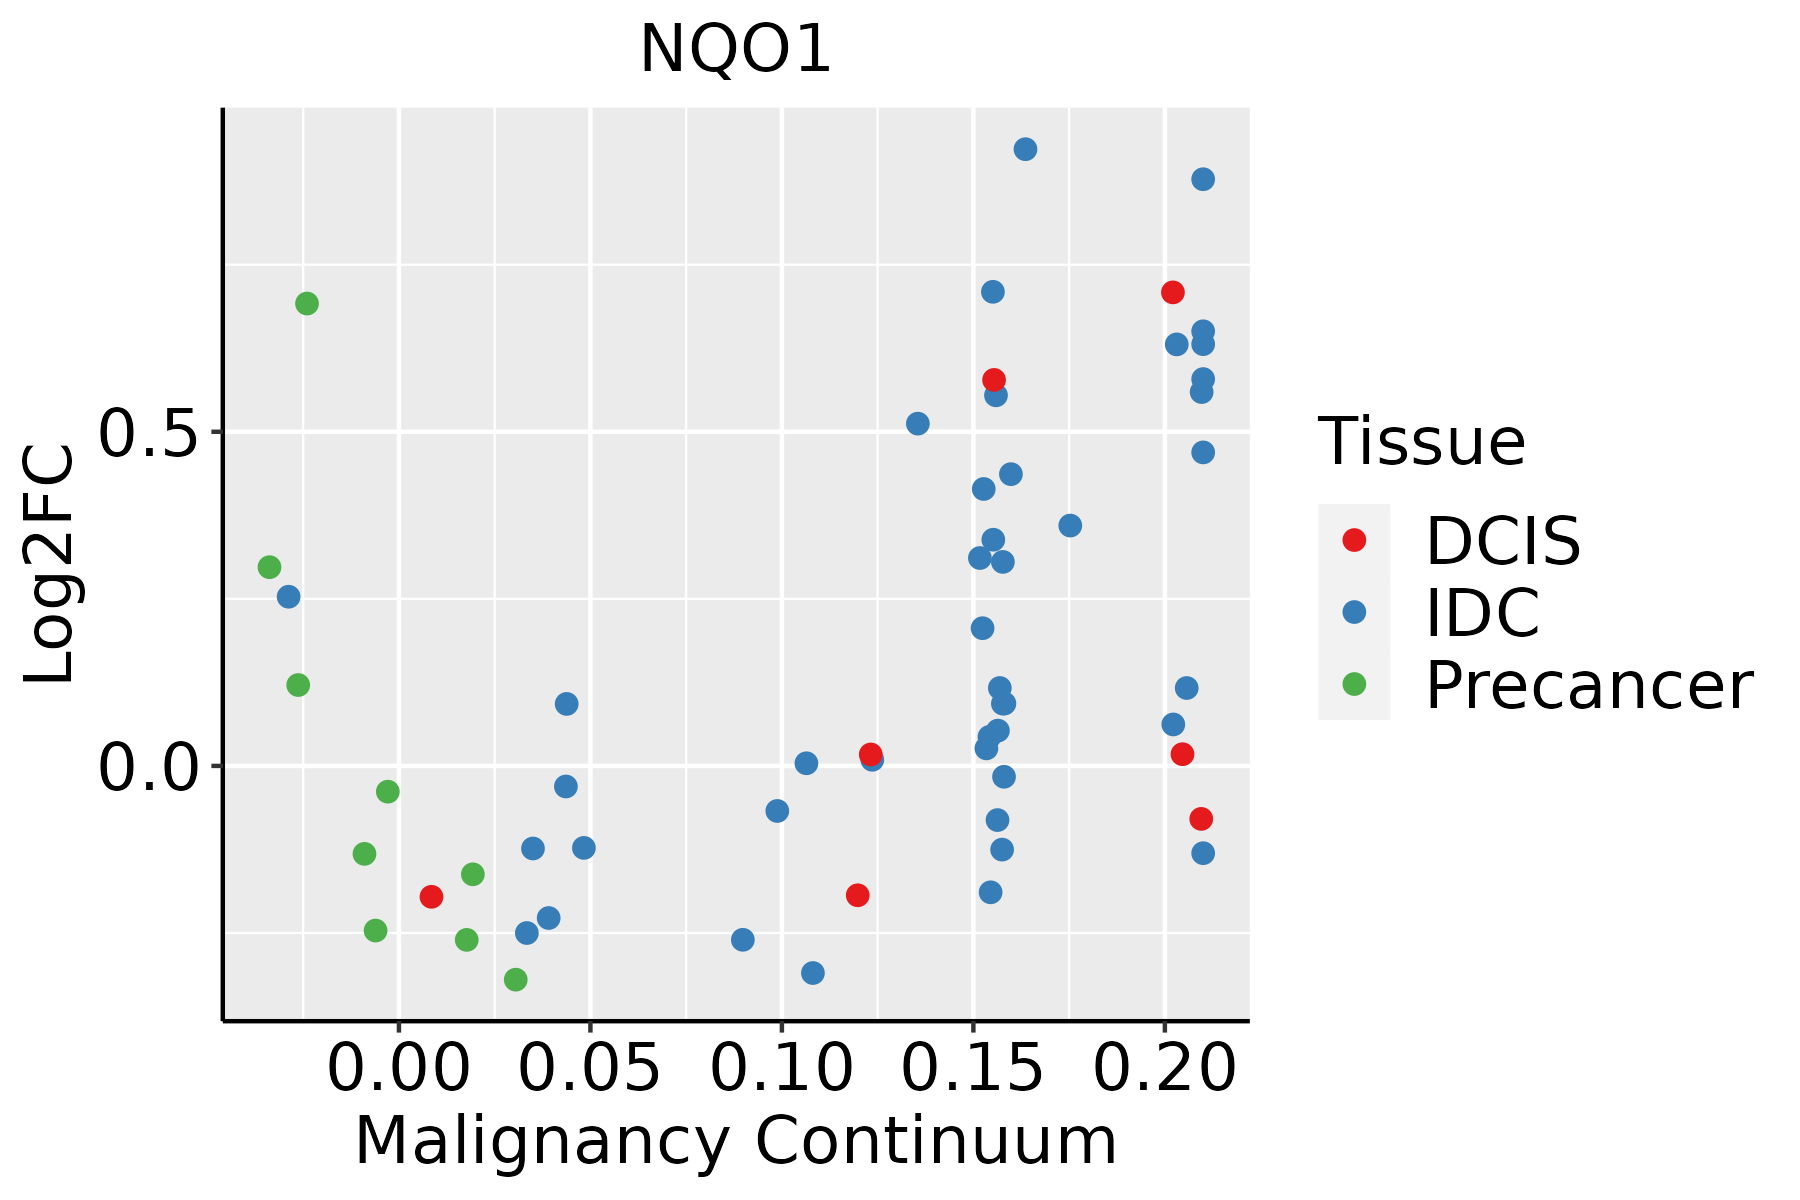 | IDC: Invasive ductal carcinoma |
| DCIS: Ductal carcinoma in situ | ||
| Precancer(BRCA1-mut): Precancerous lesion from BRCA1 mutation carriers | ||
| Cervix |  | CC: Cervix cancer |
| HSIL_HPV: HPV-infected high-grade squamous intraepithelial lesions | ||
| N_HPV: HPV-infected normal cervix | ||
| Colorectum (GSE201348) | 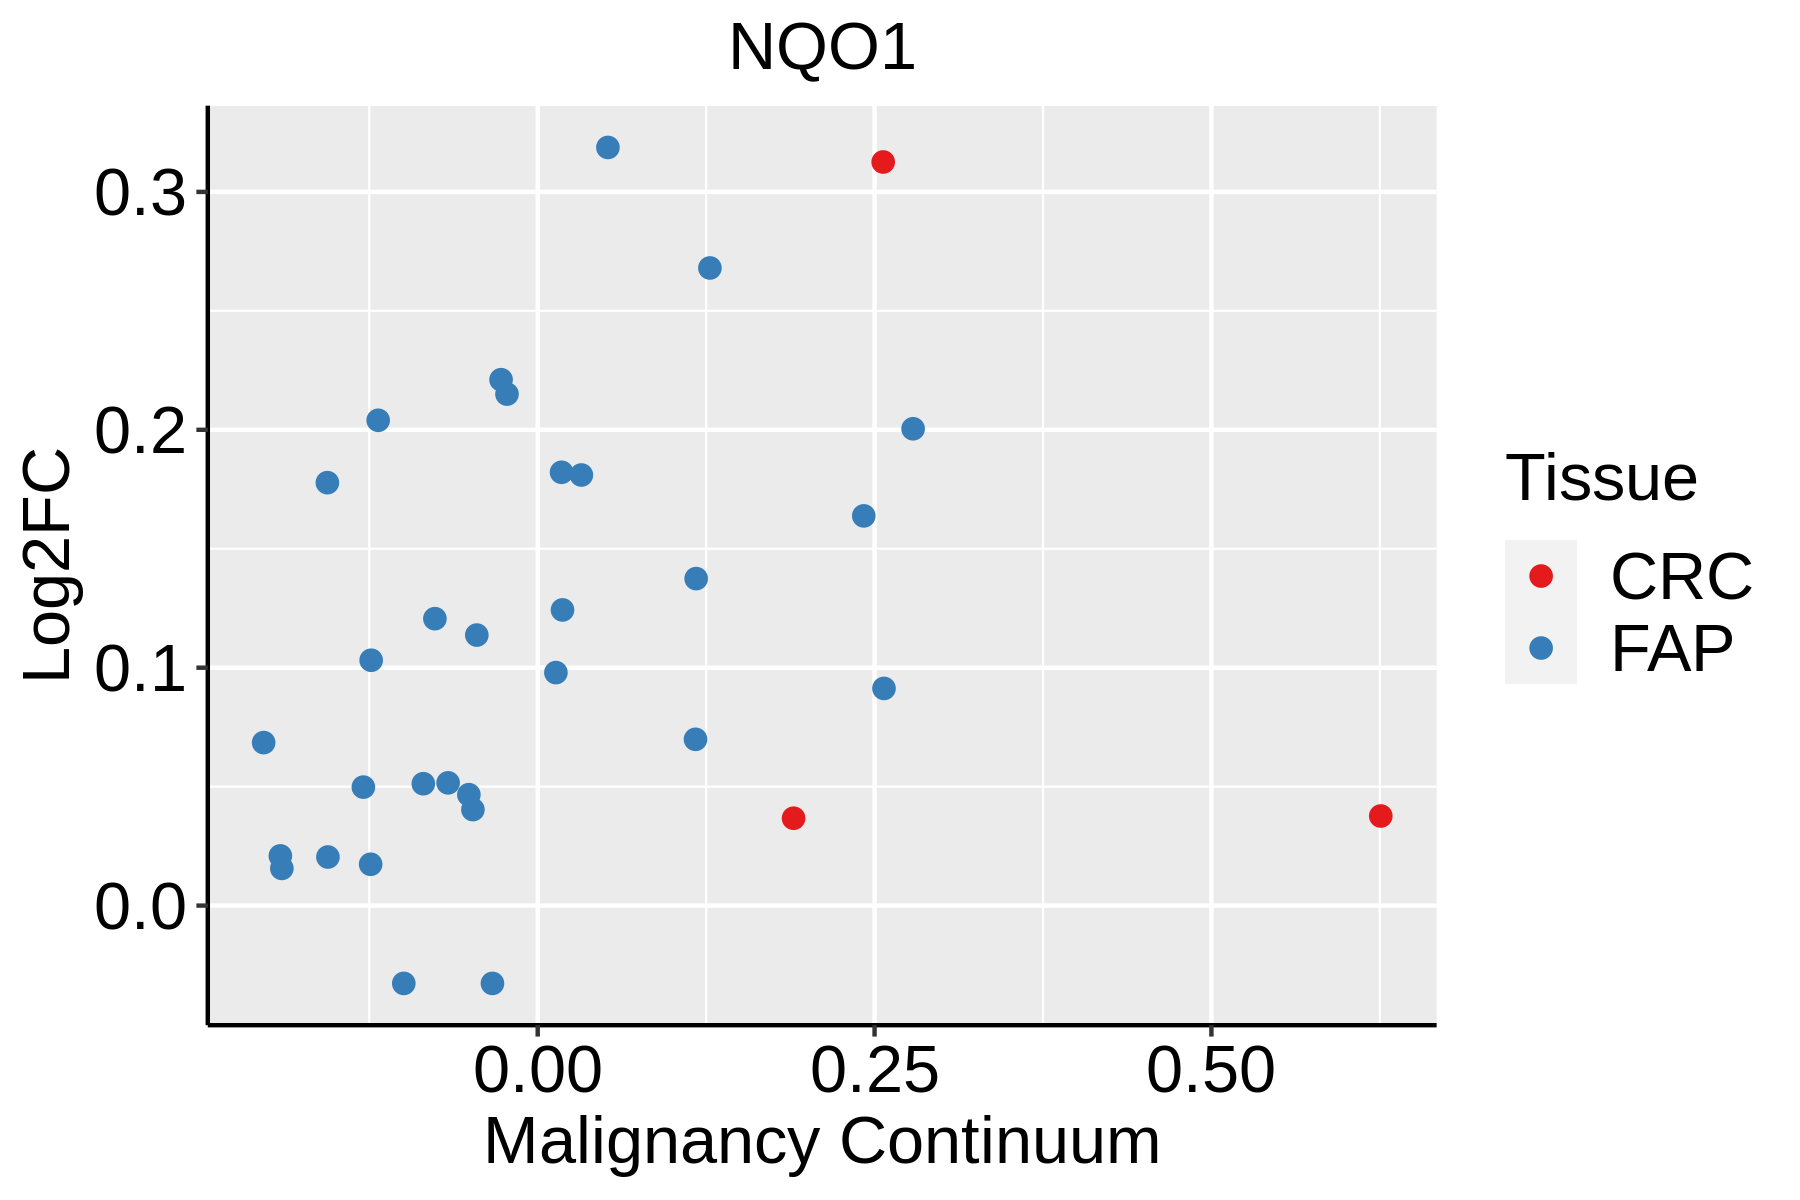 | FAP: Familial adenomatous polyposis |
| CRC: Colorectal cancer | ||
| Colorectum (HTA11) |  | AD: Adenomas |
| SER: Sessile serrated lesions | ||
| MSI-H: Microsatellite-high colorectal cancer | ||
| MSS: Microsatellite stable colorectal cancer | ||
| Esophagus | 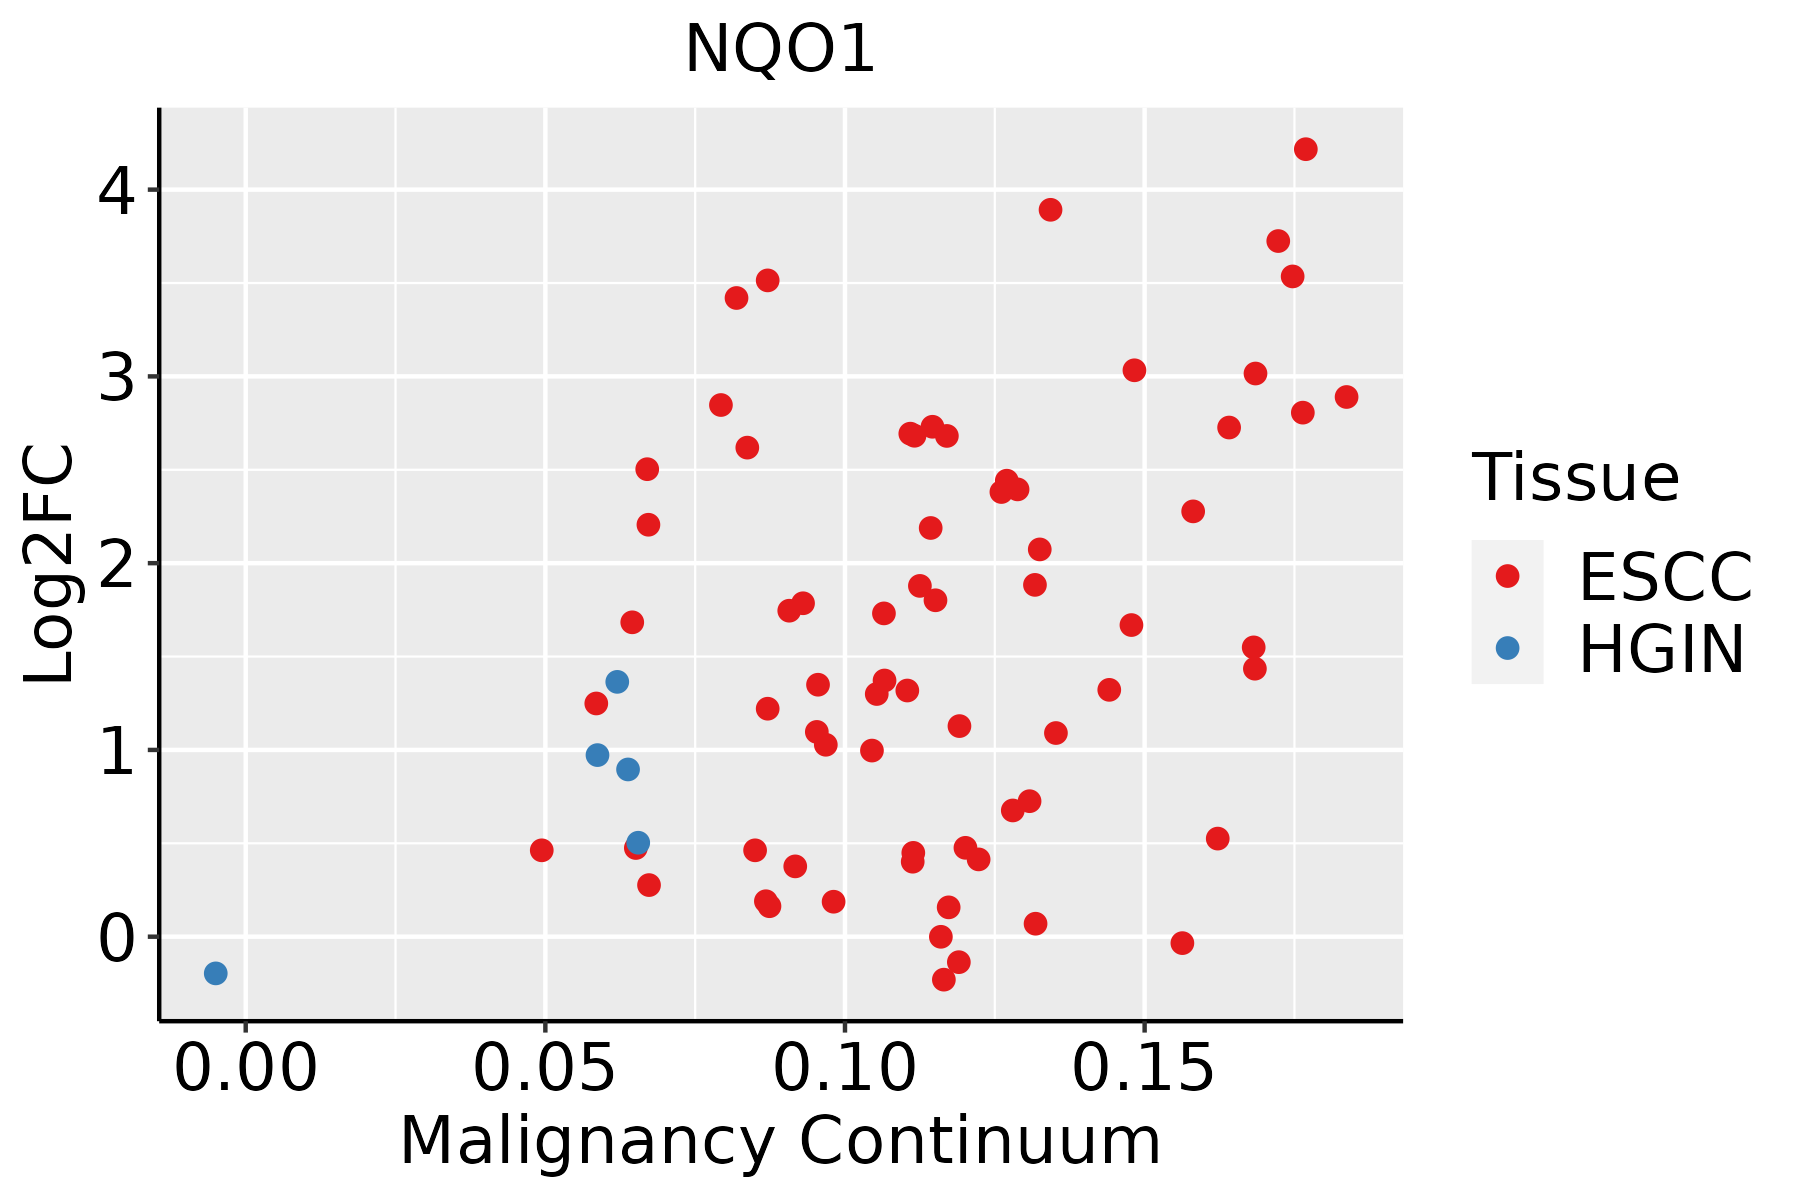 | ESCC: Esophageal squamous cell carcinoma |
| HGIN: High-grade intraepithelial neoplasias | ||
| LGIN: Low-grade intraepithelial neoplasias | ||
| GC |  | CAG: Chronic atrophic gastritis |
| CAG with IM: Chronic atrophic gastritis with intestinal metaplasia | ||
| CSG: Chronic superficial gastritis | ||
| GC: Gastric cancer | ||
| SIM: Severe intestinal metaplasia | ||
| WIM: Wild intestinal metaplasia | ||
| Liver | 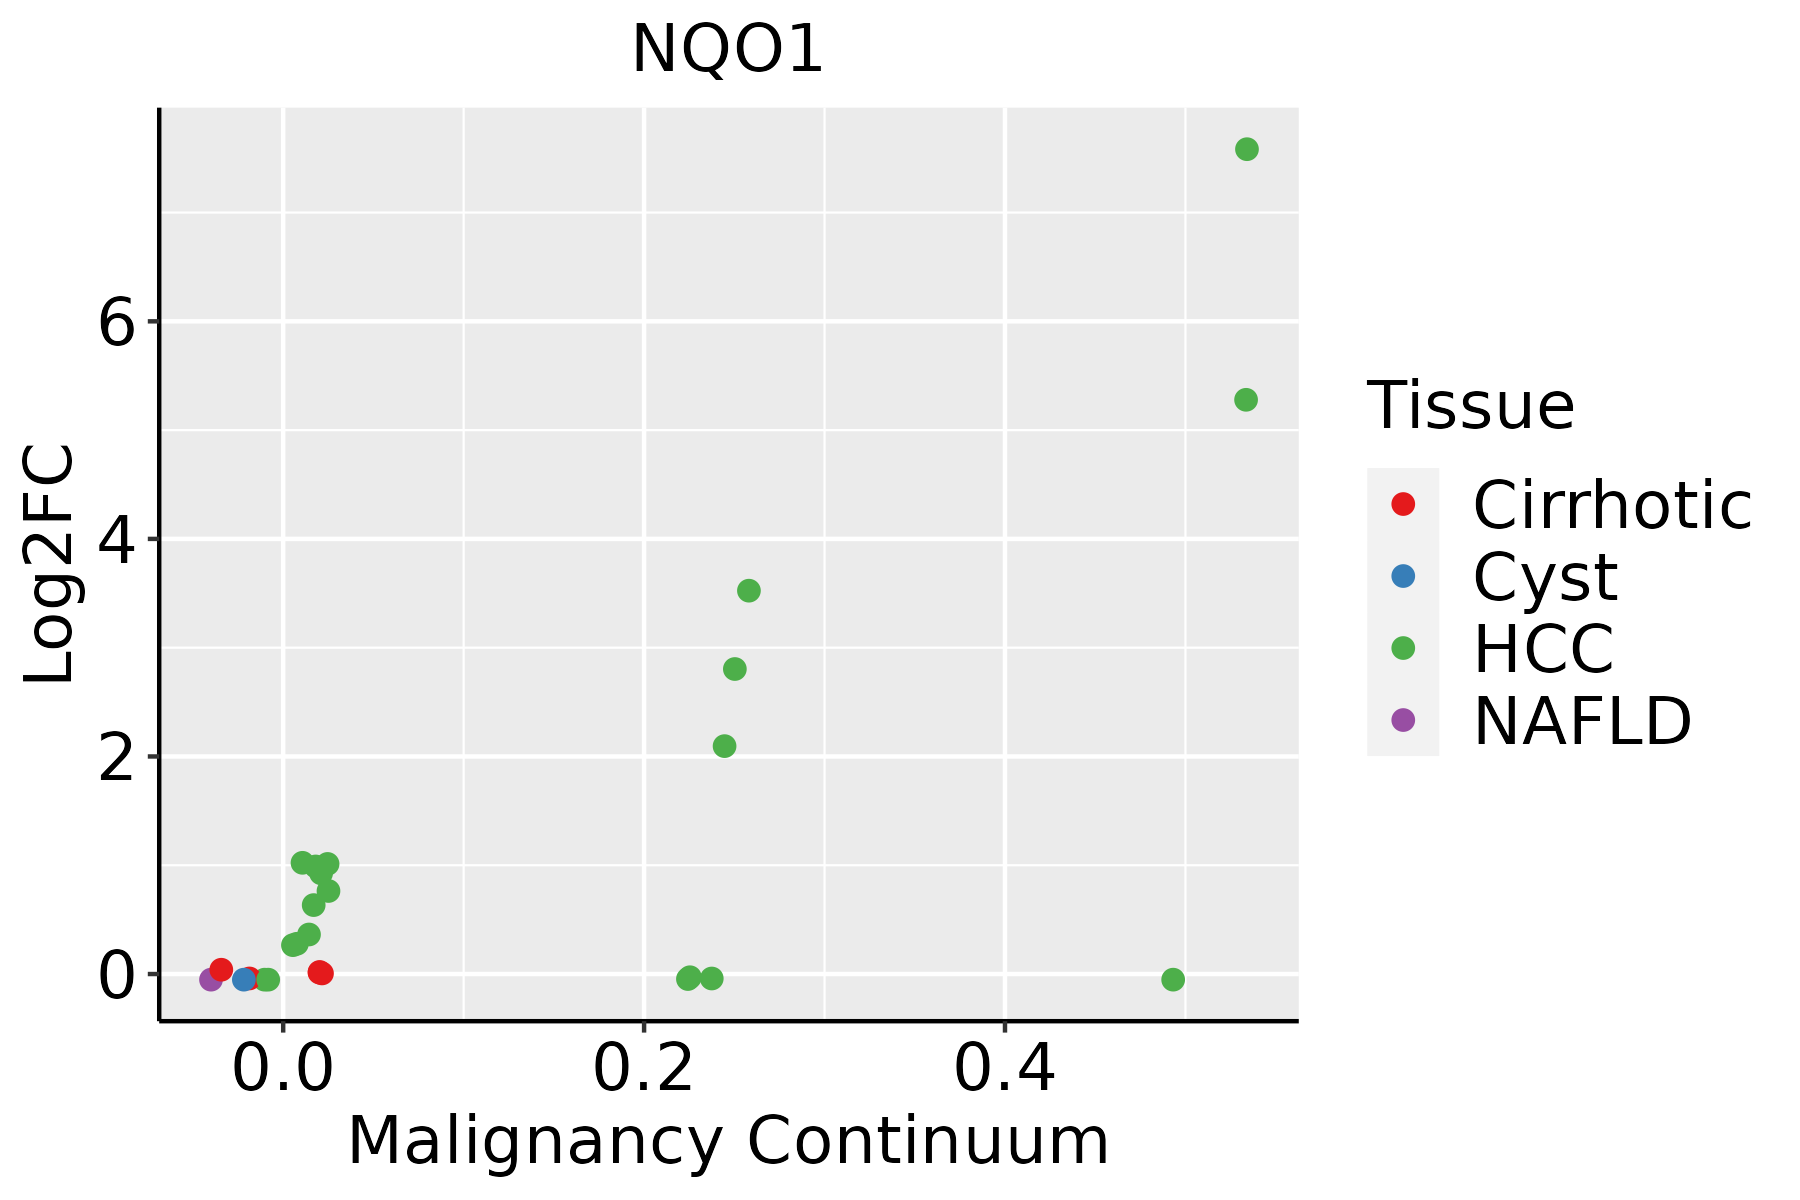 | HCC: Hepatocellular carcinoma |
| NAFLD: Non-alcoholic fatty liver disease | ||
| Oral Cavity |  | EOLP: Erosive Oral lichen planus |
| LP: leukoplakia | ||
| NEOLP: Non-erosive oral lichen planus | ||
| OSCC: Oral squamous cell carcinoma | ||
| Skin | 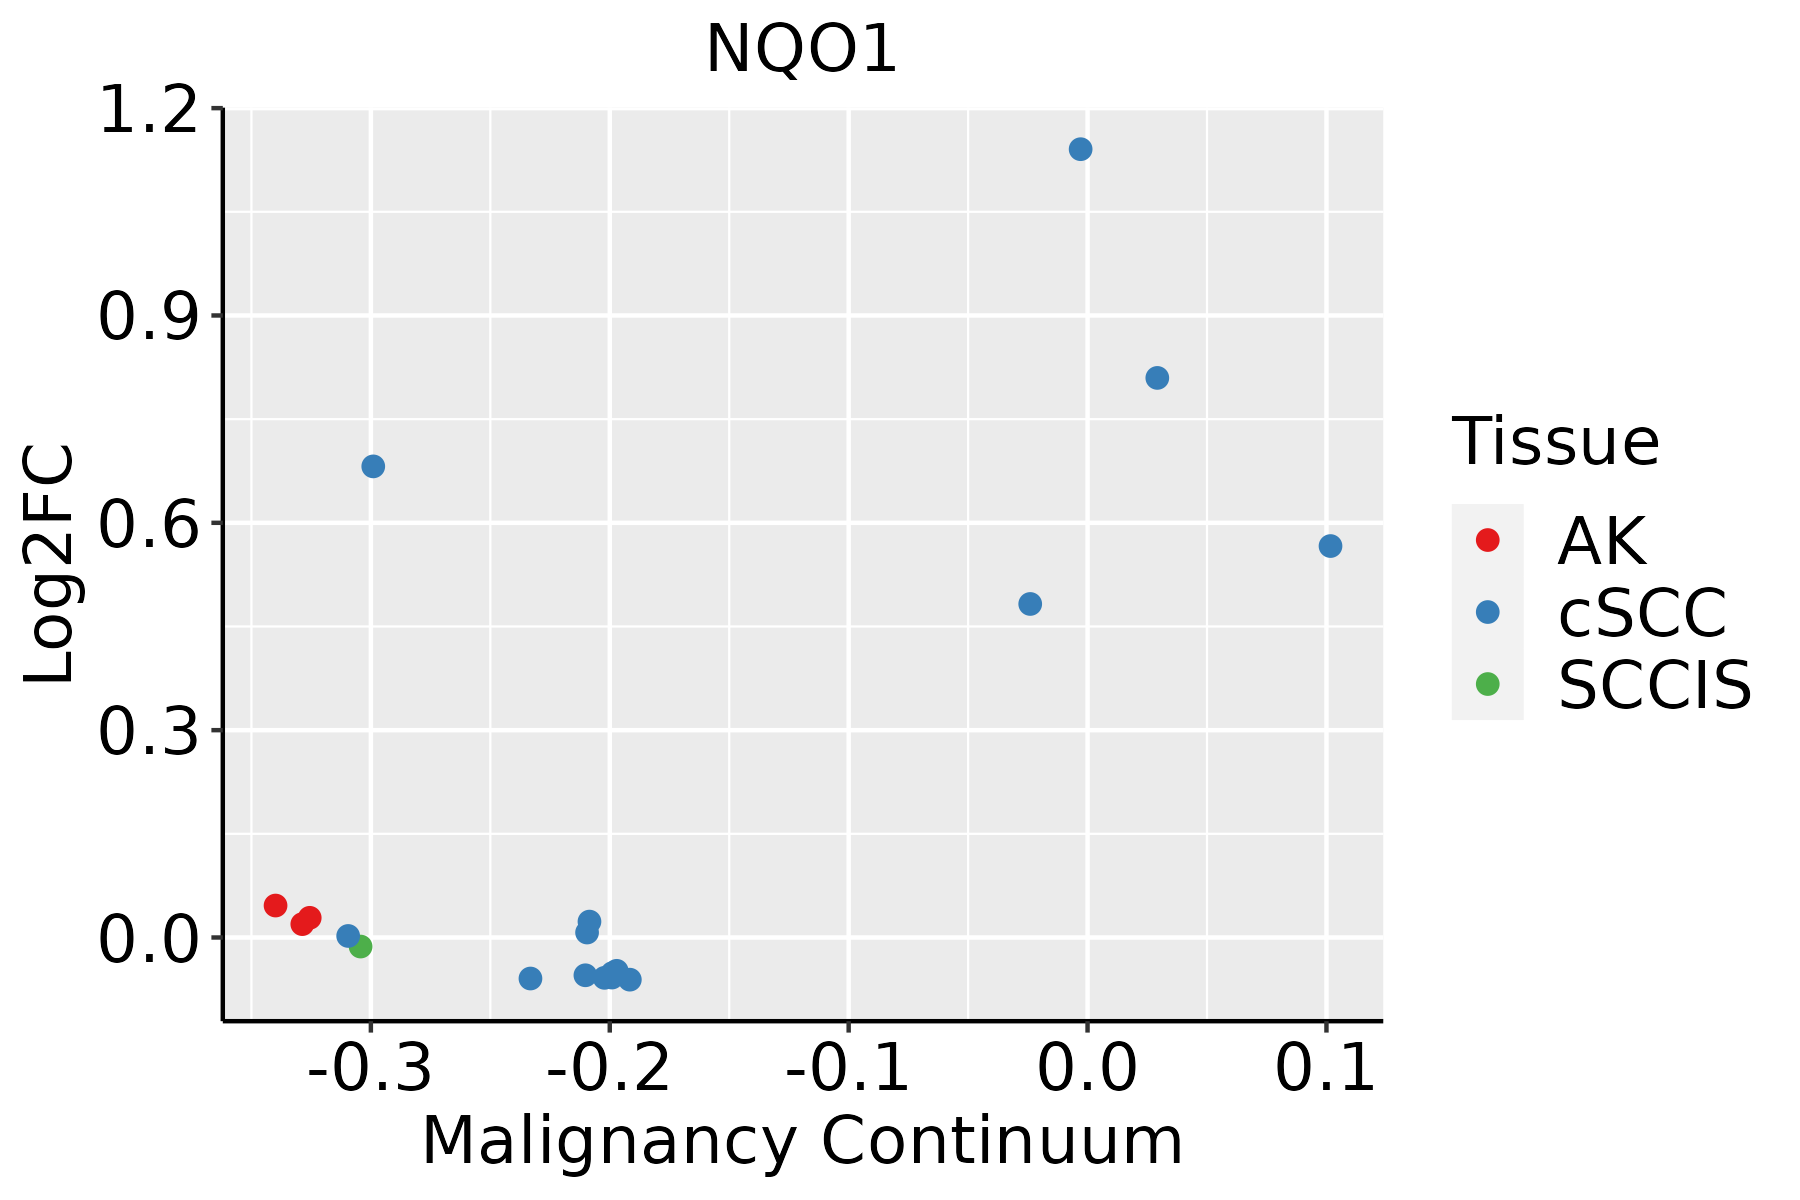 | AK: Actinic keratosis |
| cSCC: Cutaneous squamous cell carcinoma | ||
| SCCIS:squamous cell carcinoma in situ | ||
| Thyroid |  | ATC: Anaplastic thyroid cancer |
| HT: Hashimoto's thyroiditis | ||
| PTC: Papillary thyroid cancer |
| ∗log2FC in expression of this searched gene in stem-like cells from each diseased tissue sample relative to stem-like cells in normal samples in each tissue plotted against the malignancy continuum. Samples are colored based on if they are from different disease stage. |
Top |
Malignant transformation related pathway analysis |
| Find out the enriched GO biological processes and KEGG pathways involved in transition from healthy to precancer to cancer |
| Tissue | Disease Stage | Enriched GO biological Processes |
| Colorectum | AD |  |
| Colorectum | SER |  |
| Colorectum | MSS |  |
| Colorectum | MSI-H |  |
| Colorectum | FAP |  |
| ∗Top 15 enriched GO BP terms are showed in the bar plot of each disease state in each tissue. Each row represents a significant GO biological process which is colored according to the -log10(p.adjust). |
| Page: 1 2 3 4 5 6 7 8 9 |
| GO ID | Tissue | Disease Stage | Description | Gene Ratio | Bg Ratio | pvalue | p.adjust | Count |
| GO:00069799 | Breast | Precancer | response to oxidative stress | 70/1080 | 446/18723 | 1.59e-14 | 4.26e-12 | 70 |
| GO:00621979 | Breast | Precancer | cellular response to chemical stress | 51/1080 | 337/18723 | 2.40e-10 | 2.34e-08 | 51 |
| GO:00003029 | Breast | Precancer | response to reactive oxygen species | 38/1080 | 222/18723 | 1.47e-09 | 1.23e-07 | 38 |
| GO:00709979 | Breast | Precancer | neuron death | 50/1080 | 361/18723 | 7.75e-09 | 5.70e-07 | 50 |
| GO:00514029 | Breast | Precancer | neuron apoptotic process | 38/1080 | 246/18723 | 2.68e-08 | 1.75e-06 | 38 |
| GO:00345999 | Breast | Precancer | cellular response to oxidative stress | 42/1080 | 288/18723 | 2.78e-08 | 1.79e-06 | 42 |
| GO:00425429 | Breast | Precancer | response to hydrogen peroxide | 26/1080 | 146/18723 | 2.52e-07 | 1.26e-05 | 26 |
| GO:00100389 | Breast | Precancer | response to metal ion | 47/1080 | 373/18723 | 3.88e-07 | 1.79e-05 | 47 |
| GO:00988698 | Breast | Precancer | cellular oxidant detoxification | 20/1080 | 101/18723 | 1.07e-06 | 4.18e-05 | 20 |
| GO:19012149 | Breast | Precancer | regulation of neuron death | 41/1080 | 319/18723 | 1.27e-06 | 4.80e-05 | 41 |
| GO:00435237 | Breast | Precancer | regulation of neuron apoptotic process | 31/1080 | 212/18723 | 1.69e-06 | 6.08e-05 | 31 |
| GO:00454548 | Breast | Precancer | cell redox homeostasis | 11/1080 | 35/18723 | 2.59e-06 | 8.65e-05 | 11 |
| GO:19907488 | Breast | Precancer | cellular detoxification | 21/1080 | 116/18723 | 2.67e-06 | 8.89e-05 | 21 |
| GO:00075688 | Breast | Precancer | aging | 41/1080 | 339/18723 | 5.95e-06 | 1.71e-04 | 41 |
| GO:00987548 | Breast | Precancer | detoxification | 24/1080 | 152/18723 | 6.49e-06 | 1.81e-04 | 24 |
| GO:00972378 | Breast | Precancer | cellular response to toxic substance | 21/1080 | 124/18723 | 7.98e-06 | 2.17e-04 | 21 |
| GO:00346149 | Breast | Precancer | cellular response to reactive oxygen species | 23/1080 | 155/18723 | 2.82e-05 | 6.31e-04 | 23 |
| GO:00725938 | Breast | Precancer | reactive oxygen species metabolic process | 30/1080 | 239/18723 | 5.13e-05 | 1.07e-03 | 30 |
| GO:00097439 | Breast | Precancer | response to carbohydrate | 31/1080 | 253/18723 | 6.15e-05 | 1.25e-03 | 31 |
| GO:0002931 | Breast | Precancer | response to ischemia | 12/1080 | 58/18723 | 9.65e-05 | 1.80e-03 | 12 |
| Page: 1 2 3 4 5 6 7 8 9 10 11 12 13 14 15 16 17 18 19 20 21 22 23 24 25 26 27 28 29 30 31 32 33 34 35 36 37 38 39 40 |
| Pathway ID | Tissue | Disease Stage | Description | Gene Ratio | Bg Ratio | pvalue | p.adjust | qvalue | Count |
| hsa0520818 | Breast | Precancer | Chemical carcinogenesis - reactive oxygen species | 68/684 | 223/8465 | 3.61e-23 | 1.14e-21 | 8.73e-22 | 68 |
| hsa0541818 | Breast | Precancer | Fluid shear stress and atherosclerosis | 28/684 | 139/8465 | 4.74e-06 | 6.00e-05 | 4.59e-05 | 28 |
| hsa0520819 | Breast | Precancer | Chemical carcinogenesis - reactive oxygen species | 68/684 | 223/8465 | 3.61e-23 | 1.14e-21 | 8.73e-22 | 68 |
| hsa0541819 | Breast | Precancer | Fluid shear stress and atherosclerosis | 28/684 | 139/8465 | 4.74e-06 | 6.00e-05 | 4.59e-05 | 28 |
| hsa0520824 | Breast | IDC | Chemical carcinogenesis - reactive oxygen species | 71/867 | 223/8465 | 2.55e-19 | 7.53e-18 | 5.63e-18 | 71 |
| hsa0541824 | Breast | IDC | Fluid shear stress and atherosclerosis | 34/867 | 139/8465 | 9.41e-07 | 1.61e-05 | 1.20e-05 | 34 |
| hsa0520834 | Breast | IDC | Chemical carcinogenesis - reactive oxygen species | 71/867 | 223/8465 | 2.55e-19 | 7.53e-18 | 5.63e-18 | 71 |
| hsa0541834 | Breast | IDC | Fluid shear stress and atherosclerosis | 34/867 | 139/8465 | 9.41e-07 | 1.61e-05 | 1.20e-05 | 34 |
| hsa0520843 | Breast | DCIS | Chemical carcinogenesis - reactive oxygen species | 70/846 | 223/8465 | 2.82e-19 | 8.29e-18 | 6.10e-18 | 70 |
| hsa0541844 | Breast | DCIS | Fluid shear stress and atherosclerosis | 34/846 | 139/8465 | 5.31e-07 | 9.03e-06 | 6.65e-06 | 34 |
| hsa0520853 | Breast | DCIS | Chemical carcinogenesis - reactive oxygen species | 70/846 | 223/8465 | 2.82e-19 | 8.29e-18 | 6.10e-18 | 70 |
| hsa0541854 | Breast | DCIS | Fluid shear stress and atherosclerosis | 34/846 | 139/8465 | 5.31e-07 | 9.03e-06 | 6.65e-06 | 34 |
| hsa0520820 | Cervix | CC | Chemical carcinogenesis - reactive oxygen species | 92/1267 | 223/8465 | 4.71e-22 | 5.09e-20 | 3.01e-20 | 92 |
| hsa0541820 | Cervix | CC | Fluid shear stress and atherosclerosis | 50/1267 | 139/8465 | 5.71e-10 | 1.32e-08 | 7.81e-09 | 50 |
| hsa0522510 | Cervix | CC | Hepatocellular carcinoma | 40/1267 | 168/8465 | 1.52e-03 | 6.39e-03 | 3.78e-03 | 40 |
| hsa05208110 | Cervix | CC | Chemical carcinogenesis - reactive oxygen species | 92/1267 | 223/8465 | 4.71e-22 | 5.09e-20 | 3.01e-20 | 92 |
| hsa05418110 | Cervix | CC | Fluid shear stress and atherosclerosis | 50/1267 | 139/8465 | 5.71e-10 | 1.32e-08 | 7.81e-09 | 50 |
| hsa0522513 | Cervix | CC | Hepatocellular carcinoma | 40/1267 | 168/8465 | 1.52e-03 | 6.39e-03 | 3.78e-03 | 40 |
| hsa0520825 | Cervix | HSIL_HPV | Chemical carcinogenesis - reactive oxygen species | 30/459 | 223/8465 | 3.28e-06 | 5.65e-05 | 4.57e-05 | 30 |
| hsa0541825 | Cervix | HSIL_HPV | Fluid shear stress and atherosclerosis | 16/459 | 139/8465 | 3.41e-03 | 2.08e-02 | 1.68e-02 | 16 |
| Page: 1 2 3 4 5 6 |
Top |
Cell-cell communication analysis |
| Identification of potential cell-cell interactions between two cell types and their ligand-receptor pairs for different disease states |
| Ligand | Receptor | LRpair | Pathway | Tissue | Disease Stage |
| Page: 1 |
Top |
Single-cell gene regulatory network inference analysis |
| Find out the significant the regulons (TFs) and the target genes of each regulon across cell types for different disease states |
| TF | Cell Type | Tissue | Disease Stage | Target Gene | RSS | Regulon Activity |
| ∗The dot plots of a searched regulon are shown for all cell subpopulations in each disease state of each tissue based on the regulon specific score inferred using pySCENIC and by calculating the average expression. |
| Page: 1 |
Top |
Somatic mutation of malignant transformation related genes |
| Annotation of somatic variants for genes involved in malignant transformation |
| Hugo Symbol | Variant Class | Variant Classification | dbSNP RS | HGVSc | HGVSp | HGVSp Short | SWISSPROT | BIOTYPE | SIFT | PolyPhen | Tumor Sample Barcode | Tissue | Histology | Sex | Age | Stage | Therapy Types | Drugs | Outcome |
| NQO1 | SNV | Missense_Mutation | c.652N>A | p.Glu218Lys | p.E218K | P15559 | protein_coding | deleterious(0) | probably_damaging(0.989) | TCGA-EX-A3L1-01 | Cervix | cervical & endocervical cancer | Female | <65 | I/II | Chemotherapy | cisplatin | CR | |
| NQO1 | SNV | Missense_Mutation | rs114112422 | c.631C>T | p.Arg211Cys | p.R211C | P15559 | protein_coding | deleterious(0) | probably_damaging(0.999) | TCGA-AA-3852-01 | Colorectum | colon adenocarcinoma | Male | >=65 | I/II | Unknown | Unknown | PD |
| NQO1 | SNV | Missense_Mutation | novel | c.820N>G | p.Lys274Glu | p.K274E | P15559 | protein_coding | tolerated_low_confidence(0.17) | benign(0) | TCGA-AA-A00N-01 | Colorectum | colon adenocarcinoma | Male | >=65 | I/II | Unknown | Unknown | PD |
| NQO1 | insertion | In_Frame_Ins | novel | c.311_313dupTGC | p.Leu104dup | p.L104dup | P15559 | protein_coding | TCGA-CA-5254-01 | Colorectum | colon adenocarcinoma | Female | <65 | I/II | Chemotherapy | oxaliplatin | CR | ||
| NQO1 | SNV | Missense_Mutation | rs766847268 | c.602G>A | p.Arg201Gln | p.R201Q | P15559 | protein_coding | deleterious(0) | probably_damaging(0.995) | TCGA-AJ-A3EL-01 | Endometrium | uterine corpus endometrioid carcinoma | Female | <65 | I/II | Unknown | Unknown | SD |
| NQO1 | SNV | Missense_Mutation | c.465N>A | p.Met155Ile | p.M155I | P15559 | protein_coding | deleterious(0.01) | probably_damaging(0.918) | TCGA-AP-A059-01 | Endometrium | uterine corpus endometrioid carcinoma | Female | >=65 | I/II | Unknown | Unknown | SD | |
| NQO1 | SNV | Missense_Mutation | rs766847268 | c.602G>A | p.Arg201Gln | p.R201Q | P15559 | protein_coding | deleterious(0) | probably_damaging(0.995) | TCGA-AP-A1DV-01 | Endometrium | uterine corpus endometrioid carcinoma | Female | <65 | I/II | Unknown | Unknown | SD |
| NQO1 | SNV | Missense_Mutation | novel | c.639N>T | p.Glu213Asp | p.E213D | P15559 | protein_coding | tolerated(0.15) | benign(0.011) | TCGA-AX-A2HC-01 | Endometrium | uterine corpus endometrioid carcinoma | Female | <65 | III/IV | Chemotherapy | paclitaxel | PD |
| NQO1 | SNV | Missense_Mutation | rs766847268 | c.602N>A | p.Arg201Gln | p.R201Q | P15559 | protein_coding | deleterious(0) | probably_damaging(0.995) | TCGA-B5-A0JY-01 | Endometrium | uterine corpus endometrioid carcinoma | Female | <65 | III/IV | Chemotherapy | doxorubicin | SD |
| NQO1 | SNV | Missense_Mutation | c.392N>T | p.Ala131Val | p.A131V | P15559 | protein_coding | tolerated(0.15) | benign(0.05) | TCGA-B5-A0JY-01 | Endometrium | uterine corpus endometrioid carcinoma | Female | <65 | III/IV | Chemotherapy | doxorubicin | SD |
| Page: 1 2 3 |
Top |
Related drugs of malignant transformation related genes |
| Identification of chemicals and drugs interact with genes involved in malignant transfromation |
| (DGIdb 4.0) |
| Entrez ID | Symbol | Category | Interaction Types | Drug Claim Name | Drug Name | PMIDs |
| 1728 | NQO1 | ENZYME, DRUGGABLE GENOME, CLINICALLY ACTIONABLE | MENADIONE | MENADIONE | ||
| 1728 | NQO1 | ENZYME, DRUGGABLE GENOME, CLINICALLY ACTIONABLE | anthracyclines and related substances | 25545243,24533712,11160862,21479364,10208650,21946896,18511948 | ||
| 1728 | NQO1 | ENZYME, DRUGGABLE GENOME, CLINICALLY ACTIONABLE | modulator | CHEMBL1812161 | VATIQUINONE | |
| 1728 | NQO1 | ENZYME, DRUGGABLE GENOME, CLINICALLY ACTIONABLE | imatinib | IMATINIB | 30237583 | |
| 1728 | NQO1 | ENZYME, DRUGGABLE GENOME, CLINICALLY ACTIONABLE | NSC-640566 | CHEMBL1287867 | 21074425 | |
| 1728 | NQO1 | ENZYME, DRUGGABLE GENOME, CLINICALLY ACTIONABLE | DOX | 15659049 | ||
| 1728 | NQO1 | ENZYME, DRUGGABLE GENOME, CLINICALLY ACTIONABLE | NSC-640558 | CHEMBL1288281 | 21074425 | |
| 1728 | NQO1 | ENZYME, DRUGGABLE GENOME, CLINICALLY ACTIONABLE | benzene | BENZENE | 15935810 | |
| 1728 | NQO1 | ENZYME, DRUGGABLE GENOME, CLINICALLY ACTIONABLE | ORAL CONTRACEPTIVE | 15298951 | ||
| 1728 | NQO1 | ENZYME, DRUGGABLE GENOME, CLINICALLY ACTIONABLE | NSC-640556 | CHEMBL1983317 | 21074425 |
| Page: 1 2 3 4 |

Copyright 2023-Present -The University of Texas Health Science Center at Houston |