
|
|||||
|
 | |
| |
| |
| |
| |
| |
|
Gene: NPY1R |
Gene summary for NPY1R |
| Gene information | Species | Human | Gene symbol | NPY1R | Gene ID | 4886 |
| Gene name | neuropeptide Y receptor Y1 | |
| Gene Alias | NPY1-R | |
| Cytomap | 4q32.2 | |
| Gene Type | protein-coding | GO ID | GO:0003007 | UniProtAcc | P25929 |
Top |
Malignant transformation analysis |
| Identification of the aberrant gene expression in precancerous and cancerous lesions by comparing the gene expression of stem-like cells in diseased tissues with normal stem cells |
| Entrez ID | Symbol | Replicates | Species | Organ | Tissue | Adj P-value | Log2FC | Malignancy |
| 4886 | NPY1R | GSM4909293 | Human | Breast | IDC | 2.23e-14 | 3.25e-01 | 0.1581 |
| 4886 | NPY1R | GSM4909297 | Human | Breast | IDC | 2.79e-08 | 3.74e-01 | 0.1517 |
| 4886 | NPY1R | GSM4909301 | Human | Breast | IDC | 1.92e-05 | 2.56e-01 | 0.1577 |
| 4886 | NPY1R | GSM4909302 | Human | Breast | IDC | 3.83e-07 | 3.07e-01 | 0.1545 |
| 4886 | NPY1R | GSM4909304 | Human | Breast | IDC | 3.50e-06 | 2.23e-01 | 0.1636 |
| 4886 | NPY1R | GSM4909307 | Human | Breast | IDC | 4.97e-02 | 1.55e-01 | 0.1569 |
| 4886 | NPY1R | GSM4909308 | Human | Breast | IDC | 6.60e-46 | 8.19e-01 | 0.158 |
| 4886 | NPY1R | GSM4909312 | Human | Breast | IDC | 7.10e-06 | 2.70e-01 | 0.1552 |
| 4886 | NPY1R | M5 | Human | Breast | IDC | 6.79e-20 | 1.15e+00 | 0.1598 |
| 4886 | NPY1R | NCCBC3 | Human | Breast | DCIS | 9.23e-05 | 2.41e-01 | 0.1198 |
| 4886 | NPY1R | P3 | Human | Breast | IDC | 1.41e-20 | 1.36e+00 | 0.1542 |
| Page: 1 |
| Tissue | Expression Dynamics | Abbreviation |
| Breast | 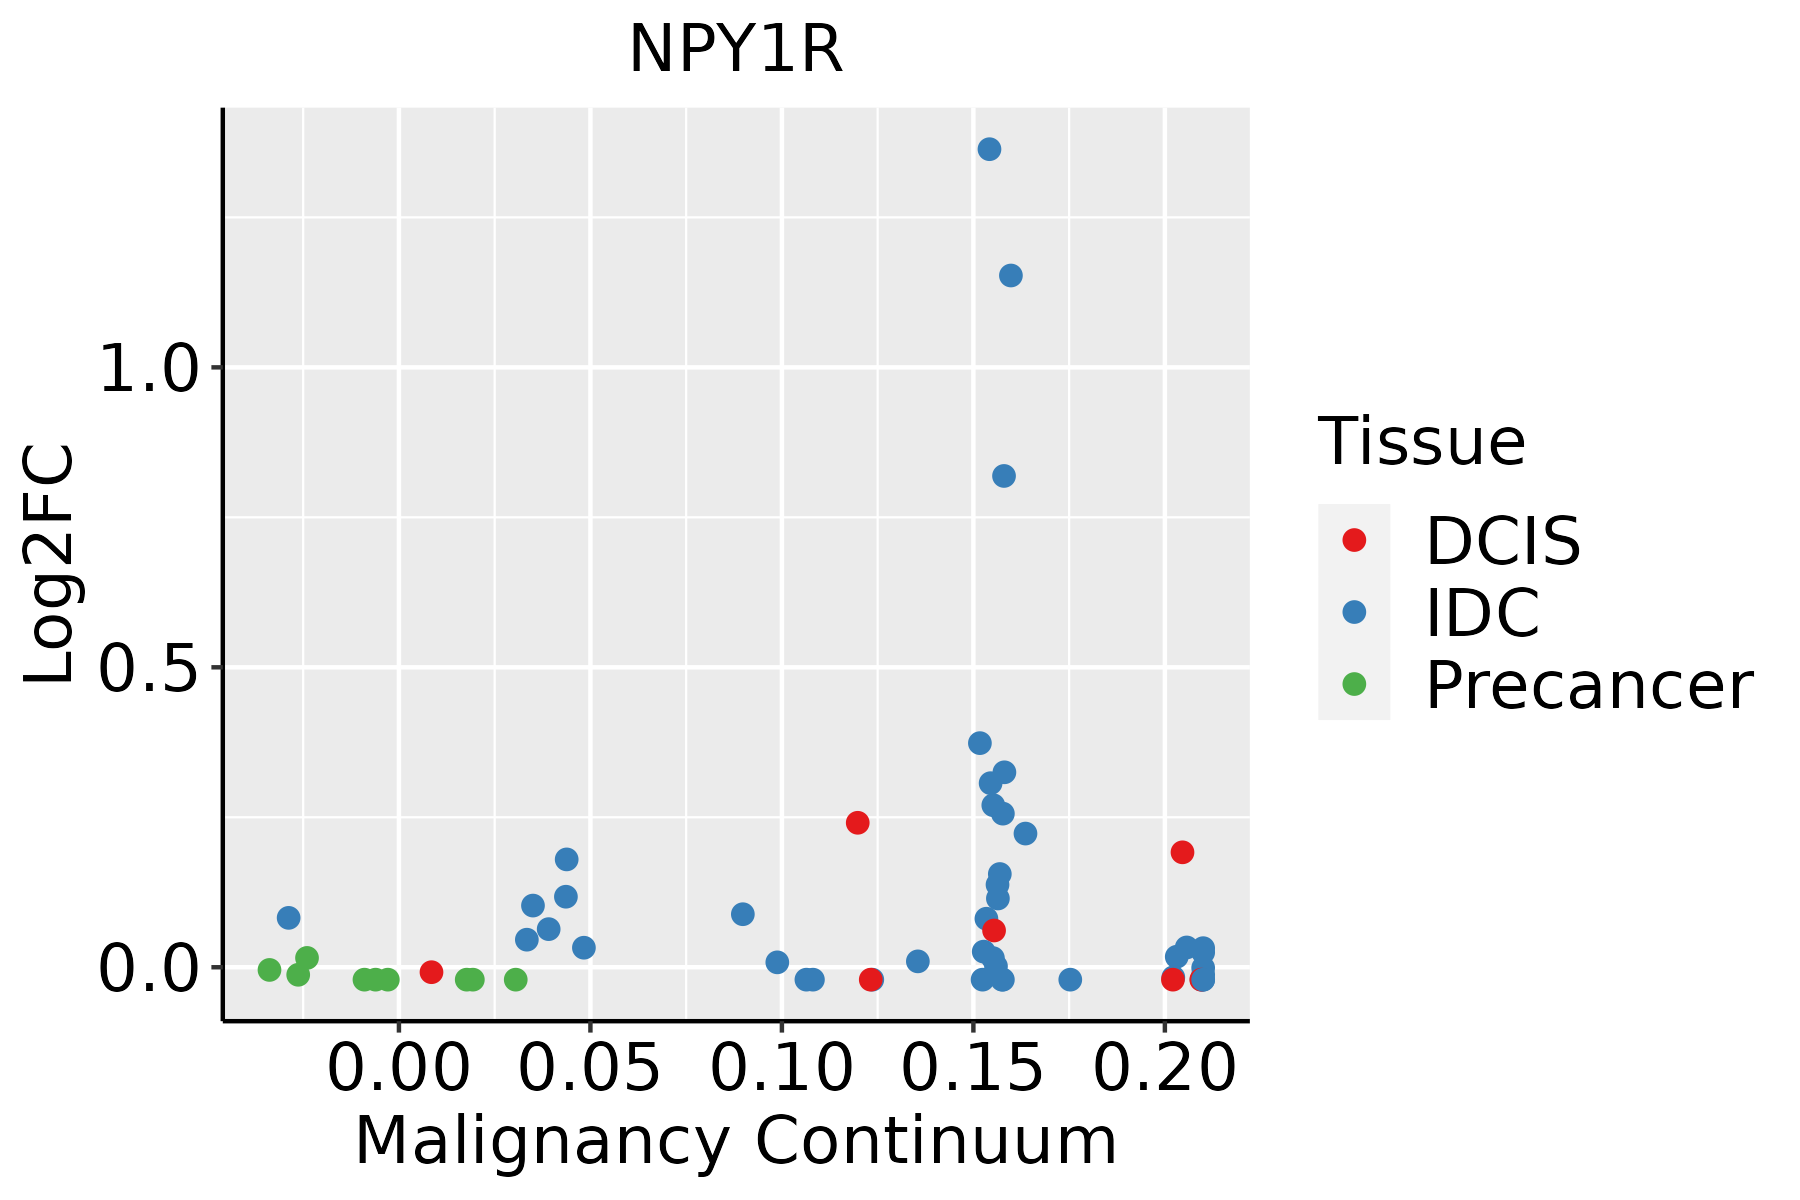 | IDC: Invasive ductal carcinoma |
| DCIS: Ductal carcinoma in situ | ||
| Precancer(BRCA1-mut): Precancerous lesion from BRCA1 mutation carriers |
| ∗log2FC in expression of this searched gene in stem-like cells from each diseased tissue sample relative to stem-like cells in normal samples in each tissue plotted against the malignancy continuum. Samples are colored based on if they are from different disease stage. |
Top |
Malignant transformation related pathway analysis |
| Find out the enriched GO biological processes and KEGG pathways involved in transition from healthy to precancer to cancer |
| Tissue | Disease Stage | Enriched GO biological Processes |
| Colorectum | AD |  |
| Colorectum | SER |  |
| Colorectum | MSS |  |
| Colorectum | MSI-H |  |
| Colorectum | FAP |  |
| ∗Top 15 enriched GO BP terms are showed in the bar plot of each disease state in each tissue. Each row represents a significant GO biological process which is colored according to the -log10(p.adjust). |
| Page: 1 2 3 4 5 6 7 8 9 |
| GO ID | Tissue | Disease Stage | Description | Gene Ratio | Bg Ratio | pvalue | p.adjust | Count |
| Page: 1 |
| Pathway ID | Tissue | Disease Stage | Description | Gene Ratio | Bg Ratio | pvalue | p.adjust | qvalue | Count |
| Page: 1 |
Top |
Cell-cell communication analysis |
| Identification of potential cell-cell interactions between two cell types and their ligand-receptor pairs for different disease states |
| Ligand | Receptor | LRpair | Pathway | Tissue | Disease Stage |
| Page: 1 |
Top |
Single-cell gene regulatory network inference analysis |
| Find out the significant the regulons (TFs) and the target genes of each regulon across cell types for different disease states |
| TF | Cell Type | Tissue | Disease Stage | Target Gene | RSS | Regulon Activity |
| ∗The dot plots of a searched regulon are shown for all cell subpopulations in each disease state of each tissue based on the regulon specific score inferred using pySCENIC and by calculating the average expression. |
| Page: 1 |
Top |
Somatic mutation of malignant transformation related genes |
| Annotation of somatic variants for genes involved in malignant transformation |
| Hugo Symbol | Variant Class | Variant Classification | dbSNP RS | HGVSc | HGVSp | HGVSp Short | SWISSPROT | BIOTYPE | SIFT | PolyPhen | Tumor Sample Barcode | Tissue | Histology | Sex | Age | Stage | Therapy Types | Drugs | Outcome |
| NPY1R | SNV | Missense_Mutation | c.568N>A | p.Asp190Asn | p.D190N | P25929 | protein_coding | tolerated(0.27) | benign(0.274) | TCGA-AC-A23C-01 | Breast | breast invasive carcinoma | Female | <65 | I/II | Chemotherapy | chemo | CR | |
| NPY1R | SNV | Missense_Mutation | c.85N>A | p.Glu29Lys | p.E29K | P25929 | protein_coding | tolerated(0.35) | benign(0.023) | TCGA-AC-A23H-01 | Breast | breast invasive carcinoma | Female | >=65 | I/II | Unknown | Unknown | PD | |
| NPY1R | SNV | Missense_Mutation | c.426N>G | p.Ile142Met | p.I142M | P25929 | protein_coding | deleterious(0) | probably_damaging(0.998) | TCGA-AR-A0TZ-01 | Breast | breast invasive carcinoma | Female | <65 | III/IV | Unspecific | Doxorubicin | PD | |
| NPY1R | SNV | Missense_Mutation | c.679N>C | p.Ile227Leu | p.I227L | P25929 | protein_coding | deleterious(0.01) | possibly_damaging(0.498) | TCGA-BH-A0W4-01 | Breast | breast invasive carcinoma | Female | <65 | I/II | Unknown | Unknown | SD | |
| NPY1R | SNV | Missense_Mutation | novel | c.919N>A | p.Leu307Ile | p.L307I | P25929 | protein_coding | deleterious(0) | probably_damaging(0.996) | TCGA-E2-A1LE-01 | Breast | breast invasive carcinoma | Female | >=65 | III/IV | Chemotherapy | herceptin | PD |
| NPY1R | insertion | Nonsense_Mutation | novel | c.715_716insTTAATGTGTAGACAAATGT | p.Lys239IlefsTer4 | p.K239Ifs*4 | P25929 | protein_coding | TCGA-A8-A07L-01 | Breast | breast invasive carcinoma | Female | <65 | III/IV | Chemotherapy | CR | |||
| NPY1R | insertion | Nonsense_Mutation | novel | c.1026_1027insAACATGGTACCATGTAGTTCAGTATAGTAGTGTGCAAG | p.Arg343AsnfsTer9 | p.R343Nfs*9 | P25929 | protein_coding | TCGA-AO-A03T-01 | Breast | breast invasive carcinoma | Female | <65 | I/II | Chemotherapy | cyclophosphamide | SD | ||
| NPY1R | SNV | Missense_Mutation | rs753896952 | c.1027C>T | p.Arg343Trp | p.R343W | P25929 | protein_coding | deleterious(0.02) | probably_damaging(0.922) | TCGA-DR-A0ZM-01 | Cervix | cervical & endocervical cancer | Female | <65 | III/IV | Unspecific | Cisplatin | SD |
| NPY1R | SNV | Missense_Mutation | rs867894537 | c.769N>A | p.Glu257Lys | p.E257K | P25929 | protein_coding | tolerated(0.29) | probably_damaging(0.993) | TCGA-IR-A3LA-01 | Cervix | cervical & endocervical cancer | Female | <65 | I/II | Chemotherapy | cisplatin | CR |
| NPY1R | SNV | Missense_Mutation | rs148479836 | c.437G>A | p.Arg146Gln | p.R146Q | P25929 | protein_coding | tolerated(0.1) | benign(0.26) | TCGA-MA-AA42-01 | Cervix | cervical & endocervical cancer | Female | >=65 | I/II | Unknown | Unknown | SD |
| Page: 1 2 3 4 5 6 7 8 9 |
Top |
Related drugs of malignant transformation related genes |
| Identification of chemicals and drugs interact with genes involved in malignant transfromation |
| (DGIdb 4.0) |
| Entrez ID | Symbol | Category | Interaction Types | Drug Claim Name | Drug Name | PMIDs |
| 4886 | NPY1R | DRUGGABLE GENOME, G PROTEIN COUPLED RECEPTOR | DNDI1417776 | CHEMBL1585652 | ||
| 4886 | NPY1R | DRUGGABLE GENOME, G PROTEIN COUPLED RECEPTOR | agonist | 135651873 | ||
| 4886 | NPY1R | DRUGGABLE GENOME, G PROTEIN COUPLED RECEPTOR | agonist | 135651980 | ||
| 4886 | NPY1R | DRUGGABLE GENOME, G PROTEIN COUPLED RECEPTOR | N6-PHENYLADENOSINE | N6-PHENYLADENOSINE | ||
| 4886 | NPY1R | DRUGGABLE GENOME, G PROTEIN COUPLED RECEPTOR | agonist | 135652551 | ||
| 4886 | NPY1R | DRUGGABLE GENOME, G PROTEIN COUPLED RECEPTOR | METOPROLOL TARTRATE | |||
| 4886 | NPY1R | DRUGGABLE GENOME, G PROTEIN COUPLED RECEPTOR | antagonist | 135649991 | ||
| 4886 | NPY1R | DRUGGABLE GENOME, G PROTEIN COUPLED RECEPTOR | antagonist | 178100465 | ||
| 4886 | NPY1R | DRUGGABLE GENOME, G PROTEIN COUPLED RECEPTOR | antagonist | 135651070 | ||
| 4886 | NPY1R | DRUGGABLE GENOME, G PROTEIN COUPLED RECEPTOR | ECONAZOLE NITRATE | ECONAZOLE NITRATE |
| Page: 1 2 3 |

Copyright 2023-Present -The University of Texas Health Science Center at Houston |