
|
|||||
|
 | |
| |
| |
| |
| |
| |
|
Gene: NPTX2 |
Gene summary for NPTX2 |
| Gene information | Species | Human | Gene symbol | NPTX2 | Gene ID | 4885 |
| Gene name | neuronal pentraxin 2 | |
| Gene Alias | NARP | |
| Cytomap | 7q22.1 | |
| Gene Type | protein-coding | GO ID | GO:0003008 | UniProtAcc | P47972 |
Top |
Malignant transformation analysis |
| Identification of the aberrant gene expression in precancerous and cancerous lesions by comparing the gene expression of stem-like cells in diseased tissues with normal stem cells |
| Entrez ID | Symbol | Replicates | Species | Organ | Tissue | Adj P-value | Log2FC | Malignancy |
| 4885 | NPTX2 | P2T-E | Human | Esophagus | ESCC | 4.79e-93 | 2.49e+00 | 0.1177 |
| 4885 | NPTX2 | P5T-E | Human | Esophagus | ESCC | 1.78e-03 | 1.38e-01 | 0.1327 |
| 4885 | NPTX2 | P11T-E | Human | Esophagus | ESCC | 2.94e-14 | 5.83e-01 | 0.1426 |
| 4885 | NPTX2 | P16T-E | Human | Esophagus | ESCC | 4.26e-95 | 2.13e+00 | 0.1153 |
| 4885 | NPTX2 | P19T-E | Human | Esophagus | ESCC | 4.64e-06 | 6.95e-01 | 0.1662 |
| 4885 | NPTX2 | P22T-E | Human | Esophagus | ESCC | 3.97e-04 | 1.26e-01 | 0.1236 |
| 4885 | NPTX2 | P24T-E | Human | Esophagus | ESCC | 2.06e-08 | 2.49e-01 | 0.1287 |
| 4885 | NPTX2 | P27T-E | Human | Esophagus | ESCC | 9.56e-08 | 3.58e-01 | 0.1055 |
| 4885 | NPTX2 | P31T-E | Human | Esophagus | ESCC | 1.66e-02 | 1.28e-01 | 0.1251 |
| 4885 | NPTX2 | P36T-E | Human | Esophagus | ESCC | 2.82e-02 | 5.56e-01 | 0.1187 |
| 4885 | NPTX2 | P44T-E | Human | Esophagus | ESCC | 6.93e-04 | 1.71e-01 | 0.1096 |
| 4885 | NPTX2 | P56T-E | Human | Esophagus | ESCC | 1.11e-24 | 4.90e+00 | 0.1613 |
| 4885 | NPTX2 | P61T-E | Human | Esophagus | ESCC | 5.46e-11 | 2.79e-01 | 0.099 |
| 4885 | NPTX2 | P65T-E | Human | Esophagus | ESCC | 2.06e-03 | 1.68e-01 | 0.0978 |
| 4885 | NPTX2 | P107T-E | Human | Esophagus | ESCC | 5.65e-12 | 3.88e-01 | 0.171 |
| 4885 | NPTX2 | ATC13 | Human | Thyroid | ATC | 2.71e-09 | 1.71e-01 | 0.34 |
| 4885 | NPTX2 | ATC2 | Human | Thyroid | ATC | 3.34e-11 | 1.29e+00 | 0.34 |
| 4885 | NPTX2 | ATC5 | Human | Thyroid | ATC | 5.71e-10 | 2.01e-01 | 0.34 |
| Page: 1 |
| Tissue | Expression Dynamics | Abbreviation |
| Esophagus | 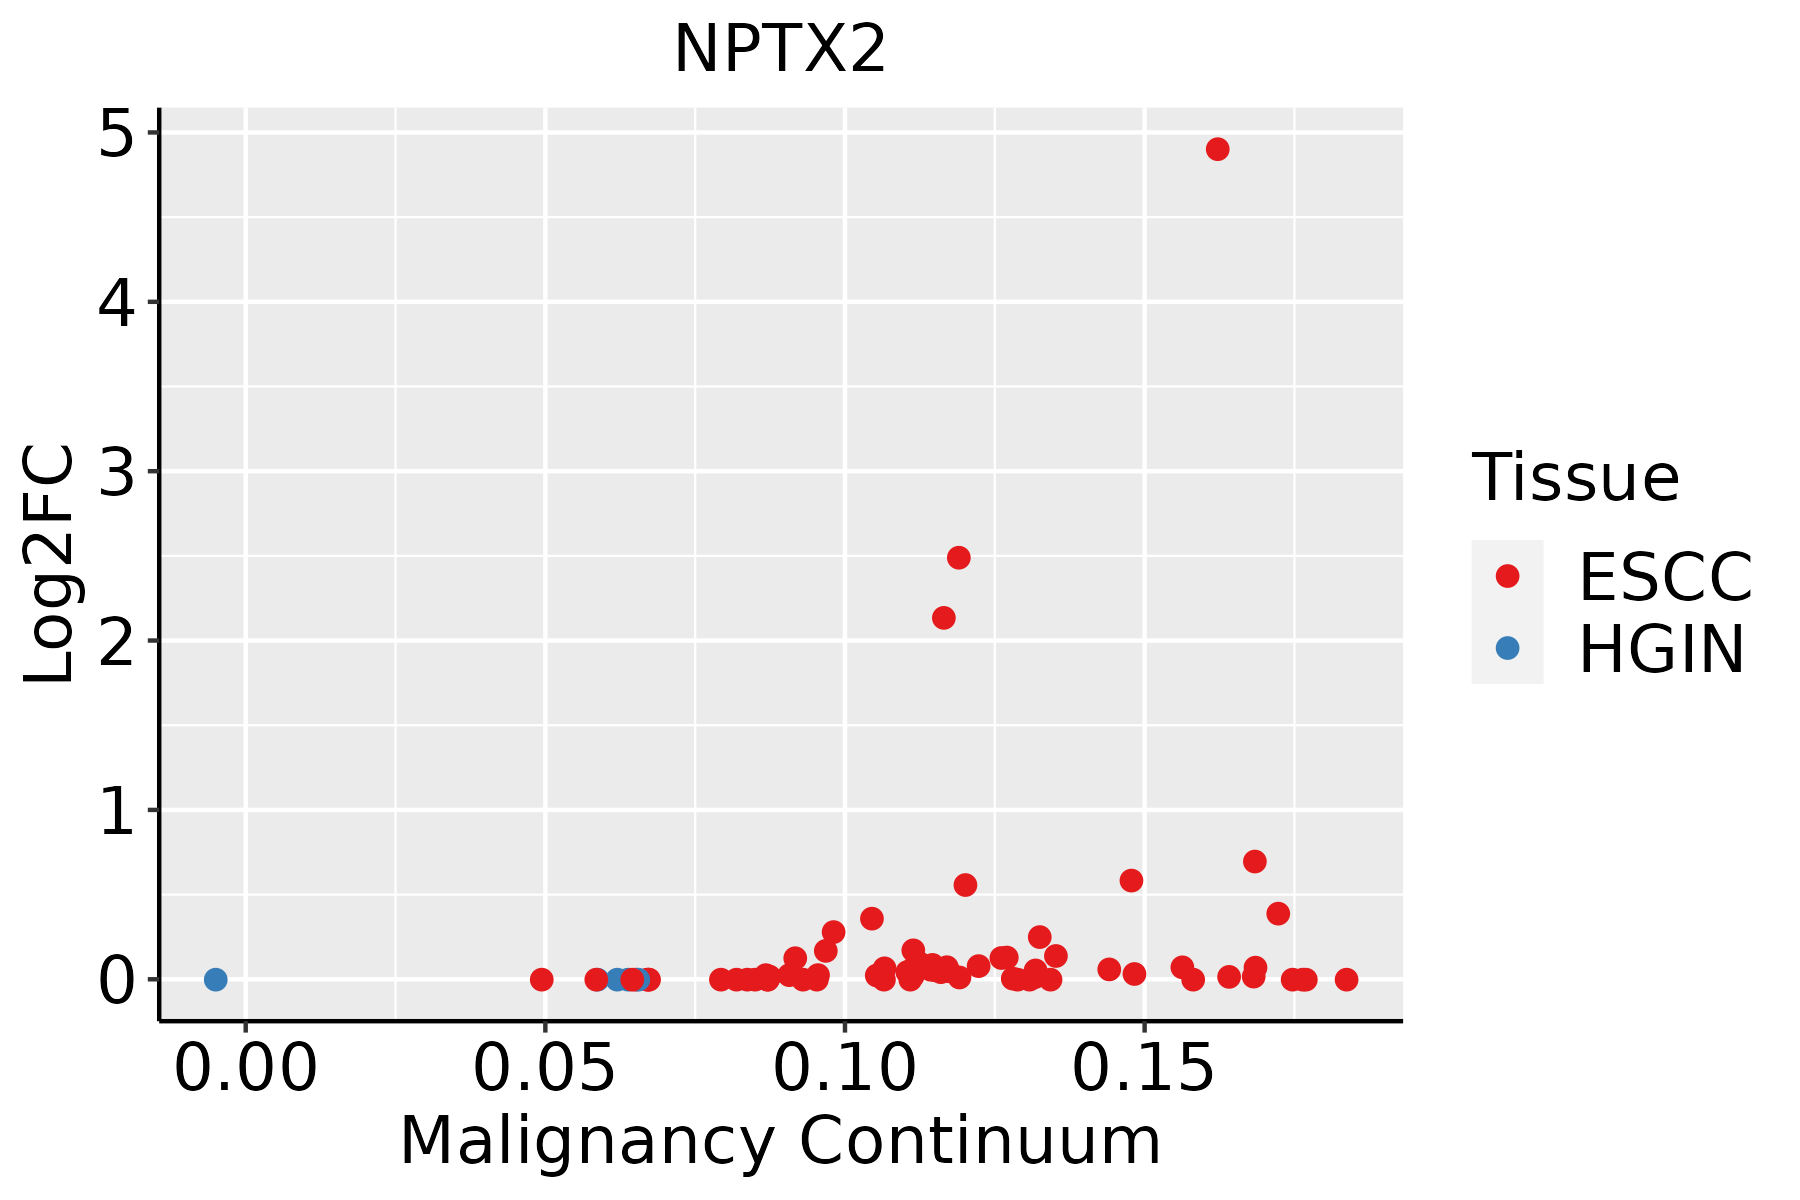 | ESCC: Esophageal squamous cell carcinoma |
| HGIN: High-grade intraepithelial neoplasias | ||
| LGIN: Low-grade intraepithelial neoplasias | ||
| Oral Cavity | 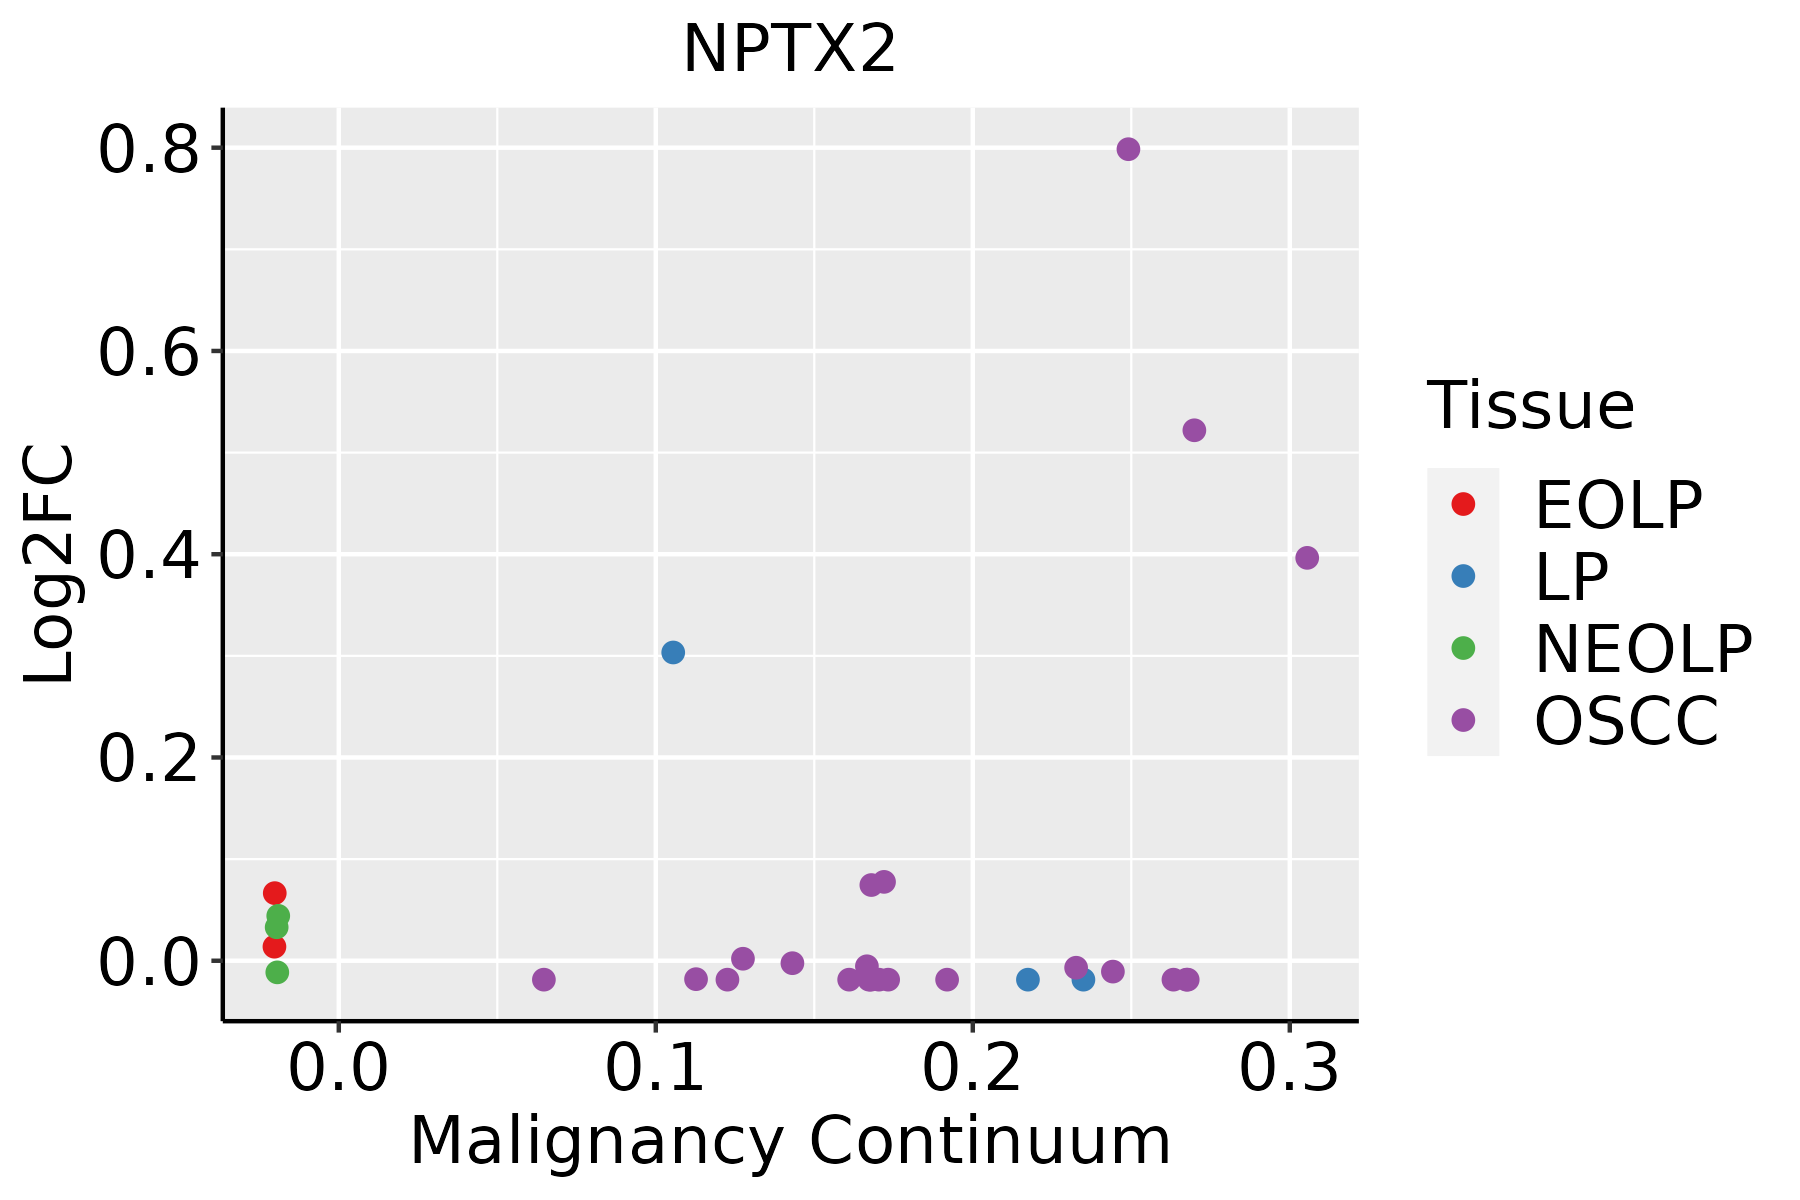 | EOLP: Erosive Oral lichen planus |
| LP: leukoplakia | ||
| NEOLP: Non-erosive oral lichen planus | ||
| OSCC: Oral squamous cell carcinoma | ||
| Thyroid | 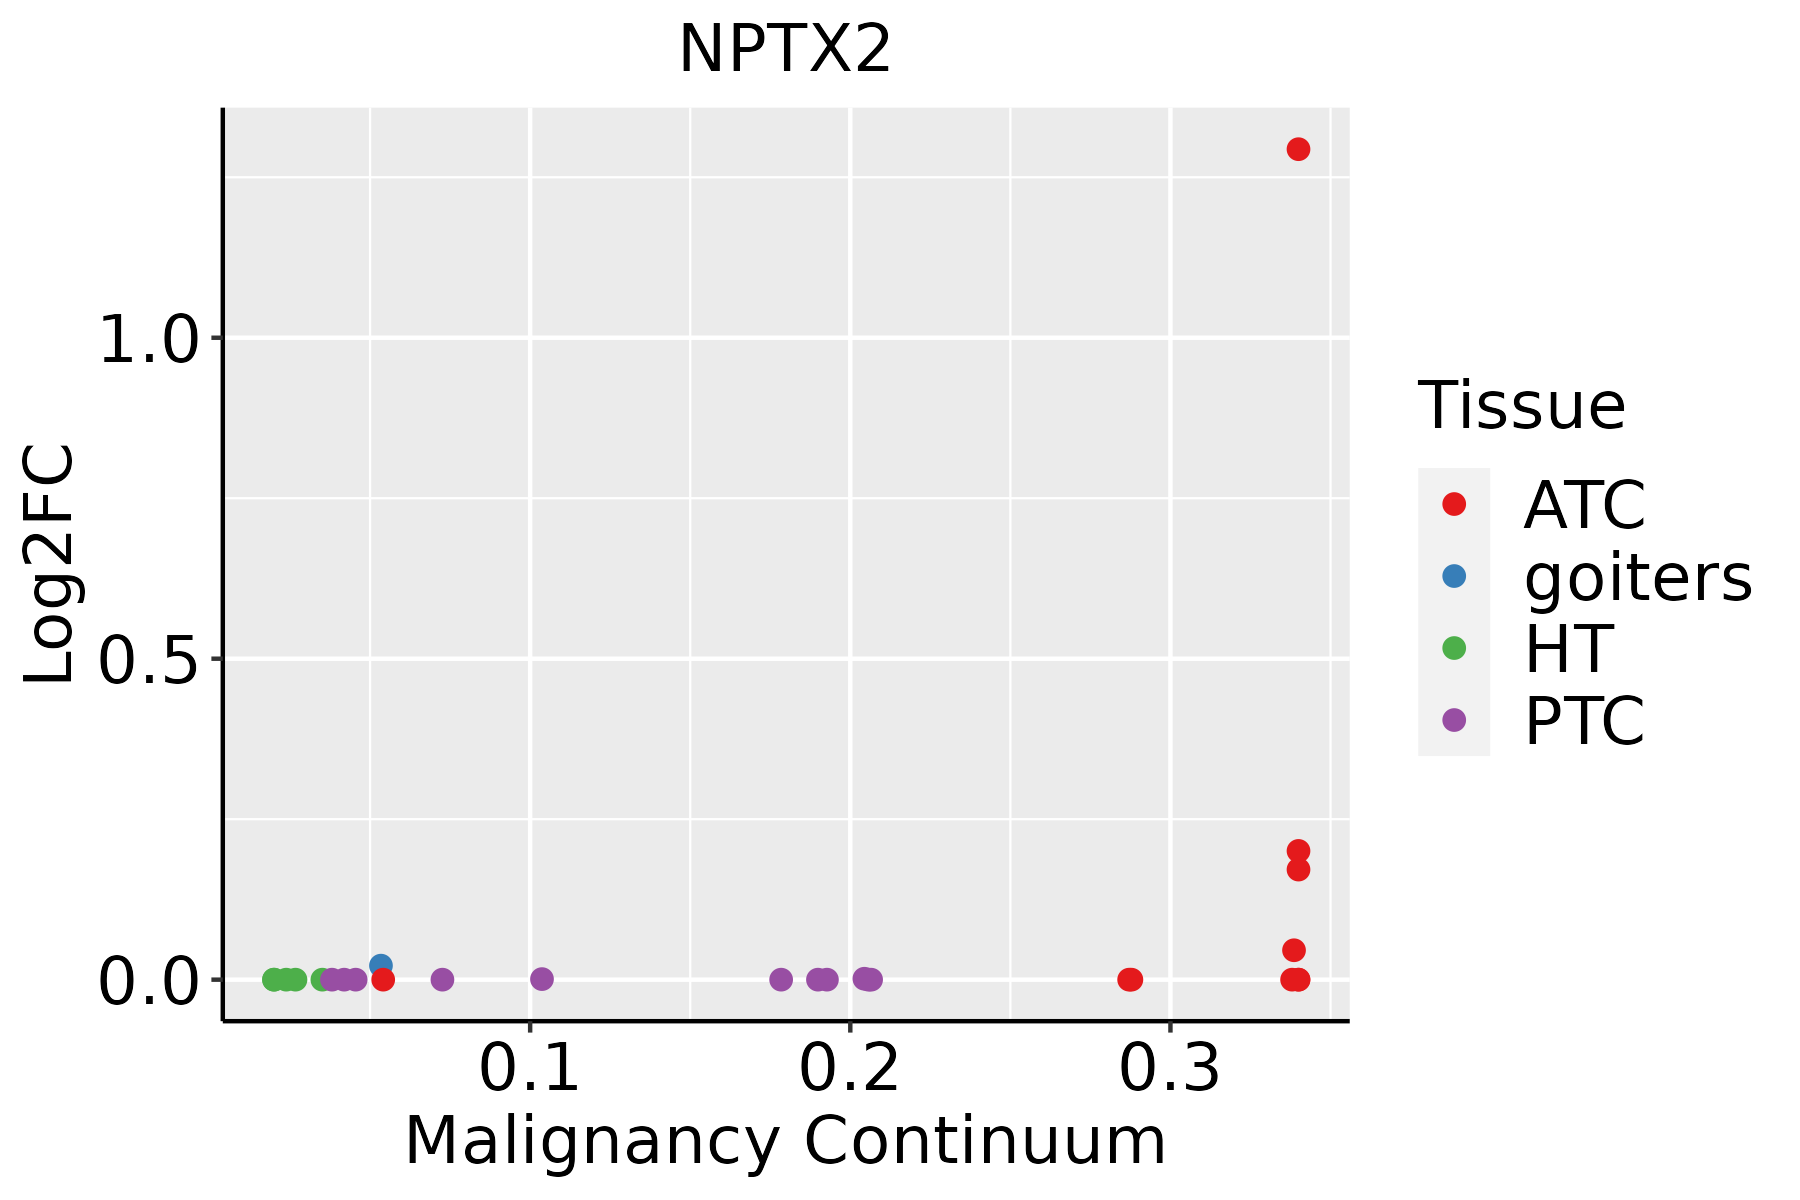 | ATC: Anaplastic thyroid cancer |
| HT: Hashimoto's thyroiditis | ||
| PTC: Papillary thyroid cancer |
| ∗log2FC in expression of this searched gene in stem-like cells from each diseased tissue sample relative to stem-like cells in normal samples in each tissue plotted against the malignancy continuum. Samples are colored based on if they are from different disease stage. |
Top |
Malignant transformation related pathway analysis |
| Find out the enriched GO biological processes and KEGG pathways involved in transition from healthy to precancer to cancer |
| Tissue | Disease Stage | Enriched GO biological Processes |
| Colorectum | AD |  |
| Colorectum | SER |  |
| Colorectum | MSS |  |
| Colorectum | MSI-H |  |
| Colorectum | FAP |  |
| ∗Top 15 enriched GO BP terms are showed in the bar plot of each disease state in each tissue. Each row represents a significant GO biological process which is colored according to the -log10(p.adjust). |
| Page: 1 2 3 4 5 6 7 8 9 |
| GO ID | Tissue | Disease Stage | Description | Gene Ratio | Bg Ratio | pvalue | p.adjust | Count |
| Page: 1 |
| Pathway ID | Tissue | Disease Stage | Description | Gene Ratio | Bg Ratio | pvalue | p.adjust | qvalue | Count |
| Page: 1 |
Top |
Cell-cell communication analysis |
| Identification of potential cell-cell interactions between two cell types and their ligand-receptor pairs for different disease states |
| Ligand | Receptor | LRpair | Pathway | Tissue | Disease Stage |
| Page: 1 |
Top |
Single-cell gene regulatory network inference analysis |
| Find out the significant the regulons (TFs) and the target genes of each regulon across cell types for different disease states |
| TF | Cell Type | Tissue | Disease Stage | Target Gene | RSS | Regulon Activity |
| ∗The dot plots of a searched regulon are shown for all cell subpopulations in each disease state of each tissue based on the regulon specific score inferred using pySCENIC and by calculating the average expression. |
| Page: 1 |
Top |
Somatic mutation of malignant transformation related genes |
| Annotation of somatic variants for genes involved in malignant transformation |
| Hugo Symbol | Variant Class | Variant Classification | dbSNP RS | HGVSc | HGVSp | HGVSp Short | SWISSPROT | BIOTYPE | SIFT | PolyPhen | Tumor Sample Barcode | Tissue | Histology | Sex | Age | Stage | Therapy Types | Drugs | Outcome |
| NPTX2 | SNV | Missense_Mutation | rs200042990 | c.838N>A | p.Val280Met | p.V280M | P47972 | protein_coding | deleterious(0) | probably_damaging(0.999) | TCGA-B6-A0RG-01 | Breast | breast invasive carcinoma | Female | <65 | I/II | Unknown | Unknown | SD |
| NPTX2 | insertion | In_Frame_Ins | novel | c.836_837insTTTCTCTTTATTAGACAATGATGCCTTCATTAAGGA | p.Ile279_Val280insPheSerLeuLeuAspAsnAspAlaPheIleLysAsp | p.I279_V280insFSLLDNDAFIKD | P47972 | protein_coding | TCGA-B6-A0RG-01 | Breast | breast invasive carcinoma | Female | <65 | I/II | Unknown | Unknown | SD | ||
| NPTX2 | SNV | Missense_Mutation | c.755T>C | p.Ile252Thr | p.I252T | P47972 | protein_coding | deleterious(0.02) | benign(0.419) | TCGA-2W-A8YY-01 | Cervix | cervical & endocervical cancer | Female | <65 | I/II | Chemotherapy | cisplatin | CR | |
| NPTX2 | SNV | Missense_Mutation | rs554934642 | c.1120N>G | p.Ser374Gly | p.S374G | P47972 | protein_coding | deleterious(0.01) | possibly_damaging(0.898) | TCGA-C5-A8YR-01 | Cervix | cervical & endocervical cancer | Female | <65 | I/II | Unknown | Unknown | PD |
| NPTX2 | SNV | Missense_Mutation | c.794G>A | p.Gly265Asp | p.G265D | P47972 | protein_coding | deleterious(0) | probably_damaging(1) | TCGA-AA-3977-01 | Colorectum | colon adenocarcinoma | Male | >=65 | I/II | Unknown | Unknown | SD | |
| NPTX2 | SNV | Missense_Mutation | novel | c.570N>T | p.Glu190Asp | p.E190D | P47972 | protein_coding | tolerated(0.45) | possibly_damaging(0.629) | TCGA-AA-A00N-01 | Colorectum | colon adenocarcinoma | Male | >=65 | I/II | Unknown | Unknown | PD |
| NPTX2 | SNV | Missense_Mutation | rs769298573 | c.1151N>A | p.Arg384His | p.R384H | P47972 | protein_coding | tolerated(0.06) | possibly_damaging(0.708) | TCGA-AA-A010-01 | Colorectum | colon adenocarcinoma | Female | <65 | I/II | Chemotherapy | folinic | CR |
| NPTX2 | SNV | Missense_Mutation | rs757073029 | c.893C>T | p.Ala298Val | p.A298V | P47972 | protein_coding | tolerated(0.1) | benign(0.295) | TCGA-AU-6004-01 | Colorectum | colon adenocarcinoma | Female | >=65 | I/II | Unknown | Unknown | SD |
| NPTX2 | SNV | Missense_Mutation | novel | c.990G>T | p.Glu330Asp | p.E330D | P47972 | protein_coding | tolerated(0.31) | benign(0.237) | TCGA-CA-6717-01 | Colorectum | colon adenocarcinoma | Male | <65 | I/II | Chemotherapy | oxaliplatin | CR |
| NPTX2 | SNV | Missense_Mutation | rs200320030 | c.1150C>T | p.Arg384Cys | p.R384C | P47972 | protein_coding | deleterious(0.01) | possibly_damaging(0.828) | TCGA-CK-5915-01 | Colorectum | colon adenocarcinoma | Male | <65 | I/II | Unknown | Unknown | SD |
| Page: 1 2 3 4 5 6 |
Top |
Related drugs of malignant transformation related genes |
| Identification of chemicals and drugs interact with genes involved in malignant transfromation |
| (DGIdb 4.0) |
| Entrez ID | Symbol | Category | Interaction Types | Drug Claim Name | Drug Name | PMIDs |
| 4885 | NPTX2 | DRUGGABLE GENOME | PRM-151 | PRM-151 |
| Page: 1 |

Copyright 2023-Present -The University of Texas Health Science Center at Houston |