
|
|||||
|
 | |
| |
| |
| |
| |
| |
|
Gene: NPTN |
Gene summary for NPTN |
| Gene information | Species | Human | Gene symbol | NPTN | Gene ID | 27020 |
| Gene name | neuroplastin | |
| Gene Alias | GP55 | |
| Cytomap | 15q24.1 | |
| Gene Type | protein-coding | GO ID | GO:0000165 | UniProtAcc | Q9Y639 |
Top |
Malignant transformation analysis |
| Identification of the aberrant gene expression in precancerous and cancerous lesions by comparing the gene expression of stem-like cells in diseased tissues with normal stem cells |
| Entrez ID | Symbol | Replicates | Species | Organ | Tissue | Adj P-value | Log2FC | Malignancy |
| 27020 | NPTN | LZE2D | Human | Esophagus | HGIN | 4.96e-03 | 5.27e-02 | 0.0642 |
| 27020 | NPTN | LZE4T | Human | Esophagus | ESCC | 5.95e-08 | 1.89e-01 | 0.0811 |
| 27020 | NPTN | LZE8T | Human | Esophagus | ESCC | 4.02e-02 | 1.16e-03 | 0.067 |
| 27020 | NPTN | LZE24T | Human | Esophagus | ESCC | 1.86e-09 | 3.38e-01 | 0.0596 |
| 27020 | NPTN | LZE21T | Human | Esophagus | ESCC | 8.76e-04 | -3.89e-03 | 0.0655 |
| 27020 | NPTN | P2T-E | Human | Esophagus | ESCC | 6.78e-18 | 2.04e-01 | 0.1177 |
| 27020 | NPTN | P4T-E | Human | Esophagus | ESCC | 1.78e-21 | 5.81e-01 | 0.1323 |
| 27020 | NPTN | P5T-E | Human | Esophagus | ESCC | 6.06e-19 | -7.36e-02 | 0.1327 |
| 27020 | NPTN | P8T-E | Human | Esophagus | ESCC | 1.61e-55 | 1.52e+00 | 0.0889 |
| 27020 | NPTN | P9T-E | Human | Esophagus | ESCC | 7.76e-08 | 2.72e-01 | 0.1131 |
| 27020 | NPTN | P10T-E | Human | Esophagus | ESCC | 4.18e-31 | 6.34e-01 | 0.116 |
| 27020 | NPTN | P11T-E | Human | Esophagus | ESCC | 2.18e-16 | 2.82e-01 | 0.1426 |
| 27020 | NPTN | P12T-E | Human | Esophagus | ESCC | 3.60e-23 | 4.26e-01 | 0.1122 |
| 27020 | NPTN | P15T-E | Human | Esophagus | ESCC | 1.38e-19 | 4.45e-01 | 0.1149 |
| 27020 | NPTN | P16T-E | Human | Esophagus | ESCC | 4.79e-14 | 1.12e-01 | 0.1153 |
| 27020 | NPTN | P19T-E | Human | Esophagus | ESCC | 3.28e-08 | 1.37e-01 | 0.1662 |
| 27020 | NPTN | P20T-E | Human | Esophagus | ESCC | 1.24e-11 | 2.07e-01 | 0.1124 |
| 27020 | NPTN | P21T-E | Human | Esophagus | ESCC | 7.58e-21 | 3.76e-01 | 0.1617 |
| 27020 | NPTN | P22T-E | Human | Esophagus | ESCC | 7.30e-15 | 1.88e-01 | 0.1236 |
| 27020 | NPTN | P23T-E | Human | Esophagus | ESCC | 6.98e-16 | 5.27e-01 | 0.108 |
| Page: 1 2 3 4 5 6 7 |
| Tissue | Expression Dynamics | Abbreviation |
| Esophagus | 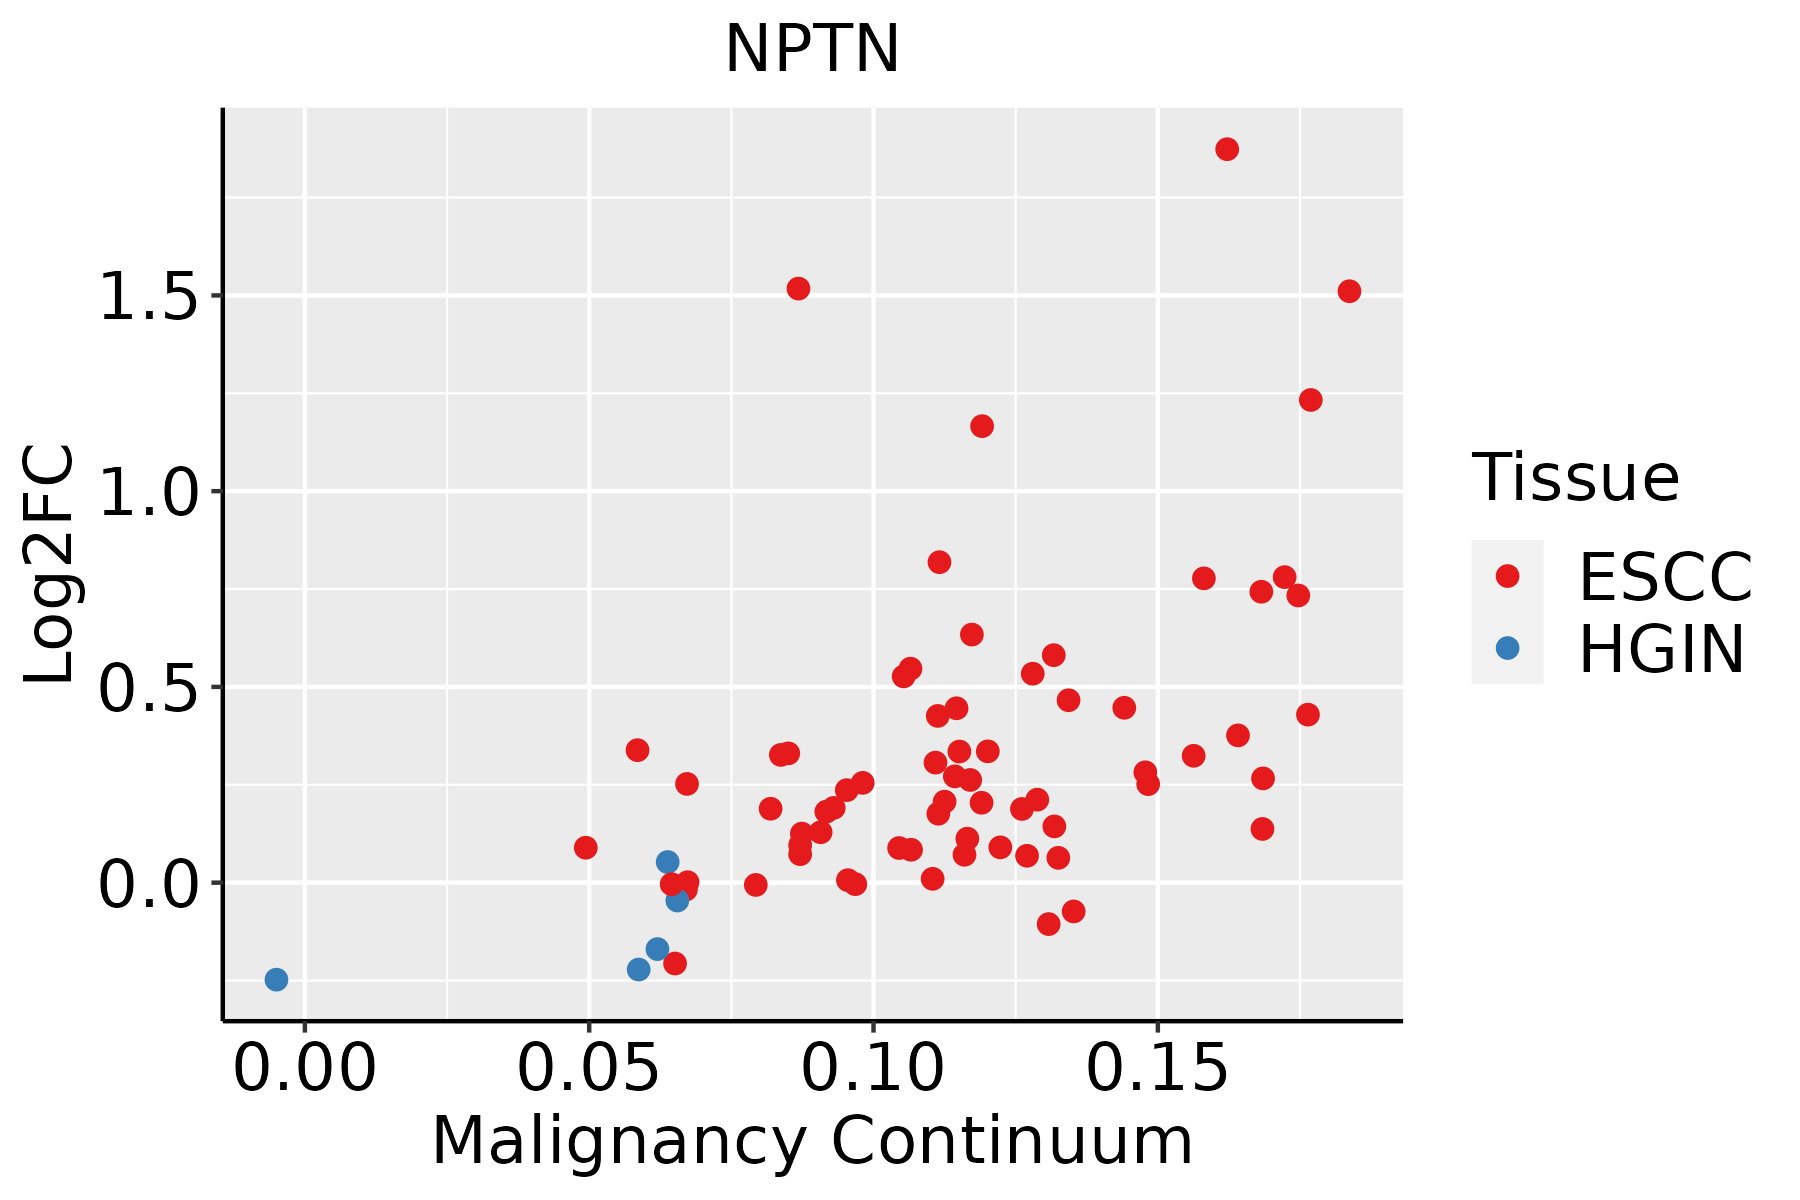 | ESCC: Esophageal squamous cell carcinoma |
| HGIN: High-grade intraepithelial neoplasias | ||
| LGIN: Low-grade intraepithelial neoplasias | ||
| Liver | 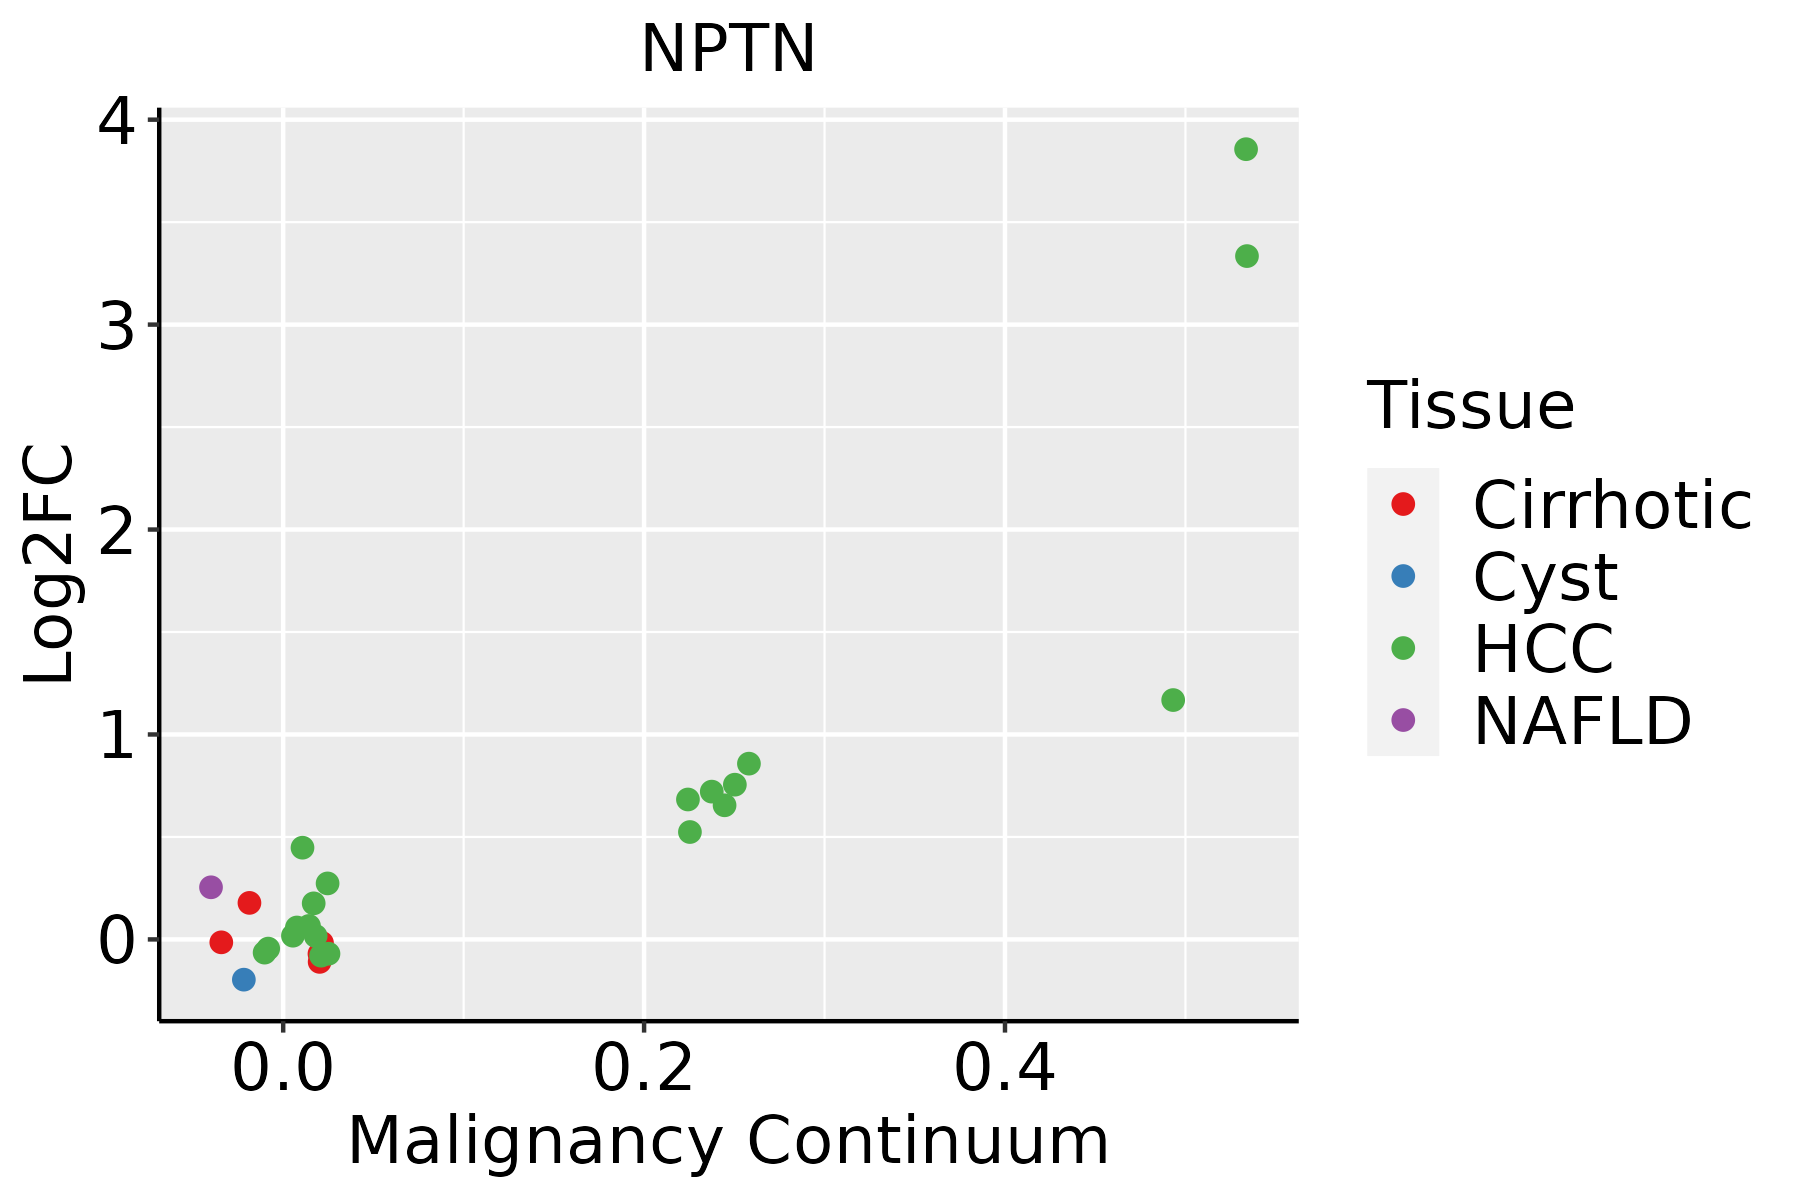 | HCC: Hepatocellular carcinoma |
| NAFLD: Non-alcoholic fatty liver disease | ||
| Oral Cavity |  | EOLP: Erosive Oral lichen planus |
| LP: leukoplakia | ||
| NEOLP: Non-erosive oral lichen planus | ||
| OSCC: Oral squamous cell carcinoma | ||
| Prostate |  | BPH: Benign Prostatic Hyperplasia |
| Skin | 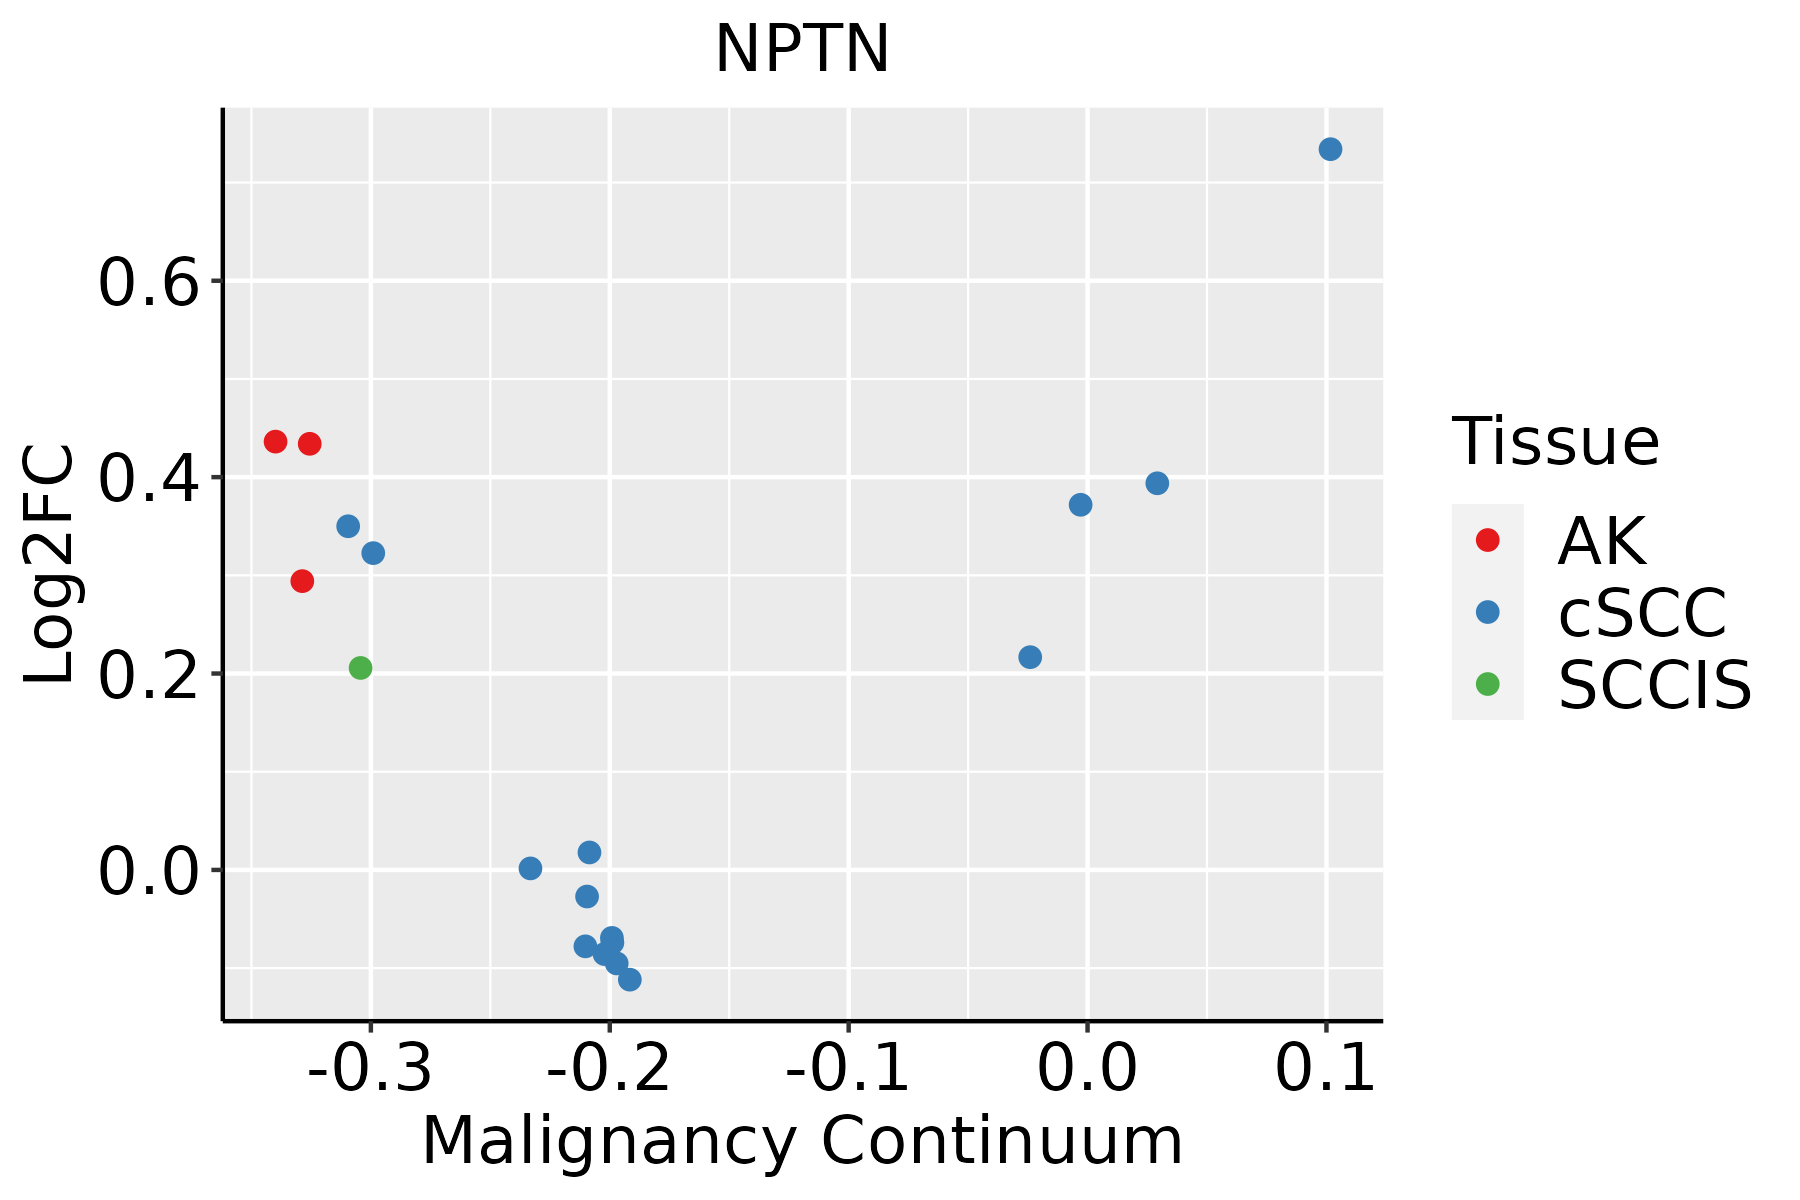 | AK: Actinic keratosis |
| cSCC: Cutaneous squamous cell carcinoma | ||
| SCCIS:squamous cell carcinoma in situ | ||
| Thyroid |  | ATC: Anaplastic thyroid cancer |
| HT: Hashimoto's thyroiditis | ||
| PTC: Papillary thyroid cancer |
| ∗log2FC in expression of this searched gene in stem-like cells from each diseased tissue sample relative to stem-like cells in normal samples in each tissue plotted against the malignancy continuum. Samples are colored based on if they are from different disease stage. |
Top |
Malignant transformation related pathway analysis |
| Find out the enriched GO biological processes and KEGG pathways involved in transition from healthy to precancer to cancer |
| Tissue | Disease Stage | Enriched GO biological Processes |
| Colorectum | AD |  |
| Colorectum | SER |  |
| Colorectum | MSS |  |
| Colorectum | MSI-H |  |
| Colorectum | FAP |  |
| ∗Top 15 enriched GO BP terms are showed in the bar plot of each disease state in each tissue. Each row represents a significant GO biological process which is colored according to the -log10(p.adjust). |
| Page: 1 2 3 4 5 6 7 8 9 |
| GO ID | Tissue | Disease Stage | Description | Gene Ratio | Bg Ratio | pvalue | p.adjust | Count |
| GO:190382926 | Esophagus | HGIN | positive regulation of cellular protein localization | 75/2587 | 276/18723 | 3.19e-09 | 2.30e-07 | 75 |
| GO:00315035 | Esophagus | HGIN | protein-containing complex localization | 50/2587 | 220/18723 | 2.18e-04 | 3.98e-03 | 50 |
| GO:000931418 | Esophagus | HGIN | response to radiation | 88/2587 | 456/18723 | 6.26e-04 | 8.65e-03 | 88 |
| GO:00094165 | Esophagus | HGIN | response to light stimulus | 61/2587 | 320/18723 | 5.20e-03 | 4.30e-02 | 61 |
| GO:1903829111 | Esophagus | ESCC | positive regulation of cellular protein localization | 199/8552 | 276/18723 | 2.99e-19 | 3.45e-17 | 199 |
| GO:000931419 | Esophagus | ESCC | response to radiation | 277/8552 | 456/18723 | 4.42e-11 | 1.43e-09 | 277 |
| GO:003150314 | Esophagus | ESCC | protein-containing complex localization | 139/8552 | 220/18723 | 1.14e-07 | 1.85e-06 | 139 |
| GO:003134616 | Esophagus | ESCC | positive regulation of cell projection organization | 201/8552 | 353/18723 | 1.19e-05 | 1.11e-04 | 201 |
| GO:001072010 | Esophagus | ESCC | positive regulation of cell development | 172/8552 | 298/18723 | 1.74e-05 | 1.55e-04 | 172 |
| GO:000941611 | Esophagus | ESCC | response to light stimulus | 183/8552 | 320/18723 | 2.03e-05 | 1.76e-04 | 183 |
| GO:005076710 | Esophagus | ESCC | regulation of neurogenesis | 203/8552 | 364/18723 | 6.10e-05 | 4.68e-04 | 203 |
| GO:00507697 | Esophagus | ESCC | positive regulation of neurogenesis | 131/8552 | 225/18723 | 9.71e-05 | 6.90e-04 | 131 |
| GO:006156415 | Esophagus | ESCC | axon development | 251/8552 | 467/18723 | 2.41e-04 | 1.49e-03 | 251 |
| GO:001097516 | Esophagus | ESCC | regulation of neuron projection development | 240/8552 | 445/18723 | 2.48e-04 | 1.53e-03 | 240 |
| GO:003432918 | Esophagus | ESCC | cell junction assembly | 227/8552 | 420/18723 | 3.06e-04 | 1.83e-03 | 227 |
| GO:00519606 | Esophagus | ESCC | regulation of nervous system development | 237/8552 | 443/18723 | 5.02e-04 | 2.78e-03 | 237 |
| GO:00519625 | Esophagus | ESCC | positive regulation of nervous system development | 149/8552 | 272/18723 | 1.50e-03 | 7.06e-03 | 149 |
| GO:000740915 | Esophagus | ESCC | axonogenesis | 219/8552 | 418/18723 | 3.14e-03 | 1.31e-02 | 219 |
| GO:00109764 | Esophagus | ESCC | positive regulation of neuron projection development | 91/8552 | 163/18723 | 5.72e-03 | 2.13e-02 | 91 |
| GO:190382912 | Liver | Cirrhotic | positive regulation of cellular protein localization | 123/4634 | 276/18723 | 4.06e-13 | 3.22e-11 | 123 |
| Page: 1 2 3 4 5 6 7 8 9 10 |
| Pathway ID | Tissue | Disease Stage | Description | Gene Ratio | Bg Ratio | pvalue | p.adjust | qvalue | Count |
| Page: 1 |
Top |
Cell-cell communication analysis |
| Identification of potential cell-cell interactions between two cell types and their ligand-receptor pairs for different disease states |
| Ligand | Receptor | LRpair | Pathway | Tissue | Disease Stage |
| Page: 1 |
Top |
Single-cell gene regulatory network inference analysis |
| Find out the significant the regulons (TFs) and the target genes of each regulon across cell types for different disease states |
| TF | Cell Type | Tissue | Disease Stage | Target Gene | RSS | Regulon Activity |
| ∗The dot plots of a searched regulon are shown for all cell subpopulations in each disease state of each tissue based on the regulon specific score inferred using pySCENIC and by calculating the average expression. |
| Page: 1 |
Top |
Somatic mutation of malignant transformation related genes |
| Annotation of somatic variants for genes involved in malignant transformation |
| Hugo Symbol | Variant Class | Variant Classification | dbSNP RS | HGVSc | HGVSp | HGVSp Short | SWISSPROT | BIOTYPE | SIFT | PolyPhen | Tumor Sample Barcode | Tissue | Histology | Sex | Age | Stage | Therapy Types | Drugs | Outcome |
| NPTN | SNV | Missense_Mutation | c.712N>T | p.Pro238Ser | p.P238S | Q9Y639 | protein_coding | deleterious(0) | probably_damaging(0.997) | TCGA-A2-A04W-01 | Breast | breast invasive carcinoma | Female | <65 | I/II | Chemotherapy | cytoxan | SD | |
| NPTN | SNV | Missense_Mutation | novel | c.673N>A | p.Ala225Thr | p.A225T | Q9Y639 | protein_coding | tolerated(0.42) | possibly_damaging(0.537) | TCGA-2W-A8YY-01 | Cervix | cervical & endocervical cancer | Female | <65 | I/II | Chemotherapy | cisplatin | CR |
| NPTN | SNV | Missense_Mutation | c.118G>C | p.Glu40Gln | p.E40Q | Q9Y639 | protein_coding | tolerated(1) | probably_damaging(0.998) | TCGA-DS-A0VM-01 | Cervix | cervical & endocervical cancer | Female | <65 | I/II | Chemotherapy | cisplatin | PD | |
| NPTN | SNV | Missense_Mutation | novel | c.782N>T | p.Ser261Leu | p.S261L | Q9Y639 | protein_coding | deleterious(0) | probably_damaging(0.978) | TCGA-EA-A1QS-01 | Cervix | cervical & endocervical cancer | Female | <65 | I/II | Unknown | Unknown | SD |
| NPTN | SNV | Missense_Mutation | c.527N>A | p.Ser176Tyr | p.S176Y | Q9Y639 | protein_coding | tolerated(0.47) | benign(0.186) | TCGA-AA-A02H-01 | Colorectum | colon adenocarcinoma | Female | >=65 | III/IV | Unknown | Unknown | PD | |
| NPTN | SNV | Missense_Mutation | c.1025N>A | p.Pro342His | p.P342H | Q9Y639 | protein_coding | deleterious(0) | probably_damaging(0.999) | TCGA-AD-6889-01 | Colorectum | colon adenocarcinoma | Male | >=65 | I/II | Chemotherapy | xeloda | PD | |
| NPTN | SNV | Missense_Mutation | novel | c.193N>C | p.Trp65Arg | p.W65R | Q9Y639 | protein_coding | deleterious(0) | probably_damaging(0.999) | TCGA-AD-6889-01 | Colorectum | colon adenocarcinoma | Male | >=65 | I/II | Chemotherapy | xeloda | PD |
| NPTN | SNV | Missense_Mutation | c.418N>A | p.Ala140Thr | p.A140T | Q9Y639 | protein_coding | deleterious(0) | possibly_damaging(0.494) | TCGA-D5-6930-01 | Colorectum | colon adenocarcinoma | Male | >=65 | I/II | Unknown | Unknown | SD | |
| NPTN | SNV | Missense_Mutation | novel | c.1046A>C | p.Glu349Ala | p.E349A | Q9Y639 | protein_coding | deleterious(0) | probably_damaging(0.997) | TCGA-AG-3892-01 | Colorectum | rectum adenocarcinoma | Female | <65 | I/II | Unknown | Unknown | SD |
| NPTN | SNV | Missense_Mutation | c.527C>T | p.Ser176Phe | p.S176F | Q9Y639 | protein_coding | tolerated(0.27) | possibly_damaging(0.505) | TCGA-AG-A026-01 | Colorectum | rectum adenocarcinoma | Male | >=65 | I/II | Unknown | Unknown | PD |
| Page: 1 2 3 4 5 |
Top |
Related drugs of malignant transformation related genes |
| Identification of chemicals and drugs interact with genes involved in malignant transfromation |
| (DGIdb 4.0) |
| Entrez ID | Symbol | Category | Interaction Types | Drug Claim Name | Drug Name | PMIDs |
| 27020 | NPTN | CELL SURFACE, DRUGGABLE GENOME | ANTISERUM | 9004047 | ||
| 27020 | NPTN | CELL SURFACE, DRUGGABLE GENOME | GP100 | 8779689 |
| Page: 1 |

Copyright 2023-Present -The University of Texas Health Science Center at Houston |