
|
|||||
|
 | |
| |
| |
| |
| |
| |
|
Gene: NPRL2 |
Gene summary for NPRL2 |
| Gene information | Species | Human | Gene symbol | NPRL2 | Gene ID | 10641 |
| Gene name | NPR2 like, GATOR1 complex subunit | |
| Gene Alias | FFEVF2 | |
| Cytomap | 3p21.31 | |
| Gene Type | protein-coding | GO ID | GO:0000045 | UniProtAcc | Q8WTW4 |
Top |
Malignant transformation analysis |
| Identification of the aberrant gene expression in precancerous and cancerous lesions by comparing the gene expression of stem-like cells in diseased tissues with normal stem cells |
| Entrez ID | Symbol | Replicates | Species | Organ | Tissue | Adj P-value | Log2FC | Malignancy |
| 10641 | NPRL2 | LZE4T | Human | Esophagus | ESCC | 2.25e-05 | 1.56e-01 | 0.0811 |
| 10641 | NPRL2 | LZE24T | Human | Esophagus | ESCC | 3.06e-08 | 2.29e-01 | 0.0596 |
| 10641 | NPRL2 | P2T-E | Human | Esophagus | ESCC | 2.27e-13 | 1.71e-01 | 0.1177 |
| 10641 | NPRL2 | P4T-E | Human | Esophagus | ESCC | 4.39e-16 | 2.96e-01 | 0.1323 |
| 10641 | NPRL2 | P5T-E | Human | Esophagus | ESCC | 2.74e-10 | 3.08e-02 | 0.1327 |
| 10641 | NPRL2 | P8T-E | Human | Esophagus | ESCC | 9.42e-06 | 1.23e-01 | 0.0889 |
| 10641 | NPRL2 | P9T-E | Human | Esophagus | ESCC | 3.91e-07 | 1.39e-01 | 0.1131 |
| 10641 | NPRL2 | P10T-E | Human | Esophagus | ESCC | 1.13e-14 | 2.02e-01 | 0.116 |
| 10641 | NPRL2 | P11T-E | Human | Esophagus | ESCC | 8.84e-13 | 3.72e-01 | 0.1426 |
| 10641 | NPRL2 | P12T-E | Human | Esophagus | ESCC | 4.15e-16 | 2.64e-01 | 0.1122 |
| 10641 | NPRL2 | P15T-E | Human | Esophagus | ESCC | 9.86e-04 | 7.27e-02 | 0.1149 |
| 10641 | NPRL2 | P16T-E | Human | Esophagus | ESCC | 3.53e-08 | 2.01e-01 | 0.1153 |
| 10641 | NPRL2 | P19T-E | Human | Esophagus | ESCC | 8.31e-04 | 2.89e-01 | 0.1662 |
| 10641 | NPRL2 | P20T-E | Human | Esophagus | ESCC | 1.24e-12 | 2.40e-01 | 0.1124 |
| 10641 | NPRL2 | P21T-E | Human | Esophagus | ESCC | 3.06e-12 | 2.74e-01 | 0.1617 |
| 10641 | NPRL2 | P22T-E | Human | Esophagus | ESCC | 2.43e-17 | 2.31e-01 | 0.1236 |
| 10641 | NPRL2 | P23T-E | Human | Esophagus | ESCC | 1.87e-22 | 5.10e-01 | 0.108 |
| 10641 | NPRL2 | P24T-E | Human | Esophagus | ESCC | 1.15e-11 | 1.48e-01 | 0.1287 |
| 10641 | NPRL2 | P26T-E | Human | Esophagus | ESCC | 1.06e-16 | 3.39e-01 | 0.1276 |
| 10641 | NPRL2 | P27T-E | Human | Esophagus | ESCC | 9.16e-14 | 1.88e-01 | 0.1055 |
| Page: 1 2 3 4 |
| Tissue | Expression Dynamics | Abbreviation |
| Esophagus |  | ESCC: Esophageal squamous cell carcinoma |
| HGIN: High-grade intraepithelial neoplasias | ||
| LGIN: Low-grade intraepithelial neoplasias | ||
| Liver | 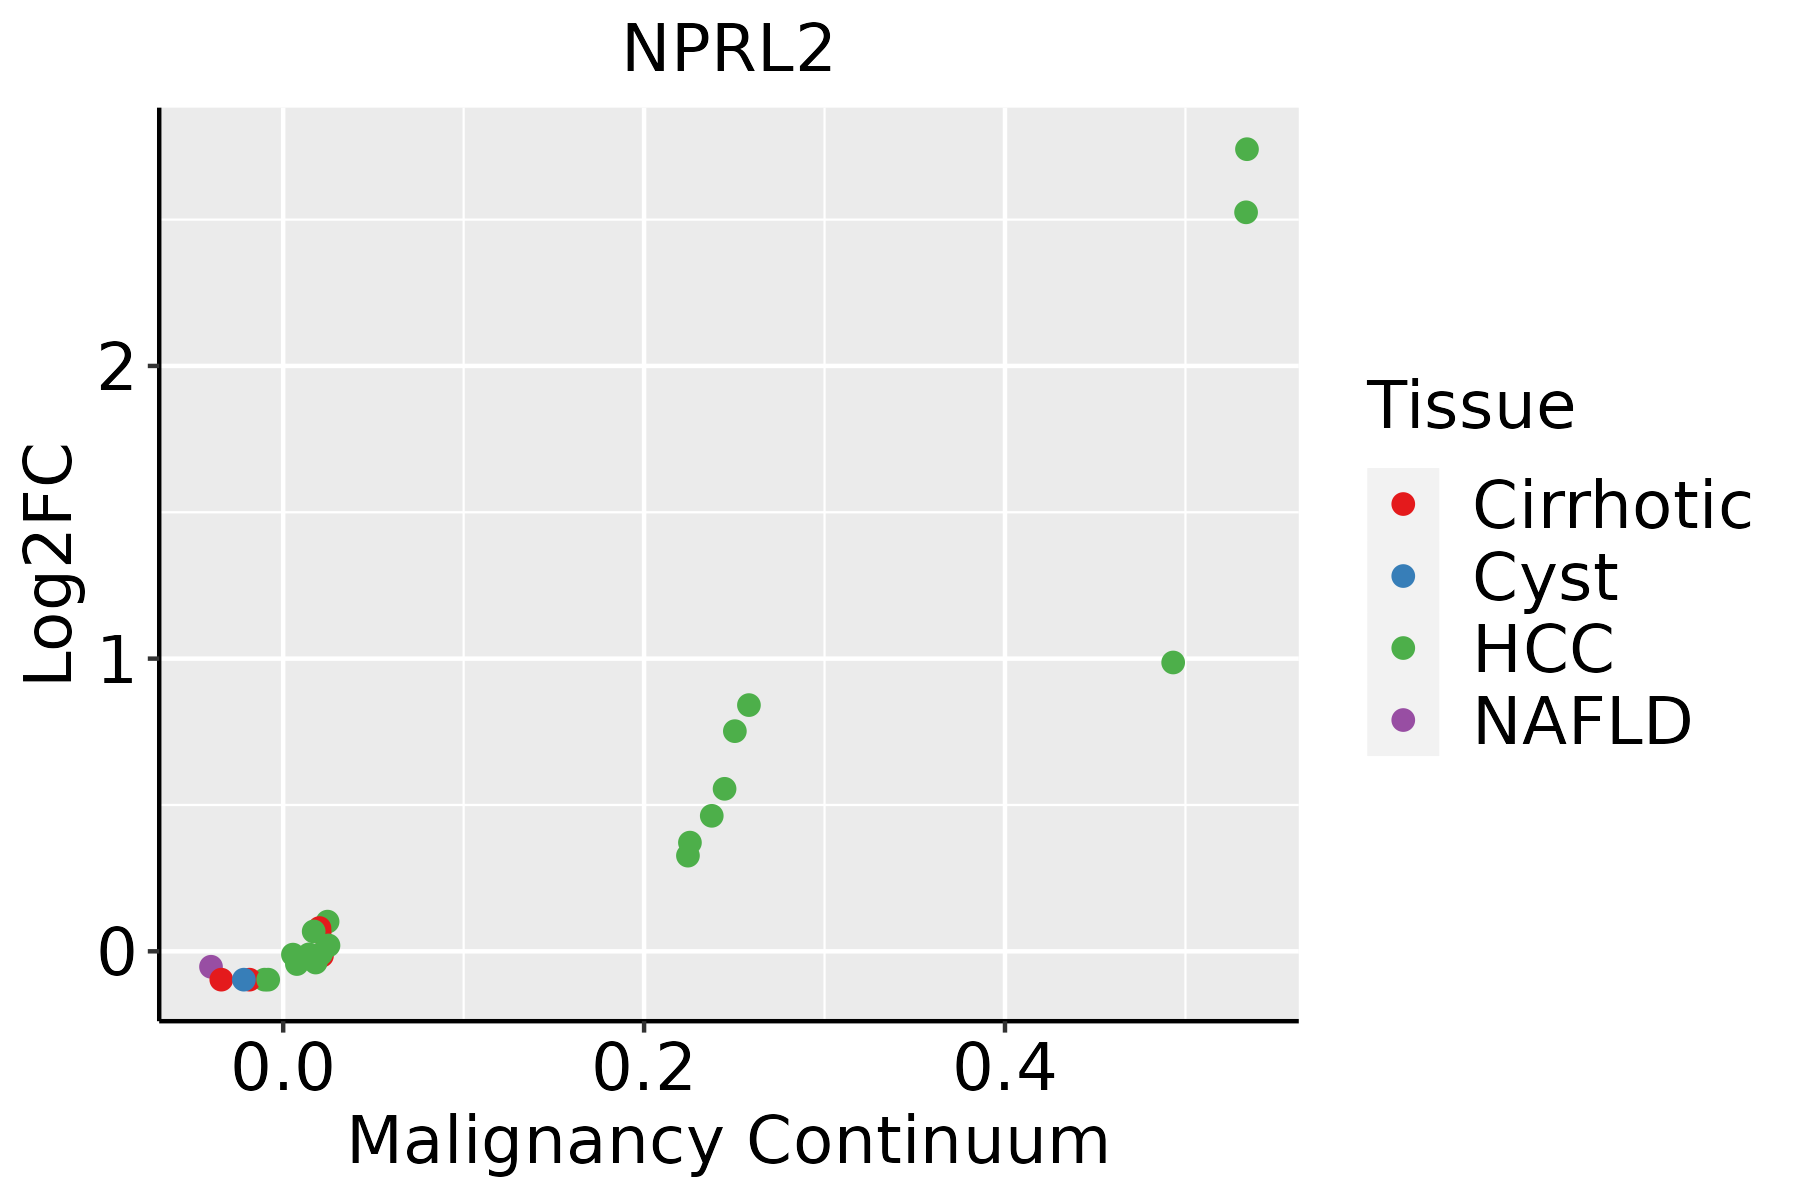 | HCC: Hepatocellular carcinoma |
| NAFLD: Non-alcoholic fatty liver disease |
| ∗log2FC in expression of this searched gene in stem-like cells from each diseased tissue sample relative to stem-like cells in normal samples in each tissue plotted against the malignancy continuum. Samples are colored based on if they are from different disease stage. |
Top |
Malignant transformation related pathway analysis |
| Find out the enriched GO biological processes and KEGG pathways involved in transition from healthy to precancer to cancer |
| Tissue | Disease Stage | Enriched GO biological Processes |
| Colorectum | AD |  |
| Colorectum | SER |  |
| Colorectum | MSS |  |
| Colorectum | MSI-H |  |
| Colorectum | FAP |  |
| ∗Top 15 enriched GO BP terms are showed in the bar plot of each disease state in each tissue. Each row represents a significant GO biological process which is colored according to the -log10(p.adjust). |
| Page: 1 2 3 4 5 6 7 8 9 |
| GO ID | Tissue | Disease Stage | Description | Gene Ratio | Bg Ratio | pvalue | p.adjust | Count |
| GO:001623617 | Esophagus | ESCC | macroautophagy | 216/8552 | 291/18723 | 1.94e-23 | 4.57e-21 | 216 |
| GO:0009896111 | Esophagus | ESCC | positive regulation of catabolic process | 332/8552 | 492/18723 | 4.36e-23 | 9.22e-21 | 332 |
| GO:0031331111 | Esophagus | ESCC | positive regulation of cellular catabolic process | 292/8552 | 427/18723 | 8.67e-22 | 1.53e-19 | 292 |
| GO:001050617 | Esophagus | ESCC | regulation of autophagy | 220/8552 | 317/18723 | 6.72e-18 | 6.36e-16 | 220 |
| GO:0071496111 | Esophagus | ESCC | cellular response to external stimulus | 215/8552 | 320/18723 | 4.29e-15 | 2.43e-13 | 215 |
| GO:0031668111 | Esophagus | ESCC | cellular response to extracellular stimulus | 168/8552 | 246/18723 | 4.93e-13 | 2.23e-11 | 168 |
| GO:0010563111 | Esophagus | ESCC | negative regulation of phosphorus metabolic process | 274/8552 | 442/18723 | 2.32e-12 | 9.41e-11 | 274 |
| GO:0045936111 | Esophagus | ESCC | negative regulation of phosphate metabolic process | 273/8552 | 441/18723 | 3.18e-12 | 1.25e-10 | 273 |
| GO:0031669110 | Esophagus | ESCC | cellular response to nutrient levels | 148/8552 | 215/18723 | 4.58e-12 | 1.76e-10 | 148 |
| GO:0031667111 | Esophagus | ESCC | response to nutrient levels | 289/8552 | 474/18723 | 9.25e-12 | 3.47e-10 | 289 |
| GO:000703314 | Esophagus | ESCC | vacuole organization | 127/8552 | 180/18723 | 1.04e-11 | 3.85e-10 | 127 |
| GO:0051348111 | Esophagus | ESCC | negative regulation of transferase activity | 177/8552 | 268/18723 | 1.08e-11 | 4.00e-10 | 177 |
| GO:0042326111 | Esophagus | ESCC | negative regulation of phosphorylation | 237/8552 | 385/18723 | 1.86e-10 | 5.33e-09 | 237 |
| GO:0009267110 | Esophagus | ESCC | cellular response to starvation | 110/8552 | 156/18723 | 2.63e-10 | 7.37e-09 | 110 |
| GO:004259419 | Esophagus | ESCC | response to starvation | 133/8552 | 197/18723 | 4.31e-10 | 1.14e-08 | 133 |
| GO:003367319 | Esophagus | ESCC | negative regulation of kinase activity | 154/8552 | 237/18723 | 1.38e-09 | 3.27e-08 | 154 |
| GO:190503712 | Esophagus | ESCC | autophagosome organization | 73/8552 | 103/18723 | 1.88e-07 | 2.93e-06 | 73 |
| GO:000004513 | Esophagus | ESCC | autophagosome assembly | 69/8552 | 99/18723 | 1.10e-06 | 1.38e-05 | 69 |
| GO:190211514 | Esophagus | ESCC | regulation of organelle assembly | 116/8552 | 186/18723 | 3.15e-06 | 3.53e-05 | 116 |
| GO:001050816 | Esophagus | ESCC | positive regulation of autophagy | 81/8552 | 124/18723 | 7.74e-06 | 7.65e-05 | 81 |
| Page: 1 2 3 4 |
| Pathway ID | Tissue | Disease Stage | Description | Gene Ratio | Bg Ratio | pvalue | p.adjust | qvalue | Count |
| hsa041505 | Esophagus | ESCC | mTOR signaling pathway | 98/4205 | 156/8465 | 5.81e-04 | 1.95e-03 | 9.97e-04 | 98 |
| hsa0415013 | Esophagus | ESCC | mTOR signaling pathway | 98/4205 | 156/8465 | 5.81e-04 | 1.95e-03 | 9.97e-04 | 98 |
| hsa041502 | Liver | HCC | mTOR signaling pathway | 95/4020 | 156/8465 | 4.70e-04 | 1.99e-03 | 1.11e-03 | 95 |
| hsa0415011 | Liver | HCC | mTOR signaling pathway | 95/4020 | 156/8465 | 4.70e-04 | 1.99e-03 | 1.11e-03 | 95 |
| Page: 1 |
Top |
Cell-cell communication analysis |
| Identification of potential cell-cell interactions between two cell types and their ligand-receptor pairs for different disease states |
| Ligand | Receptor | LRpair | Pathway | Tissue | Disease Stage |
| Page: 1 |
Top |
Single-cell gene regulatory network inference analysis |
| Find out the significant the regulons (TFs) and the target genes of each regulon across cell types for different disease states |
| TF | Cell Type | Tissue | Disease Stage | Target Gene | RSS | Regulon Activity |
| ∗The dot plots of a searched regulon are shown for all cell subpopulations in each disease state of each tissue based on the regulon specific score inferred using pySCENIC and by calculating the average expression. |
| Page: 1 |
Top |
Somatic mutation of malignant transformation related genes |
| Annotation of somatic variants for genes involved in malignant transformation |
| Hugo Symbol | Variant Class | Variant Classification | dbSNP RS | HGVSc | HGVSp | HGVSp Short | SWISSPROT | BIOTYPE | SIFT | PolyPhen | Tumor Sample Barcode | Tissue | Histology | Sex | Age | Stage | Therapy Types | Drugs | Outcome |
| NPRL2 | SNV | Missense_Mutation | rs149128231 | c.640N>C | p.Asp214His | p.D214H | Q8WTW4 | protein_coding | deleterious(0) | possibly_damaging(0.843) | TCGA-D8-A1J8-01 | Breast | breast invasive carcinoma | Female | >=65 | I/II | Hormone Therapy | nolvadex | SD |
| NPRL2 | insertion | Nonsense_Mutation | novel | c.1051_1052insGTTTCTGGGCCAGCCGTGGGAGACCCAGCAGTGAATGAA | p.Tyr351delinsCysPheTrpAlaSerArgGlyArgProSerSerGluTerAsn | p.Y351delinsCFWASRGRPSSE*N | Q8WTW4 | protein_coding | TCGA-AN-A0FX-01 | Breast | breast invasive carcinoma | Female | <65 | I/II | Unknown | Unknown | SD | ||
| NPRL2 | SNV | Missense_Mutation | novel | c.196N>A | p.Gly66Ser | p.G66S | Q8WTW4 | protein_coding | deleterious(0.01) | probably_damaging(0.964) | TCGA-EA-A410-01 | Cervix | cervical & endocervical cancer | Female | <65 | I/II | Unknown | Unknown | SD |
| NPRL2 | SNV | Missense_Mutation | novel | c.1054N>A | p.Asp352Asn | p.D352N | Q8WTW4 | protein_coding | deleterious(0) | possibly_damaging(0.873) | TCGA-MA-AA3Y-01 | Cervix | cervical & endocervical cancer | Female | <65 | I/II | Unknown | Unknown | SD |
| NPRL2 | SNV | Missense_Mutation | c.898N>T | p.Arg300Cys | p.R300C | Q8WTW4 | protein_coding | deleterious(0) | probably_damaging(0.987) | TCGA-WS-AB45-01 | Colorectum | colon adenocarcinoma | Female | <65 | I/II | Unknown | Unknown | SD | |
| NPRL2 | SNV | Missense_Mutation | novel | c.490N>T | p.Pro164Ser | p.P164S | Q8WTW4 | protein_coding | tolerated(0.78) | benign(0.053) | TCGA-A5-A0G2-01 | Endometrium | uterine corpus endometrioid carcinoma | Female | <65 | III/IV | Unknown | Unknown | SD |
| NPRL2 | SNV | Missense_Mutation | novel | c.257N>A | p.Gly86Asp | p.G86D | Q8WTW4 | protein_coding | deleterious(0.02) | probably_damaging(0.966) | TCGA-A5-A0G2-01 | Endometrium | uterine corpus endometrioid carcinoma | Female | <65 | III/IV | Unknown | Unknown | SD |
| NPRL2 | SNV | Missense_Mutation | novel | c.278N>T | p.Ala93Val | p.A93V | Q8WTW4 | protein_coding | tolerated(0.22) | benign(0.02) | TCGA-AJ-A3BH-01 | Endometrium | uterine corpus endometrioid carcinoma | Female | Unknown | I/II | Unknown | Unknown | SD |
| NPRL2 | SNV | Missense_Mutation | c.737N>A | p.Cys246Tyr | p.C246Y | Q8WTW4 | protein_coding | deleterious(0.02) | benign(0.189) | TCGA-AP-A051-01 | Endometrium | uterine corpus endometrioid carcinoma | Female | >=65 | I/II | Unknown | Unknown | SD | |
| NPRL2 | SNV | Missense_Mutation | novel | c.490N>T | p.Pro164Ser | p.P164S | Q8WTW4 | protein_coding | tolerated(0.78) | benign(0.053) | TCGA-AX-A1CE-01 | Endometrium | uterine corpus endometrioid carcinoma | Female | <65 | I/II | Unspecific | Paclitaxel | SD |
| Page: 1 2 3 4 |
Top |
Related drugs of malignant transformation related genes |
| Identification of chemicals and drugs interact with genes involved in malignant transfromation |
| (DGIdb 4.0) |
| Entrez ID | Symbol | Category | Interaction Types | Drug Claim Name | Drug Name | PMIDs |
| Page: 1 |

Copyright 2023-Present -The University of Texas Health Science Center at Houston |