
|
|||||
|
 | |
| |
| |
| |
| |
| |
|
Gene: NPR3 |
Gene summary for NPR3 |
| Gene information | Species | Human | Gene symbol | NPR3 | Gene ID | 4883 |
| Gene name | natriuretic peptide receptor 3 | |
| Gene Alias | ANP-C | |
| Cytomap | 5p13.3 | |
| Gene Type | protein-coding | GO ID | GO:0001501 | UniProtAcc | P17342 |
Top |
Malignant transformation analysis |
| Identification of the aberrant gene expression in precancerous and cancerous lesions by comparing the gene expression of stem-like cells in diseased tissues with normal stem cells |
| Entrez ID | Symbol | Replicates | Species | Organ | Tissue | Adj P-value | Log2FC | Malignancy |
| 4883 | NPR3 | P5T-E | Human | Esophagus | ESCC | 1.43e-08 | 2.58e-01 | 0.1327 |
| 4883 | NPR3 | P10T-E | Human | Esophagus | ESCC | 1.20e-02 | 1.77e-02 | 0.116 |
| 4883 | NPR3 | P12T-E | Human | Esophagus | ESCC | 1.80e-37 | 9.47e-01 | 0.1122 |
| 4883 | NPR3 | P23T-E | Human | Esophagus | ESCC | 5.75e-08 | 5.33e-01 | 0.108 |
| 4883 | NPR3 | P26T-E | Human | Esophagus | ESCC | 1.32e-07 | 2.27e-01 | 0.1276 |
| 4883 | NPR3 | P27T-E | Human | Esophagus | ESCC | 1.06e-10 | 3.03e-01 | 0.1055 |
| 4883 | NPR3 | P28T-E | Human | Esophagus | ESCC | 3.60e-13 | 2.87e-01 | 0.1149 |
| 4883 | NPR3 | P31T-E | Human | Esophagus | ESCC | 3.12e-09 | 3.20e-01 | 0.1251 |
| 4883 | NPR3 | P32T-E | Human | Esophagus | ESCC | 4.94e-03 | 1.74e-01 | 0.1666 |
| 4883 | NPR3 | P39T-E | Human | Esophagus | ESCC | 1.02e-10 | 2.16e-01 | 0.0894 |
| 4883 | NPR3 | P42T-E | Human | Esophagus | ESCC | 1.72e-07 | 4.62e-01 | 0.1175 |
| 4883 | NPR3 | P54T-E | Human | Esophagus | ESCC | 1.35e-06 | 1.81e-01 | 0.0975 |
| 4883 | NPR3 | P62T-E | Human | Esophagus | ESCC | 2.06e-05 | 2.56e-01 | 0.1302 |
| 4883 | NPR3 | P74T-E | Human | Esophagus | ESCC | 8.75e-03 | 6.22e-02 | 0.1479 |
| 4883 | NPR3 | P83T-E | Human | Esophagus | ESCC | 2.21e-27 | 8.39e-01 | 0.1738 |
| 4883 | NPR3 | P84T-E | Human | Esophagus | ESCC | 2.73e-04 | 5.67e-01 | 0.0933 |
| 4883 | NPR3 | P107T-E | Human | Esophagus | ESCC | 1.17e-07 | 3.67e-01 | 0.171 |
| 4883 | NPR3 | P128T-E | Human | Esophagus | ESCC | 5.86e-15 | 8.06e-01 | 0.1241 |
| 4883 | NPR3 | P130T-E | Human | Esophagus | ESCC | 1.04e-04 | 3.92e-01 | 0.1676 |
| Page: 1 |
| Tissue | Expression Dynamics | Abbreviation |
| Esophagus | 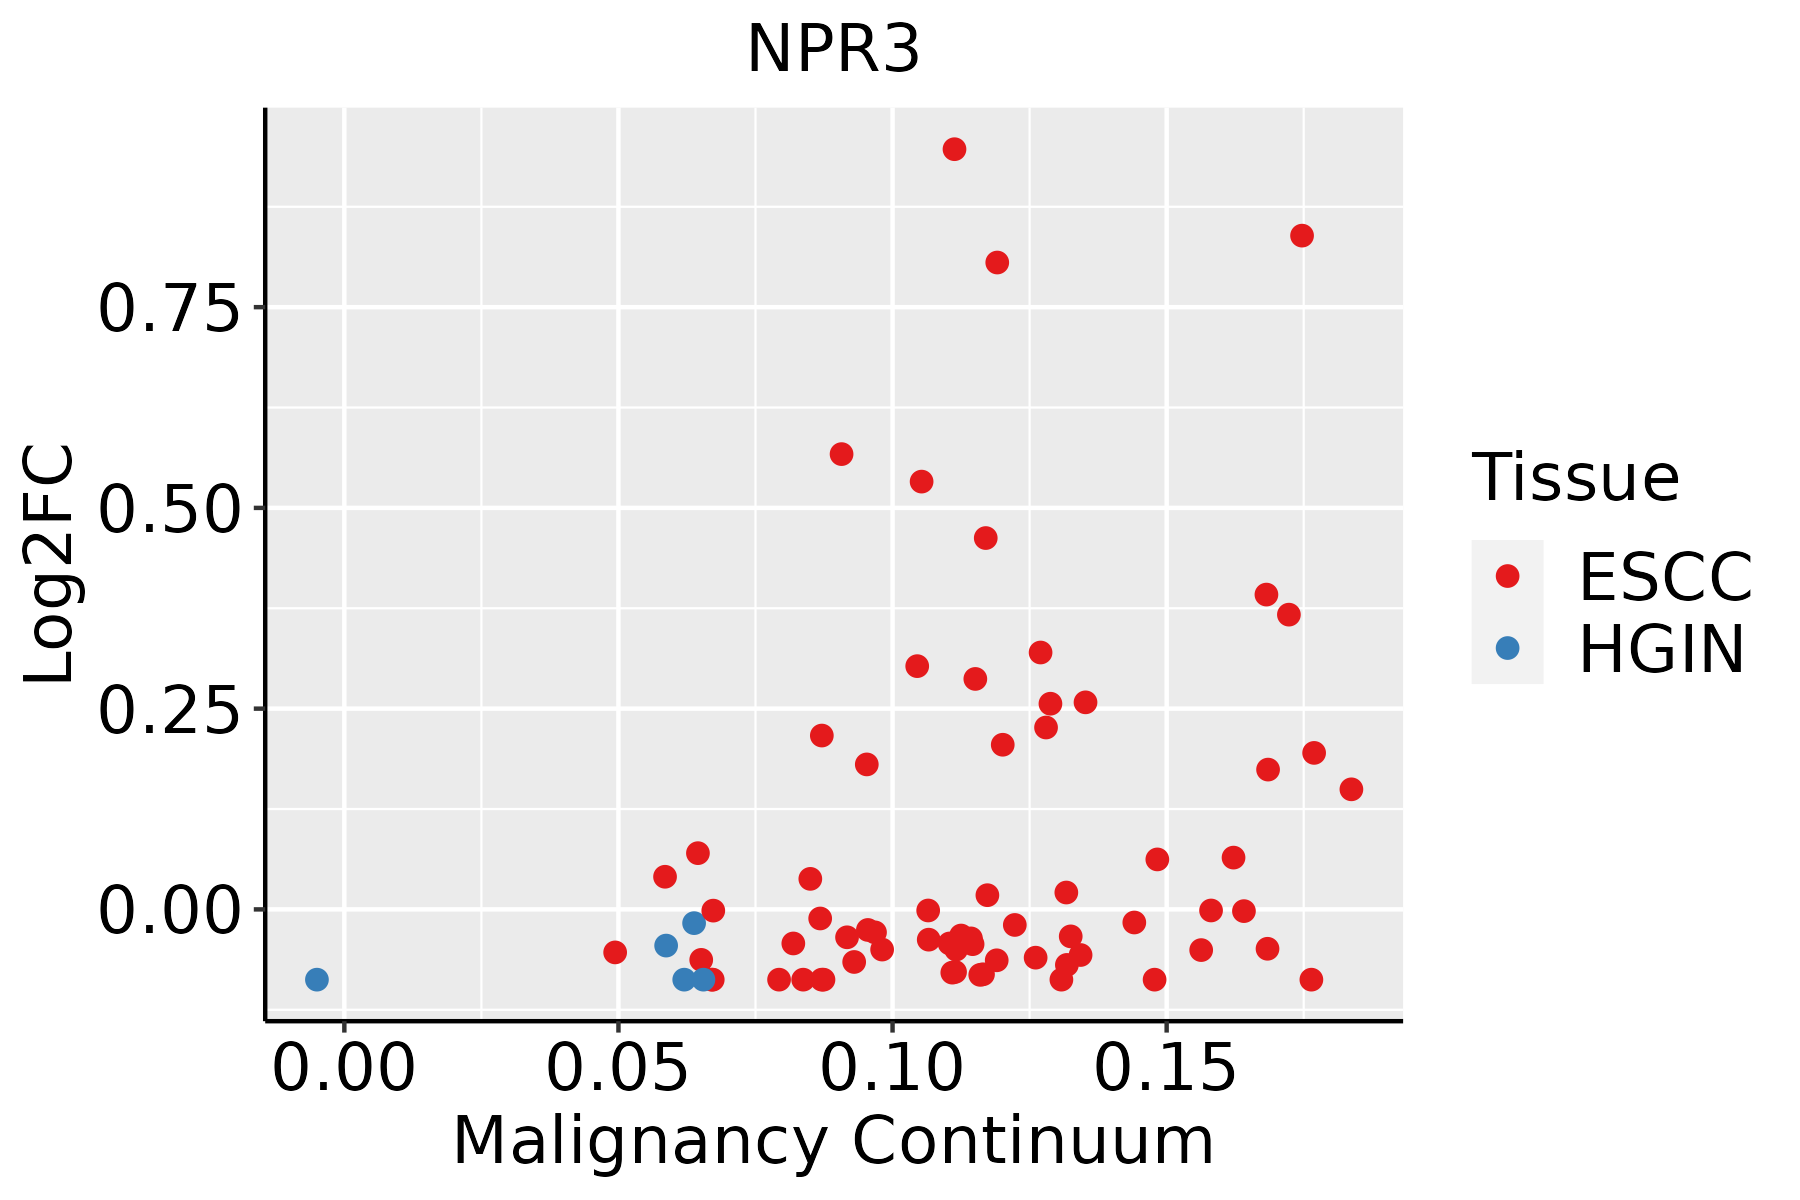 | ESCC: Esophageal squamous cell carcinoma |
| HGIN: High-grade intraepithelial neoplasias | ||
| LGIN: Low-grade intraepithelial neoplasias |
| ∗log2FC in expression of this searched gene in stem-like cells from each diseased tissue sample relative to stem-like cells in normal samples in each tissue plotted against the malignancy continuum. Samples are colored based on if they are from different disease stage. |
Top |
Malignant transformation related pathway analysis |
| Find out the enriched GO biological processes and KEGG pathways involved in transition from healthy to precancer to cancer |
| Tissue | Disease Stage | Enriched GO biological Processes |
| Colorectum | AD |  |
| Colorectum | SER |  |
| Colorectum | MSS |  |
| Colorectum | MSI-H |  |
| Colorectum | FAP |  |
| ∗Top 15 enriched GO BP terms are showed in the bar plot of each disease state in each tissue. Each row represents a significant GO biological process which is colored according to the -log10(p.adjust). |
| Page: 1 2 3 4 5 6 7 8 9 |
| GO ID | Tissue | Disease Stage | Description | Gene Ratio | Bg Ratio | pvalue | p.adjust | Count |
| GO:00486597 | Esophagus | ESCC | smooth muscle cell proliferation | 103/8552 | 184/18723 | 3.08e-03 | 1.28e-02 | 103 |
| GO:00486607 | Esophagus | ESCC | regulation of smooth muscle cell proliferation | 100/8552 | 180/18723 | 4.76e-03 | 1.85e-02 | 100 |
| GO:00330025 | Esophagus | ESCC | muscle cell proliferation | 134/8552 | 248/18723 | 4.80e-03 | 1.86e-02 | 134 |
| GO:00513534 | Esophagus | ESCC | positive regulation of oxidoreductase activity | 37/8552 | 59/18723 | 6.23e-03 | 2.29e-02 | 37 |
| GO:01061066 | Esophagus | ESCC | cold-induced thermogenesis | 80/8552 | 144/18723 | 1.07e-02 | 3.65e-02 | 80 |
| GO:01201616 | Esophagus | ESCC | regulation of cold-induced thermogenesis | 80/8552 | 144/18723 | 1.07e-02 | 3.65e-02 | 80 |
| Page: 1 |
| Pathway ID | Tissue | Disease Stage | Description | Gene Ratio | Bg Ratio | pvalue | p.adjust | qvalue | Count |
| Page: 1 |
Top |
Cell-cell communication analysis |
| Identification of potential cell-cell interactions between two cell types and their ligand-receptor pairs for different disease states |
| Ligand | Receptor | LRpair | Pathway | Tissue | Disease Stage |
| Page: 1 |
Top |
Single-cell gene regulatory network inference analysis |
| Find out the significant the regulons (TFs) and the target genes of each regulon across cell types for different disease states |
| TF | Cell Type | Tissue | Disease Stage | Target Gene | RSS | Regulon Activity |
| ∗The dot plots of a searched regulon are shown for all cell subpopulations in each disease state of each tissue based on the regulon specific score inferred using pySCENIC and by calculating the average expression. |
| Page: 1 |
Top |
Somatic mutation of malignant transformation related genes |
| Annotation of somatic variants for genes involved in malignant transformation |
| Hugo Symbol | Variant Class | Variant Classification | dbSNP RS | HGVSc | HGVSp | HGVSp Short | SWISSPROT | BIOTYPE | SIFT | PolyPhen | Tumor Sample Barcode | Tissue | Histology | Sex | Age | Stage | Therapy Types | Drugs | Outcome |
| NPR3 | SNV | Missense_Mutation | rs753725976 | c.741C>G | p.Ile247Met | p.I247M | P17342 | protein_coding | deleterious(0.01) | possibly_damaging(0.859) | TCGA-AN-A0FV-01 | Breast | breast invasive carcinoma | Female | <65 | I/II | Unknown | Unknown | SD |
| NPR3 | SNV | Missense_Mutation | rs780642601 | c.785N>T | p.Ala262Val | p.A262V | P17342 | protein_coding | deleterious(0.01) | possibly_damaging(0.868) | TCGA-AR-A1AR-01 | Breast | breast invasive carcinoma | Female | <65 | III/IV | Unspecific | Docetaxel | PD |
| NPR3 | SNV | Missense_Mutation | rs779442645 | c.802C>T | p.Arg268Trp | p.R268W | P17342 | protein_coding | deleterious(0) | probably_damaging(1) | TCGA-B6-A0RI-01 | Breast | breast invasive carcinoma | Female | <65 | III/IV | Unknown | Unknown | PD |
| NPR3 | SNV | Missense_Mutation | c.1589N>C | p.Arg530Pro | p.R530P | P17342 | protein_coding | deleterious(0) | probably_damaging(0.997) | TCGA-C8-A12V-01 | Breast | breast invasive carcinoma | Female | <65 | I/II | Unknown | Unknown | SD | |
| NPR3 | deletion | In_Frame_Del | c.1213_1215delNNN | p.Ser405del | p.S405del | P17342 | protein_coding | TCGA-A8-A09M-01 | Breast | breast invasive carcinoma | Female | >=65 | III/IV | Chemotherapy | paclitaxel | CR | |||
| NPR3 | SNV | Missense_Mutation | c.443N>T | p.Ser148Leu | p.S148L | P17342 | protein_coding | tolerated(0.08) | possibly_damaging(0.717) | TCGA-EK-A3GK-01 | Cervix | cervical & endocervical cancer | Female | <65 | I/II | Unknown | Unknown | SD | |
| NPR3 | SNV | Missense_Mutation | novel | c.1114N>G | p.Leu372Val | p.L372V | P17342 | protein_coding | deleterious(0.03) | probably_damaging(0.996) | TCGA-JW-A5VL-01 | Cervix | cervical & endocervical cancer | Female | <65 | I/II | Unknown | Unknown | SD |
| NPR3 | SNV | Missense_Mutation | c.616N>A | p.Asp206Asn | p.D206N | P17342 | protein_coding | tolerated(0.23) | probably_damaging(0.991) | TCGA-A6-2686-01 | Colorectum | colon adenocarcinoma | Female | >=65 | I/II | Unknown | Unknown | SD | |
| NPR3 | SNV | Missense_Mutation | novel | c.596G>A | p.Arg199His | p.R199H | P17342 | protein_coding | tolerated(0.11) | possibly_damaging(0.463) | TCGA-AA-3950-01 | Colorectum | colon adenocarcinoma | Female | >=65 | I/II | Unknown | Unknown | SD |
| NPR3 | SNV | Missense_Mutation | c.1541N>T | p.Arg514Met | p.R514M | P17342 | protein_coding | deleterious(0) | probably_damaging(0.996) | TCGA-AA-A010-01 | Colorectum | colon adenocarcinoma | Female | <65 | I/II | Chemotherapy | folinic | CR |
| Page: 1 2 3 4 5 6 7 8 |
Top |
Related drugs of malignant transformation related genes |
| Identification of chemicals and drugs interact with genes involved in malignant transfromation |
| (DGIdb 4.0) |
| Entrez ID | Symbol | Category | Interaction Types | Drug Claim Name | Drug Name | PMIDs |
| 4883 | NPR3 | DRUGGABLE GENOME | agonist | 178101592 | ||
| 4883 | NPR3 | DRUGGABLE GENOME | antagonist | 178101571 | ||
| 4883 | NPR3 | DRUGGABLE GENOME | antagonist | 178101717 | ||
| 4883 | NPR3 | DRUGGABLE GENOME | CARDIODILATIN | |||
| 4883 | NPR3 | DRUGGABLE GENOME | ANX-042 | 23694773 | ||
| 4883 | NPR3 | DRUGGABLE GENOME | antagonist | 178101732 | ||
| 4883 | NPR3 | DRUGGABLE GENOME | 178101546 | |||
| 4883 | NPR3 | DRUGGABLE GENOME | agonist | 315661152 | PL-3994 | |
| 4883 | NPR3 | DRUGGABLE GENOME | NESIRITIDE | NESIRITIDE | ||
| 4883 | NPR3 | DRUGGABLE GENOME | NESIRITIDE | NESIRITIDE |
| Page: 1 |

Copyright 2023-Present -The University of Texas Health Science Center at Houston |