
|
|||||
|
 | |
| |
| |
| |
| |
| |
|
Gene: NPNT |
Gene summary for NPNT |
| Gene information | Species | Human | Gene symbol | NPNT | Gene ID | 255743 |
| Gene name | nephronectin | |
| Gene Alias | EGFL6L | |
| Cytomap | 4q24 | |
| Gene Type | protein-coding | GO ID | GO:0000165 | UniProtAcc | Q6UXI9 |
Top |
Malignant transformation analysis |
| Identification of the aberrant gene expression in precancerous and cancerous lesions by comparing the gene expression of stem-like cells in diseased tissues with normal stem cells |
| Entrez ID | Symbol | Replicates | Species | Organ | Tissue | Adj P-value | Log2FC | Malignancy |
| 255743 | NPNT | HTA11_3410_2000001011 | Human | Colorectum | AD | 4.05e-09 | -5.02e-01 | 0.0155 |
| 255743 | NPNT | HTA11_347_2000001011 | Human | Colorectum | AD | 7.66e-03 | -3.81e-01 | -0.1954 |
| 255743 | NPNT | HTA11_3361_2000001011 | Human | Colorectum | AD | 2.00e-02 | -4.87e-01 | -0.1207 |
| 255743 | NPNT | HTA11_696_2000001011 | Human | Colorectum | AD | 2.24e-17 | -5.17e-01 | -0.1464 |
| 255743 | NPNT | HTA11_866_2000001011 | Human | Colorectum | AD | 1.74e-13 | -4.63e-01 | -0.1001 |
| 255743 | NPNT | HTA11_866_3004761011 | Human | Colorectum | AD | 1.16e-02 | -4.06e-01 | 0.096 |
| 255743 | NPNT | HTA11_10711_2000001011 | Human | Colorectum | AD | 1.32e-02 | -4.25e-01 | 0.0338 |
| 255743 | NPNT | HTA11_7696_3000711011 | Human | Colorectum | AD | 3.73e-14 | -4.60e-01 | 0.0674 |
| 255743 | NPNT | HTA11_99999971662_82457 | Human | Colorectum | MSS | 1.15e-14 | -4.83e-01 | 0.3859 |
| 255743 | NPNT | HTA11_99999973899_84307 | Human | Colorectum | MSS | 7.43e-06 | -6.23e-01 | 0.2585 |
| 255743 | NPNT | HTA11_99999974143_84620 | Human | Colorectum | MSS | 5.20e-22 | -5.60e-01 | 0.3005 |
| 255743 | NPNT | A002-C-010 | Human | Colorectum | FAP | 7.59e-04 | 3.09e-01 | 0.242 |
| 255743 | NPNT | A015-C-203 | Human | Colorectum | FAP | 2.55e-25 | -4.05e-01 | -0.1294 |
| 255743 | NPNT | A015-C-204 | Human | Colorectum | FAP | 5.86e-07 | -4.46e-01 | -0.0228 |
| 255743 | NPNT | A014-C-040 | Human | Colorectum | FAP | 5.05e-03 | -4.61e-01 | -0.1184 |
| 255743 | NPNT | A002-C-201 | Human | Colorectum | FAP | 1.29e-06 | -2.41e-01 | 0.0324 |
| 255743 | NPNT | A002-C-203 | Human | Colorectum | FAP | 4.25e-04 | 2.27e-01 | 0.2786 |
| 255743 | NPNT | A001-C-119 | Human | Colorectum | FAP | 5.43e-15 | -6.37e-01 | -0.1557 |
| 255743 | NPNT | A001-C-108 | Human | Colorectum | FAP | 4.35e-14 | -3.28e-01 | -0.0272 |
| 255743 | NPNT | A002-C-205 | Human | Colorectum | FAP | 2.59e-16 | -4.44e-01 | -0.1236 |
| Page: 1 2 3 4 5 6 |
| Tissue | Expression Dynamics | Abbreviation |
| Colorectum (GSE201348) |  | FAP: Familial adenomatous polyposis |
| CRC: Colorectal cancer | ||
| Colorectum (HTA11) |  | AD: Adenomas |
| SER: Sessile serrated lesions | ||
| MSI-H: Microsatellite-high colorectal cancer | ||
| MSS: Microsatellite stable colorectal cancer | ||
| Esophagus |  | ESCC: Esophageal squamous cell carcinoma |
| HGIN: High-grade intraepithelial neoplasias | ||
| LGIN: Low-grade intraepithelial neoplasias | ||
| Liver | 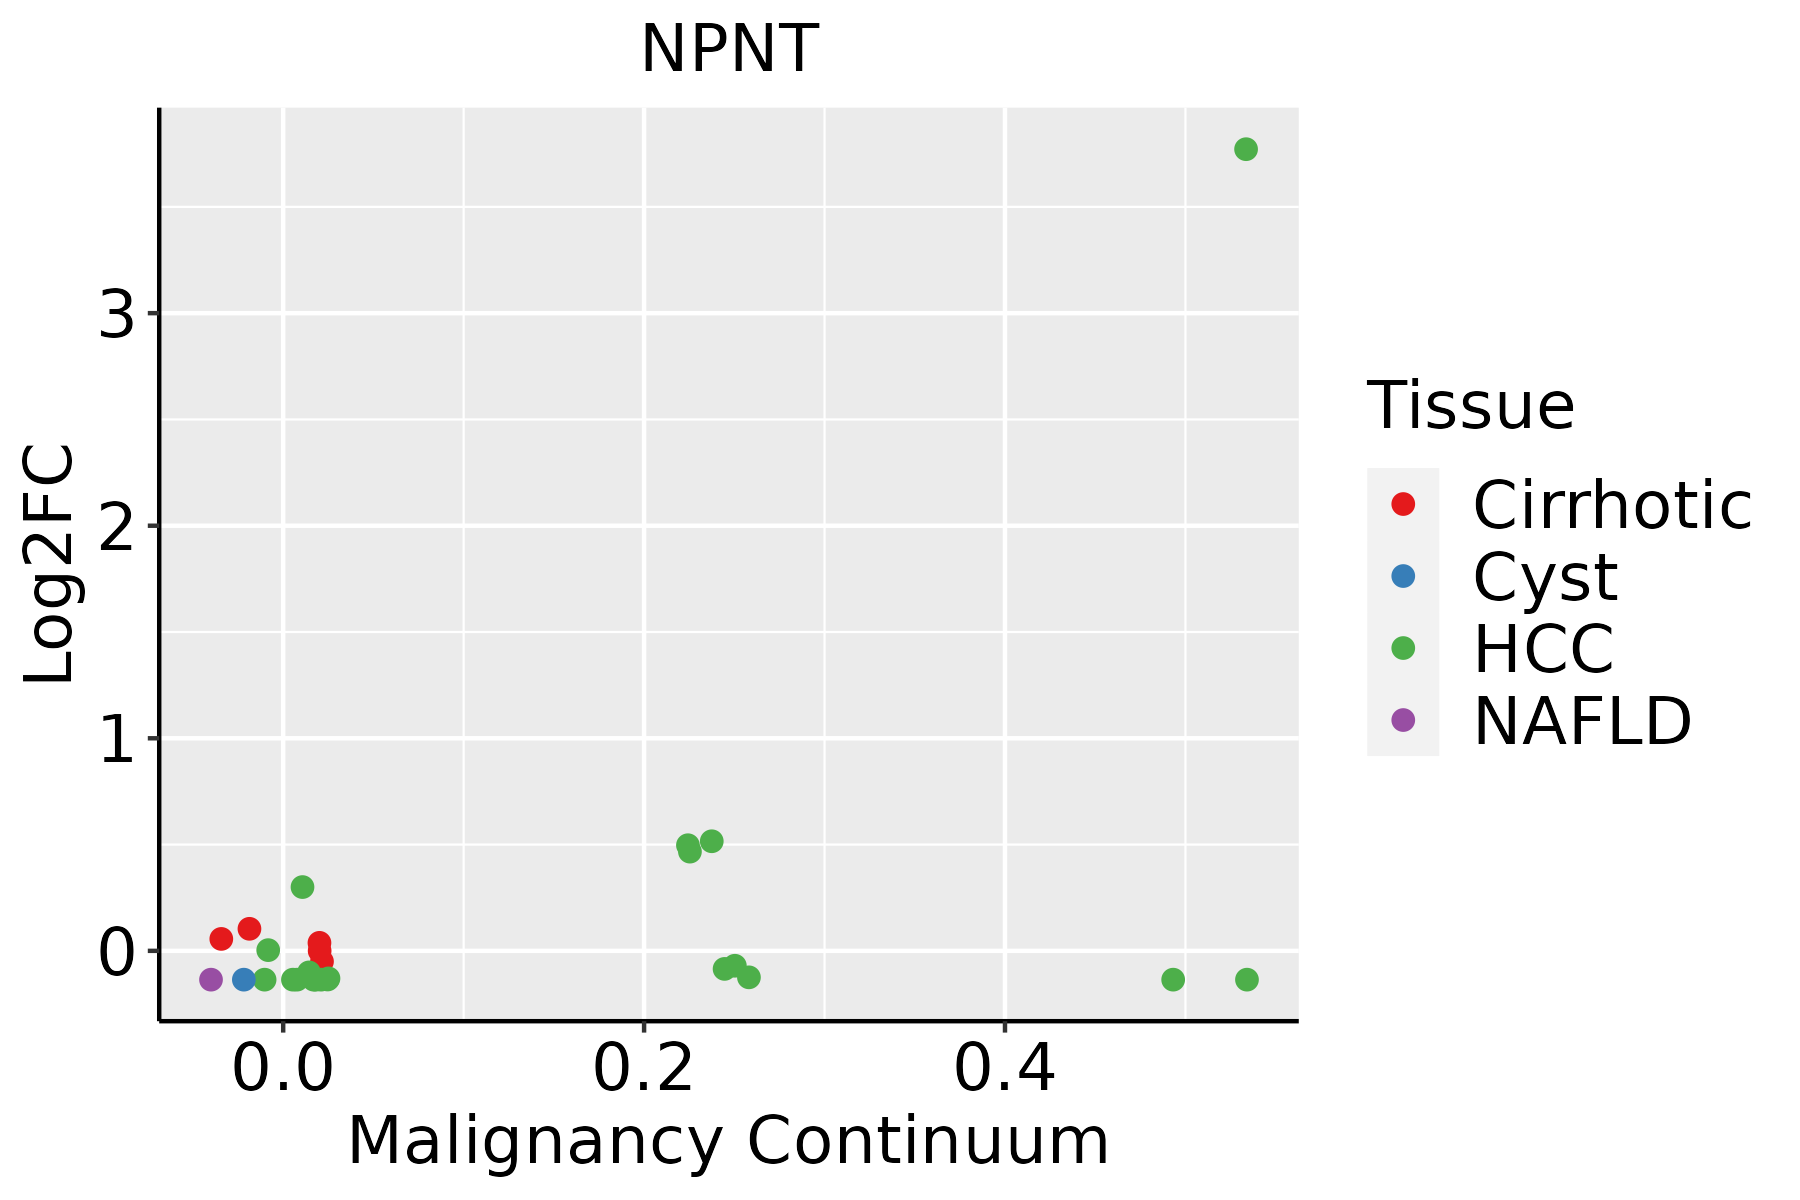 | HCC: Hepatocellular carcinoma |
| NAFLD: Non-alcoholic fatty liver disease | ||
| Lung |  | AAH: Atypical adenomatous hyperplasia |
| AIS: Adenocarcinoma in situ | ||
| IAC: Invasive lung adenocarcinoma | ||
| MIA: Minimally invasive adenocarcinoma | ||
| Oral Cavity | 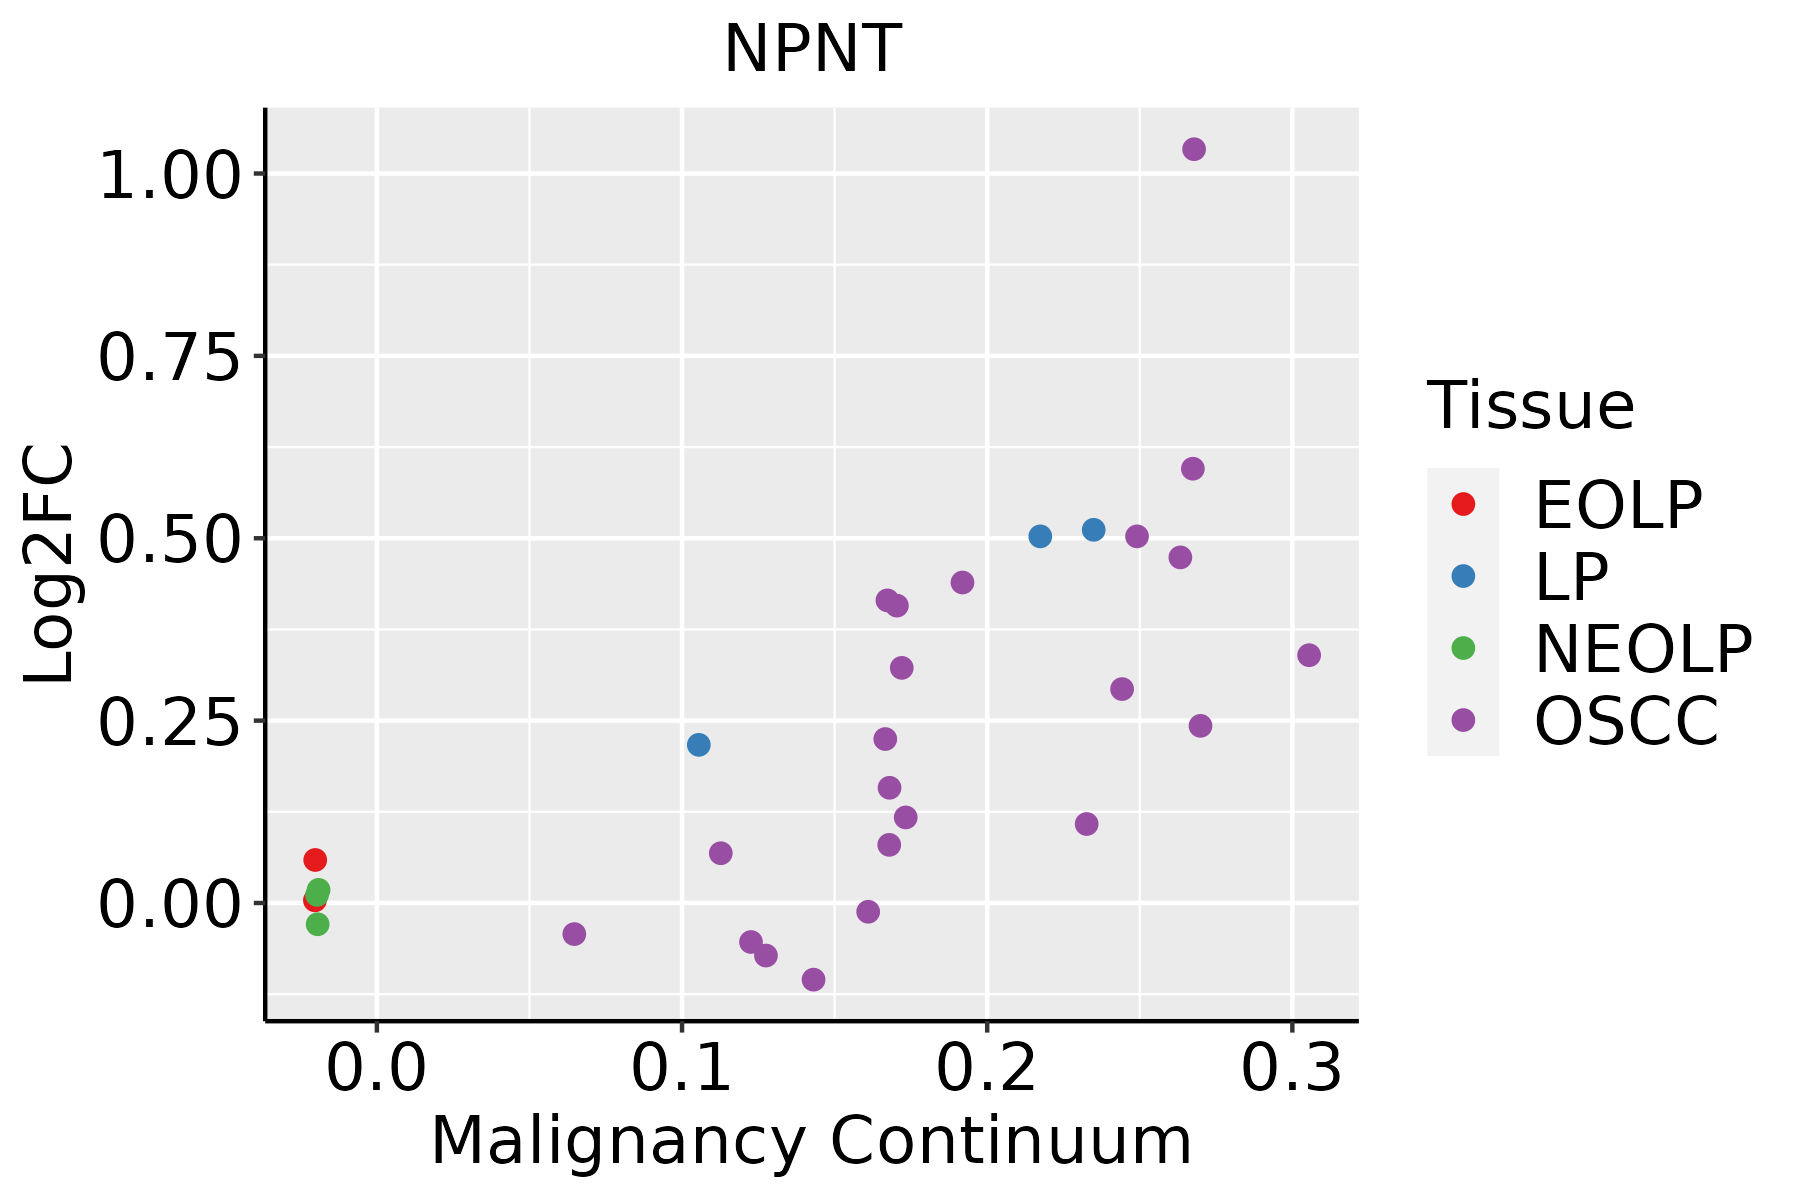 | EOLP: Erosive Oral lichen planus |
| LP: leukoplakia | ||
| NEOLP: Non-erosive oral lichen planus | ||
| OSCC: Oral squamous cell carcinoma | ||
| Prostate | 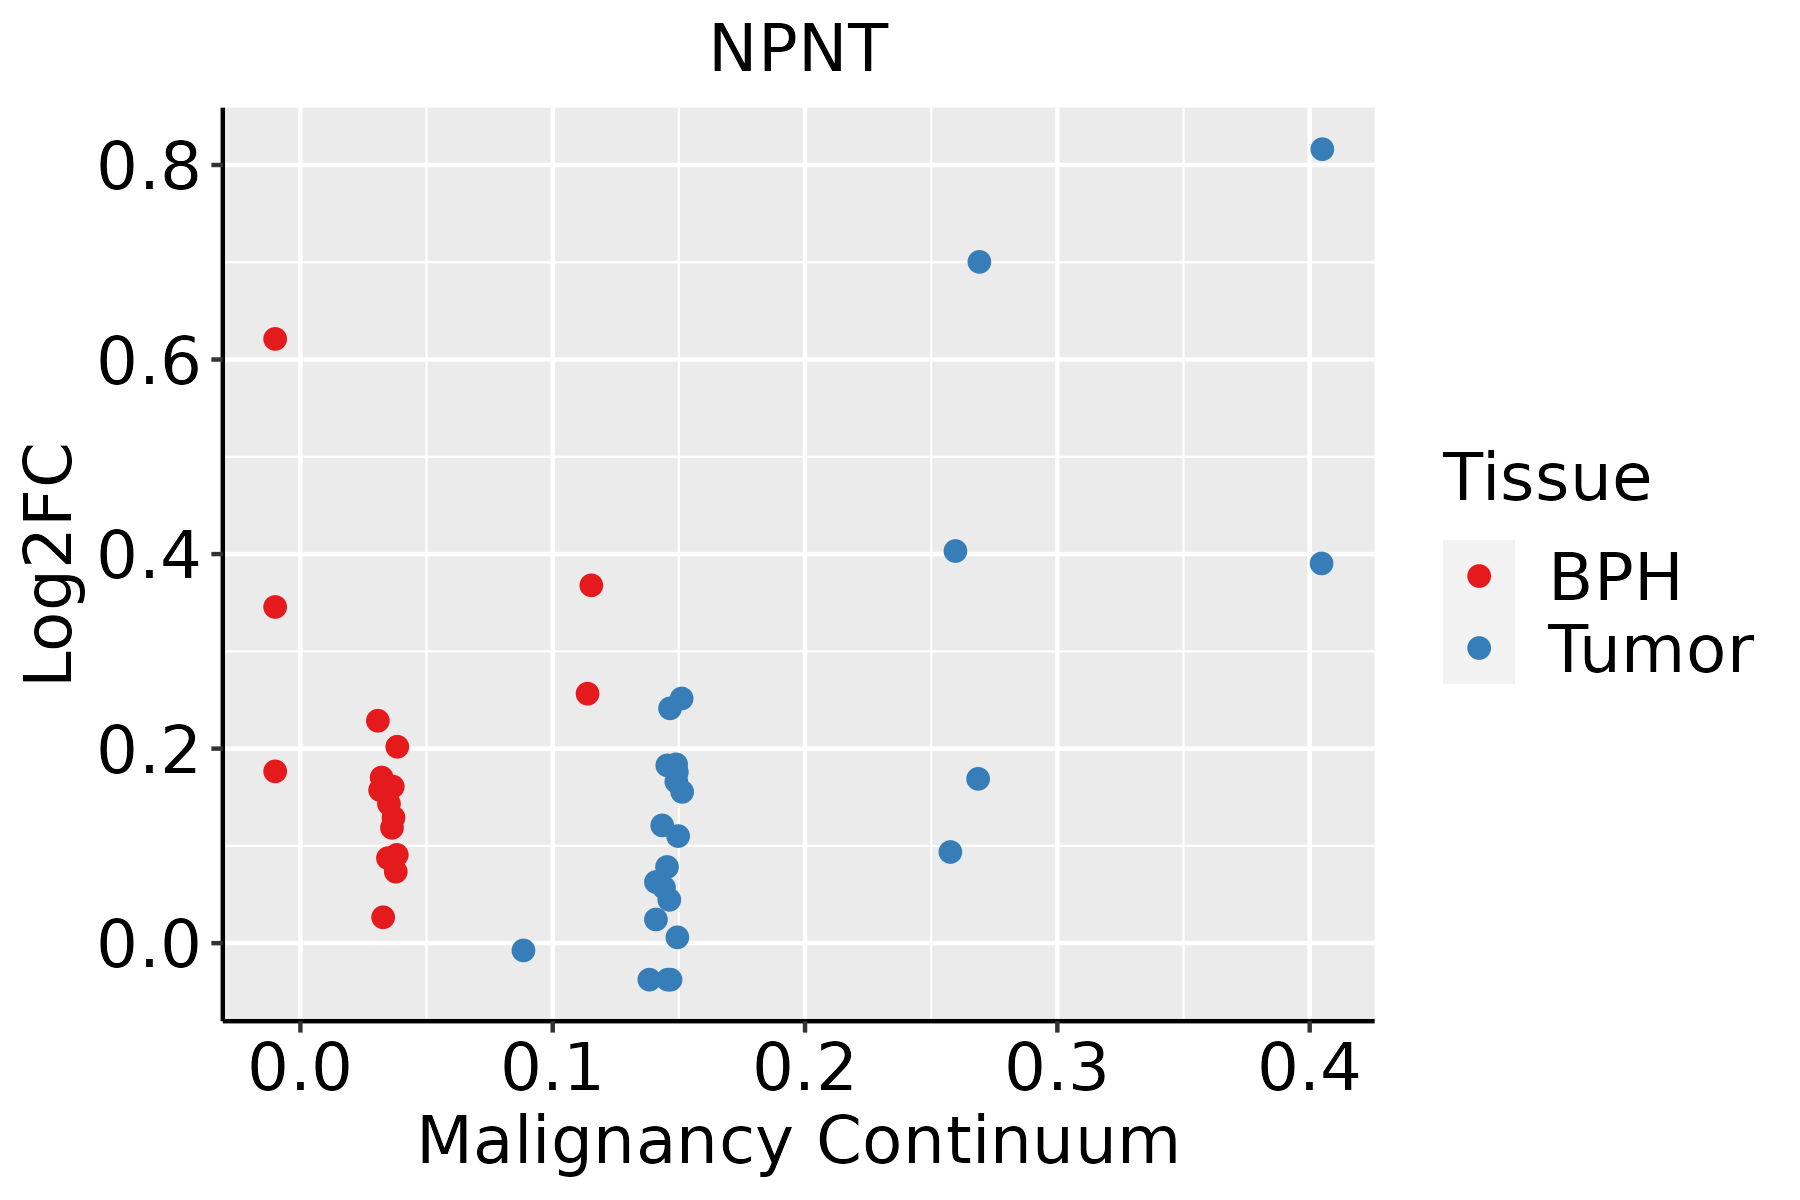 | BPH: Benign Prostatic Hyperplasia |
| Thyroid |  | ATC: Anaplastic thyroid cancer |
| HT: Hashimoto's thyroiditis | ||
| PTC: Papillary thyroid cancer |
| ∗log2FC in expression of this searched gene in stem-like cells from each diseased tissue sample relative to stem-like cells in normal samples in each tissue plotted against the malignancy continuum. Samples are colored based on if they are from different disease stage. |
Top |
Malignant transformation related pathway analysis |
| Find out the enriched GO biological processes and KEGG pathways involved in transition from healthy to precancer to cancer |
| Tissue | Disease Stage | Enriched GO biological Processes |
| Colorectum | AD |  |
| Colorectum | SER |  |
| Colorectum | MSS |  |
| Colorectum | MSI-H |  |
| Colorectum | FAP |  |
| ∗Top 15 enriched GO BP terms are showed in the bar plot of each disease state in each tissue. Each row represents a significant GO biological process which is colored according to the -log10(p.adjust). |
| Page: 1 2 3 4 5 6 7 8 9 |
| GO ID | Tissue | Disease Stage | Description | Gene Ratio | Bg Ratio | pvalue | p.adjust | Count |
| GO:0010811 | Colorectum | AD | positive regulation of cell-substrate adhesion | 53/3918 | 123/18723 | 2.30e-08 | 1.27e-06 | 53 |
| GO:0010810 | Colorectum | AD | regulation of cell-substrate adhesion | 81/3918 | 221/18723 | 4.80e-08 | 2.55e-06 | 81 |
| GO:0031589 | Colorectum | AD | cell-substrate adhesion | 116/3918 | 363/18723 | 4.68e-07 | 1.76e-05 | 116 |
| GO:0016311 | Colorectum | AD | dephosphorylation | 123/3918 | 417/18723 | 1.84e-05 | 3.82e-04 | 123 |
| GO:0007160 | Colorectum | AD | cell-matrix adhesion | 75/3918 | 233/18723 | 3.56e-05 | 6.45e-04 | 75 |
| GO:0035303 | Colorectum | AD | regulation of dephosphorylation | 46/3918 | 128/18723 | 6.20e-05 | 1.04e-03 | 46 |
| GO:0045785 | Colorectum | AD | positive regulation of cell adhesion | 122/3918 | 437/18723 | 2.65e-04 | 3.28e-03 | 122 |
| GO:0001649 | Colorectum | AD | osteoblast differentiation | 70/3918 | 229/18723 | 3.59e-04 | 4.18e-03 | 70 |
| GO:0060562 | Colorectum | AD | epithelial tube morphogenesis | 93/3918 | 325/18723 | 5.65e-04 | 6.00e-03 | 93 |
| GO:0007178 | Colorectum | AD | transmembrane receptor protein serine/threonine kinase signaling pathway | 99/3918 | 355/18723 | 9.92e-04 | 9.28e-03 | 99 |
| GO:0010921 | Colorectum | AD | regulation of phosphatase activity | 30/3918 | 84/18723 | 1.24e-03 | 1.09e-02 | 30 |
| GO:0071559 | Colorectum | AD | response to transforming growth factor beta | 74/3918 | 256/18723 | 1.45e-03 | 1.23e-02 | 74 |
| GO:0090257 | Colorectum | AD | regulation of muscle system process | 73/3918 | 252/18723 | 1.46e-03 | 1.24e-02 | 73 |
| GO:0071560 | Colorectum | AD | cellular response to transforming growth factor beta stimulus | 72/3918 | 250/18723 | 1.85e-03 | 1.52e-02 | 72 |
| GO:0007179 | Colorectum | AD | transforming growth factor beta receptor signaling pathway | 59/3918 | 198/18723 | 1.94e-03 | 1.58e-02 | 59 |
| GO:0010922 | Colorectum | AD | positive regulation of phosphatase activity | 15/3918 | 34/18723 | 1.96e-03 | 1.58e-02 | 15 |
| GO:0035306 | Colorectum | AD | positive regulation of dephosphorylation | 22/3918 | 59/18723 | 2.86e-03 | 2.14e-02 | 22 |
| GO:0072073 | Colorectum | AD | kidney epithelium development | 42/3918 | 136/18723 | 4.02e-03 | 2.80e-02 | 42 |
| GO:0001763 | Colorectum | AD | morphogenesis of a branching structure | 56/3918 | 196/18723 | 6.60e-03 | 4.09e-02 | 56 |
| GO:0001503 | Colorectum | AD | ossification | 106/3918 | 408/18723 | 7.68e-03 | 4.64e-02 | 106 |
| Page: 1 2 3 4 5 6 7 8 9 10 11 12 13 14 15 16 17 18 19 20 21 22 23 24 |
| Pathway ID | Tissue | Disease Stage | Description | Gene Ratio | Bg Ratio | pvalue | p.adjust | qvalue | Count |
| hsa045122 | Lung | AIS | ECM-receptor interaction | 20/961 | 89/8465 | 1.95e-03 | 1.26e-02 | 8.09e-03 | 20 |
| hsa045123 | Lung | AIS | ECM-receptor interaction | 20/961 | 89/8465 | 1.95e-03 | 1.26e-02 | 8.09e-03 | 20 |
| hsa045125 | Prostate | BPH | ECM-receptor interaction | 28/1718 | 89/8465 | 8.33e-03 | 2.64e-02 | 1.64e-02 | 28 |
| hsa0451212 | Prostate | BPH | ECM-receptor interaction | 28/1718 | 89/8465 | 8.33e-03 | 2.64e-02 | 1.64e-02 | 28 |
| Page: 1 |
Top |
Cell-cell communication analysis |
| Identification of potential cell-cell interactions between two cell types and their ligand-receptor pairs for different disease states |
| Ligand | Receptor | LRpair | Pathway | Tissue | Disease Stage |
| Page: 1 |
Top |
Single-cell gene regulatory network inference analysis |
| Find out the significant the regulons (TFs) and the target genes of each regulon across cell types for different disease states |
| TF | Cell Type | Tissue | Disease Stage | Target Gene | RSS | Regulon Activity |
| ∗The dot plots of a searched regulon are shown for all cell subpopulations in each disease state of each tissue based on the regulon specific score inferred using pySCENIC and by calculating the average expression. |
| Page: 1 |
Top |
Somatic mutation of malignant transformation related genes |
| Annotation of somatic variants for genes involved in malignant transformation |
| Hugo Symbol | Variant Class | Variant Classification | dbSNP RS | HGVSc | HGVSp | HGVSp Short | SWISSPROT | BIOTYPE | SIFT | PolyPhen | Tumor Sample Barcode | Tissue | Histology | Sex | Age | Stage | Therapy Types | Drugs | Outcome |
| NPNT | SNV | Missense_Mutation | novel | c.903N>T | p.Lys301Asn | p.K301N | Q6UXI9 | protein_coding | tolerated(0.08) | benign(0.076) | TCGA-A7-A0DB-01 | Breast | breast invasive carcinoma | Female | <65 | I/II | Hormone Therapy | arimidex | SD |
| NPNT | SNV | Missense_Mutation | c.1288N>C | p.Glu430Gln | p.E430Q | Q6UXI9 | protein_coding | tolerated(0.07) | probably_damaging(0.922) | TCGA-AC-A23H-01 | Breast | breast invasive carcinoma | Female | >=65 | I/II | Unknown | Unknown | PD | |
| NPNT | SNV | Missense_Mutation | rs756406157 | c.1147G>A | p.Gly383Arg | p.G383R | Q6UXI9 | protein_coding | tolerated(0.6) | benign(0) | TCGA-AN-A046-01 | Breast | breast invasive carcinoma | Female | >=65 | I/II | Unknown | Unknown | SD |
| NPNT | insertion | Frame_Shift_Ins | novel | c.1292_1293insGTGCTTGCTGCCTGAAACCCTCCCTCTTCCCC | p.Ile431MetfsTer64 | p.I431Mfs*64 | Q6UXI9 | protein_coding | TCGA-AO-A03R-01 | Breast | breast invasive carcinoma | Female | <65 | I/II | Chemotherapy | doxorubicin | SD | ||
| NPNT | deletion | Frame_Shift_Del | novel | c.886delN | p.Pro296GlnfsTer12 | p.P296Qfs*12 | Q6UXI9 | protein_coding | TCGA-EW-A2FV-01 | Breast | breast invasive carcinoma | Female | <65 | III/IV | Chemotherapy | docetaxel | SD | ||
| NPNT | SNV | Missense_Mutation | novel | c.289G>C | p.Asp97His | p.D97H | Q6UXI9 | protein_coding | tolerated(0.3) | benign(0) | TCGA-VS-A958-01 | Cervix | cervical & endocervical cancer | Female | <65 | I/II | Chemotherapy | cisplatin | CR |
| NPNT | SNV | Missense_Mutation | rs199598735 | c.694G>A | p.Asp232Asn | p.D232N | Q6UXI9 | protein_coding | deleterious(0) | benign(0.013) | TCGA-AA-3510-01 | Colorectum | colon adenocarcinoma | Male | >=65 | I/II | Unknown | Unknown | SD |
| NPNT | SNV | Missense_Mutation | c.634N>G | p.Arg212Gly | p.R212G | Q6UXI9 | protein_coding | deleterious(0.03) | possibly_damaging(0.896) | TCGA-AD-6964-01 | Colorectum | colon adenocarcinoma | Male | <65 | III/IV | Chemotherapy | folfox | PD | |
| NPNT | SNV | Missense_Mutation | novel | c.862N>C | p.Lys288Gln | p.K288Q | Q6UXI9 | protein_coding | tolerated(0.05) | benign(0.082) | TCGA-CA-6717-01 | Colorectum | colon adenocarcinoma | Male | <65 | I/II | Chemotherapy | oxaliplatin | CR |
| NPNT | SNV | Missense_Mutation | novel | c.1321N>T | p.Ala441Ser | p.A441S | Q6UXI9 | protein_coding | tolerated(0.07) | benign(0.012) | TCGA-A5-A2K5-01 | Endometrium | uterine corpus endometrioid carcinoma | Female | >=65 | I/II | Unknown | Unknown | SD |
| Page: 1 2 3 4 5 6 |
Top |
Related drugs of malignant transformation related genes |
| Identification of chemicals and drugs interact with genes involved in malignant transfromation |
| (DGIdb 4.0) |
| Entrez ID | Symbol | Category | Interaction Types | Drug Claim Name | Drug Name | PMIDs |
| Page: 1 |

Copyright 2023-Present -The University of Texas Health Science Center at Houston |