| Tissue | Expression Dynamics | Abbreviation |
| Cervix | 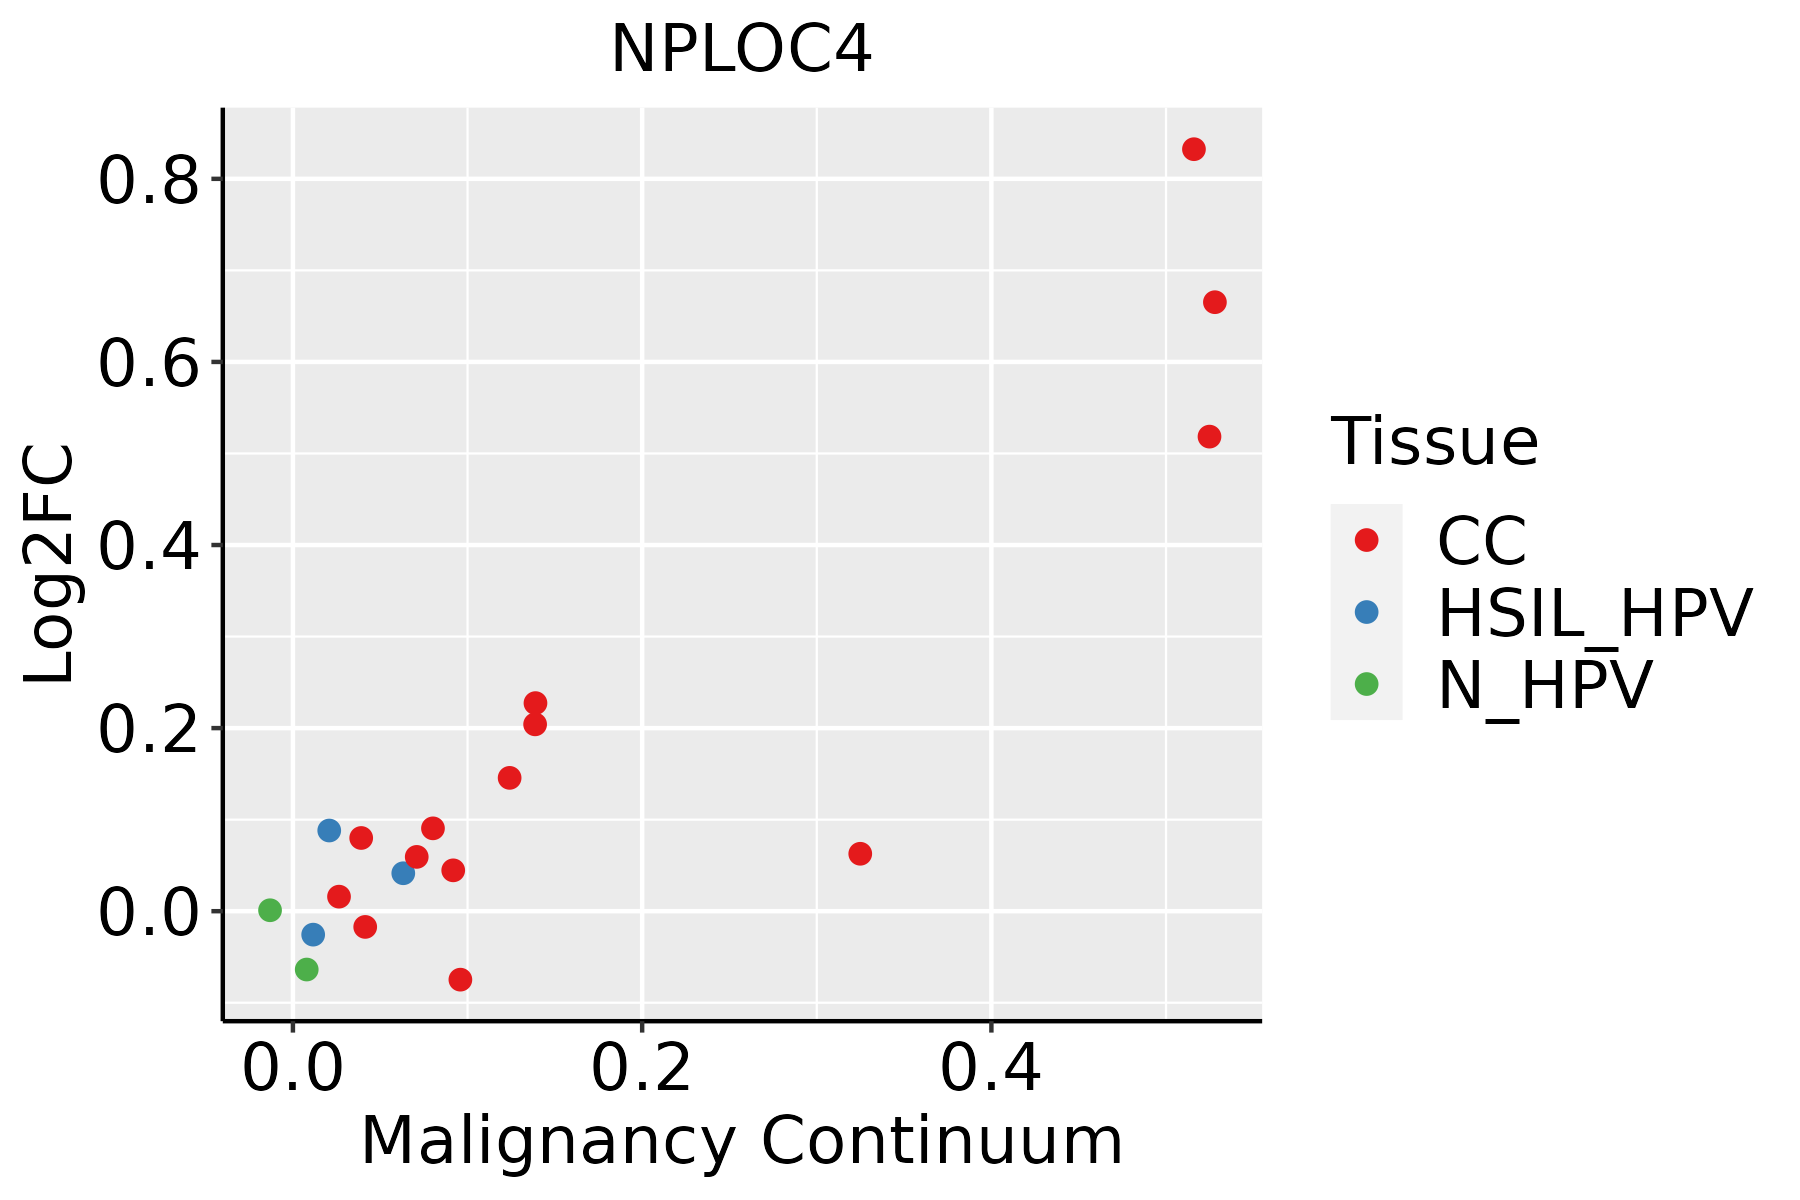 | CC: Cervix cancer |
| HSIL_HPV: HPV-infected high-grade squamous intraepithelial lesions |
| N_HPV: HPV-infected normal cervix |
| Endometrium | 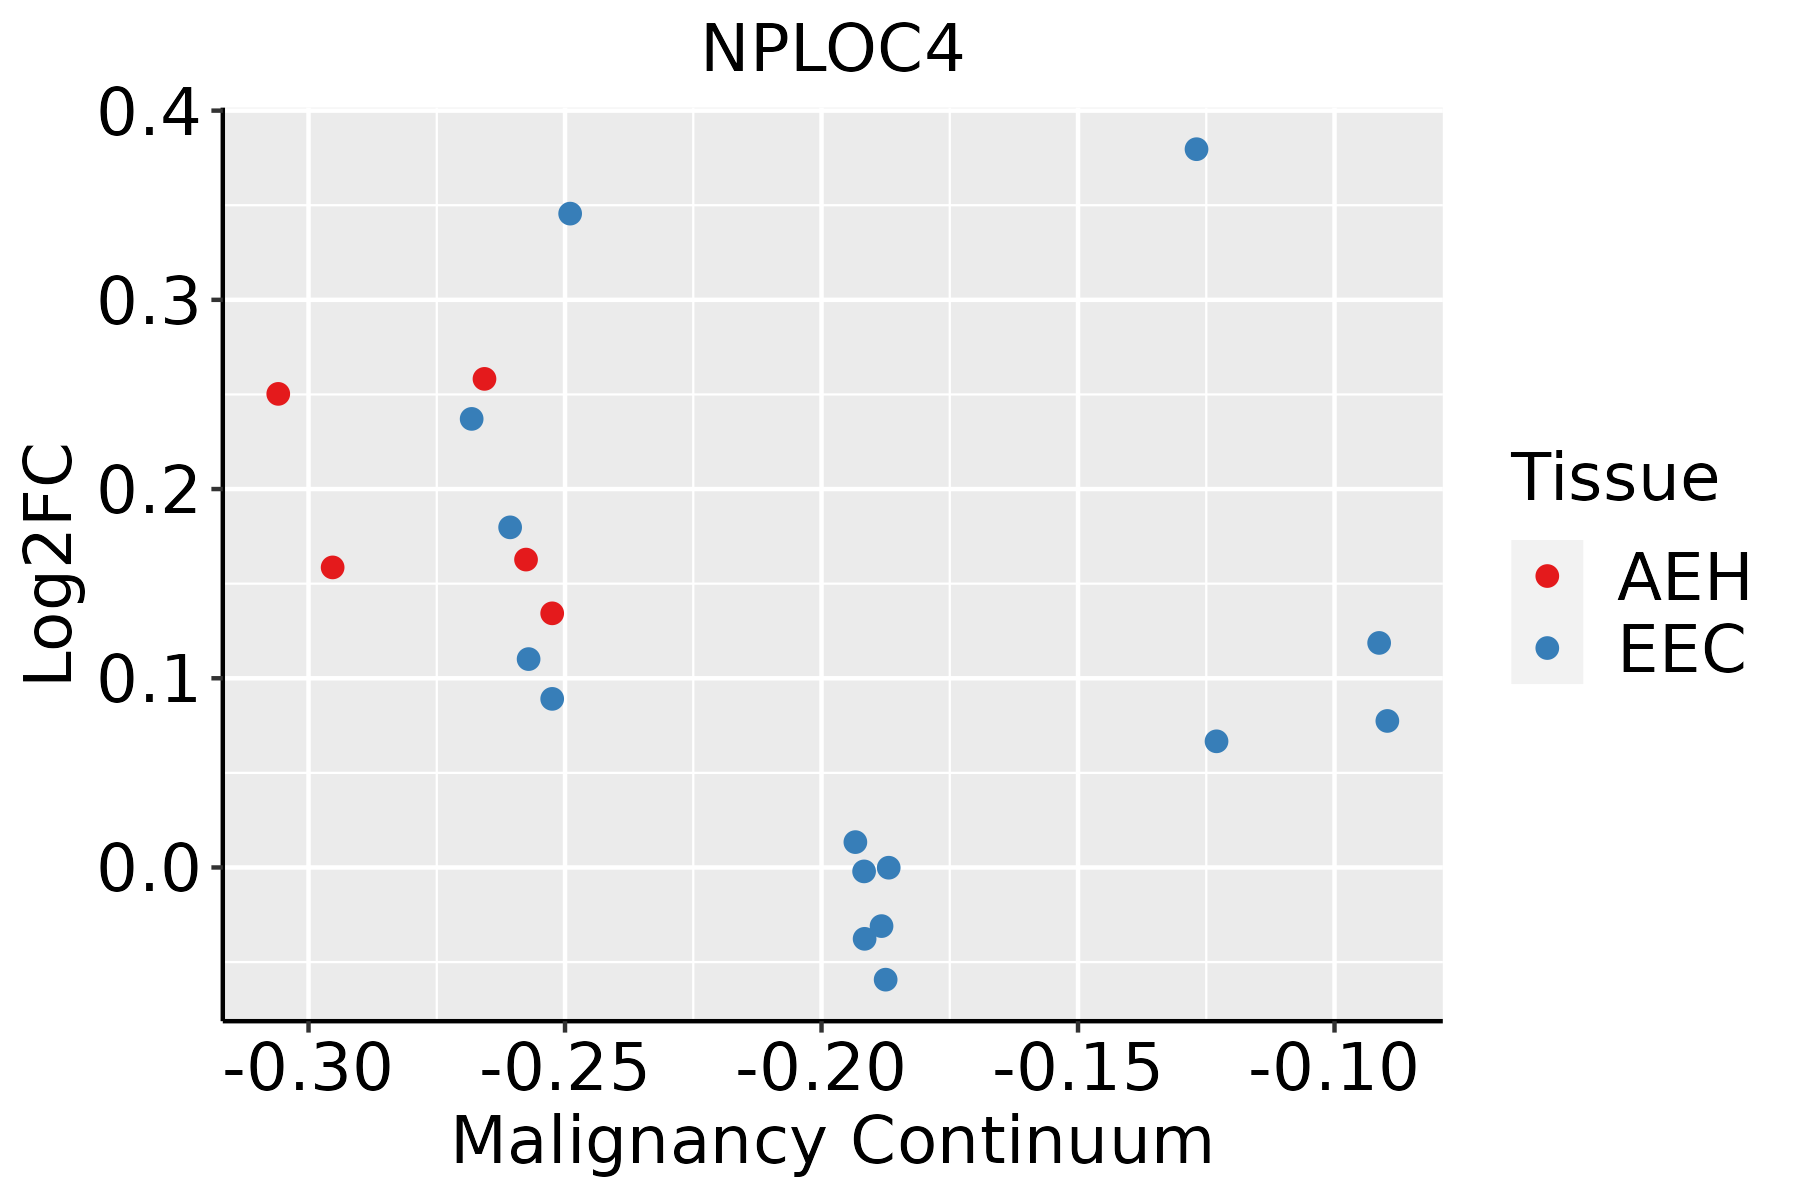 | AEH: Atypical endometrial hyperplasia |
| EEC: Endometrioid Cancer |
| Esophagus |  | ESCC: Esophageal squamous cell carcinoma |
| HGIN: High-grade intraepithelial neoplasias |
| LGIN: Low-grade intraepithelial neoplasias |
| Liver | 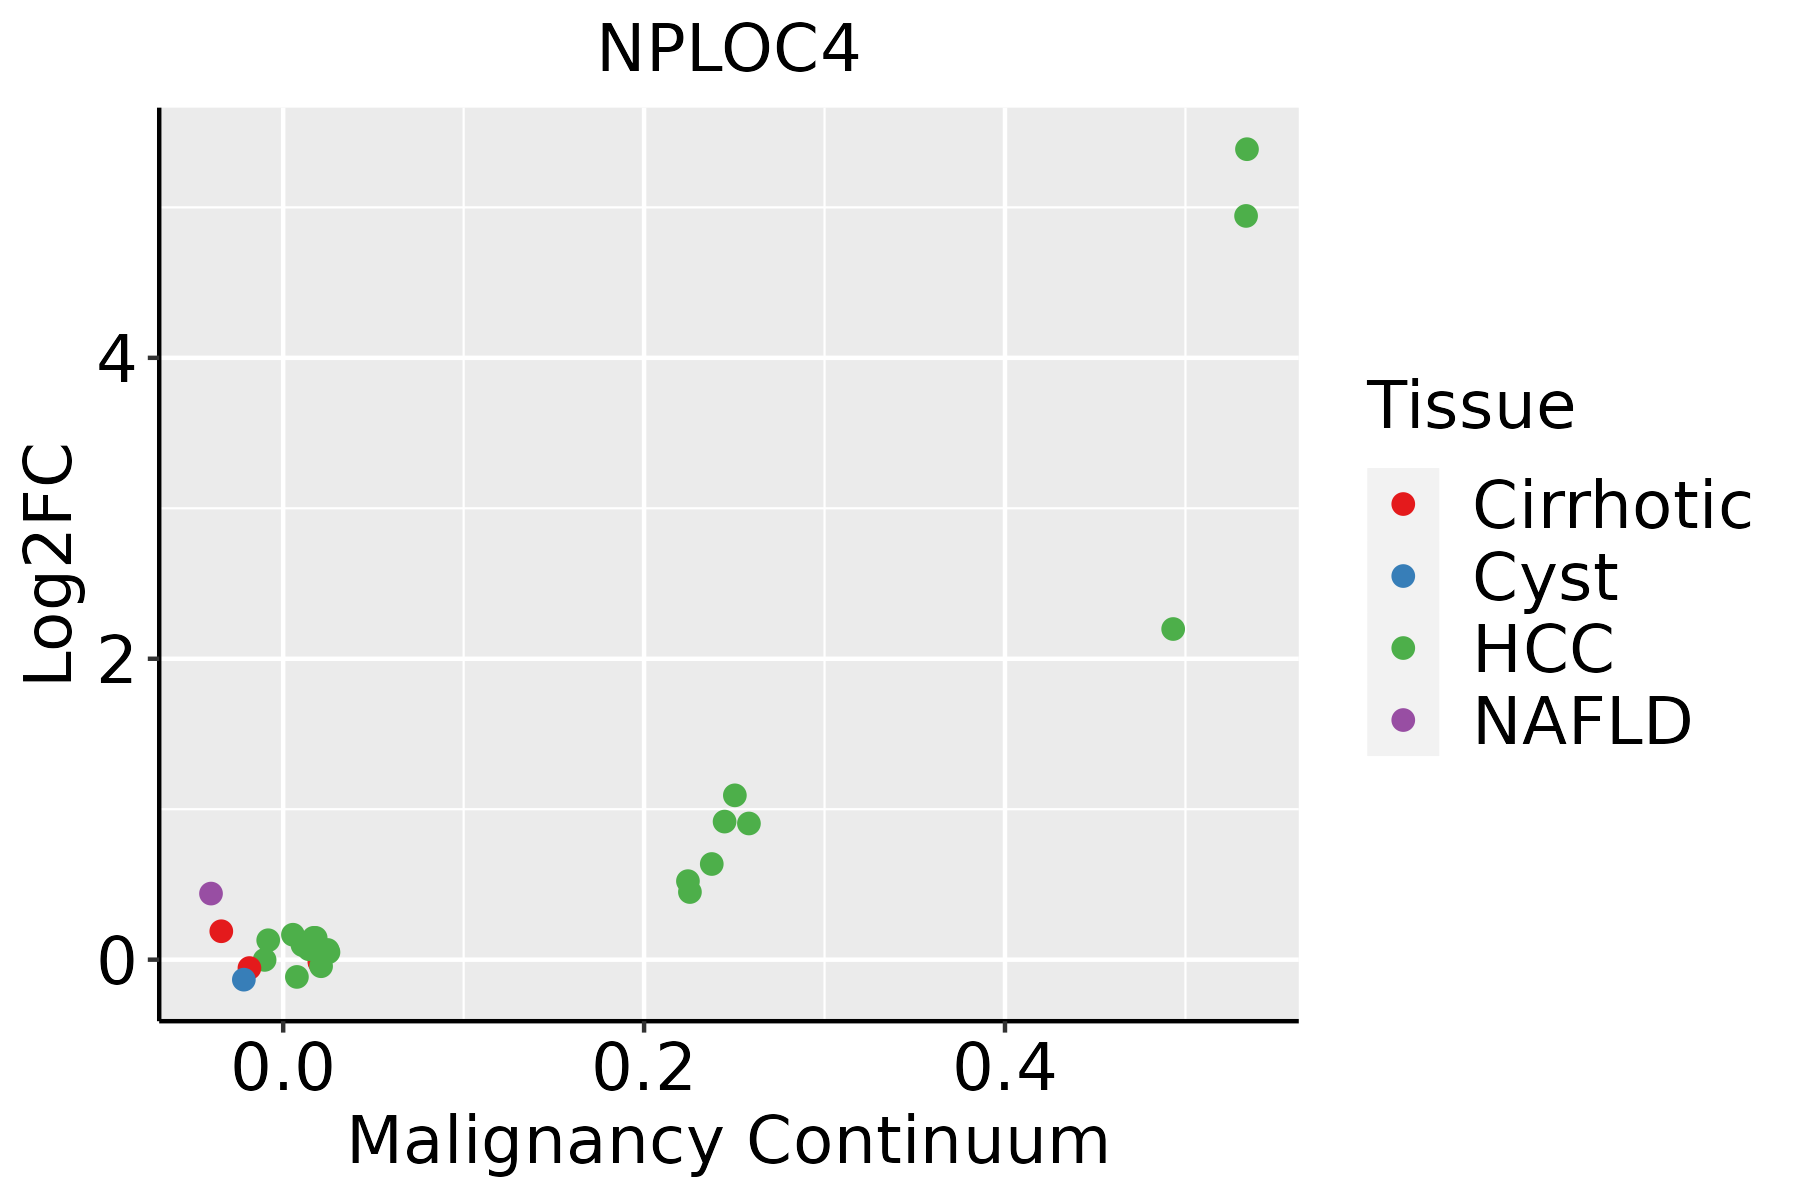 | HCC: Hepatocellular carcinoma |
| NAFLD: Non-alcoholic fatty liver disease |
| Lung | 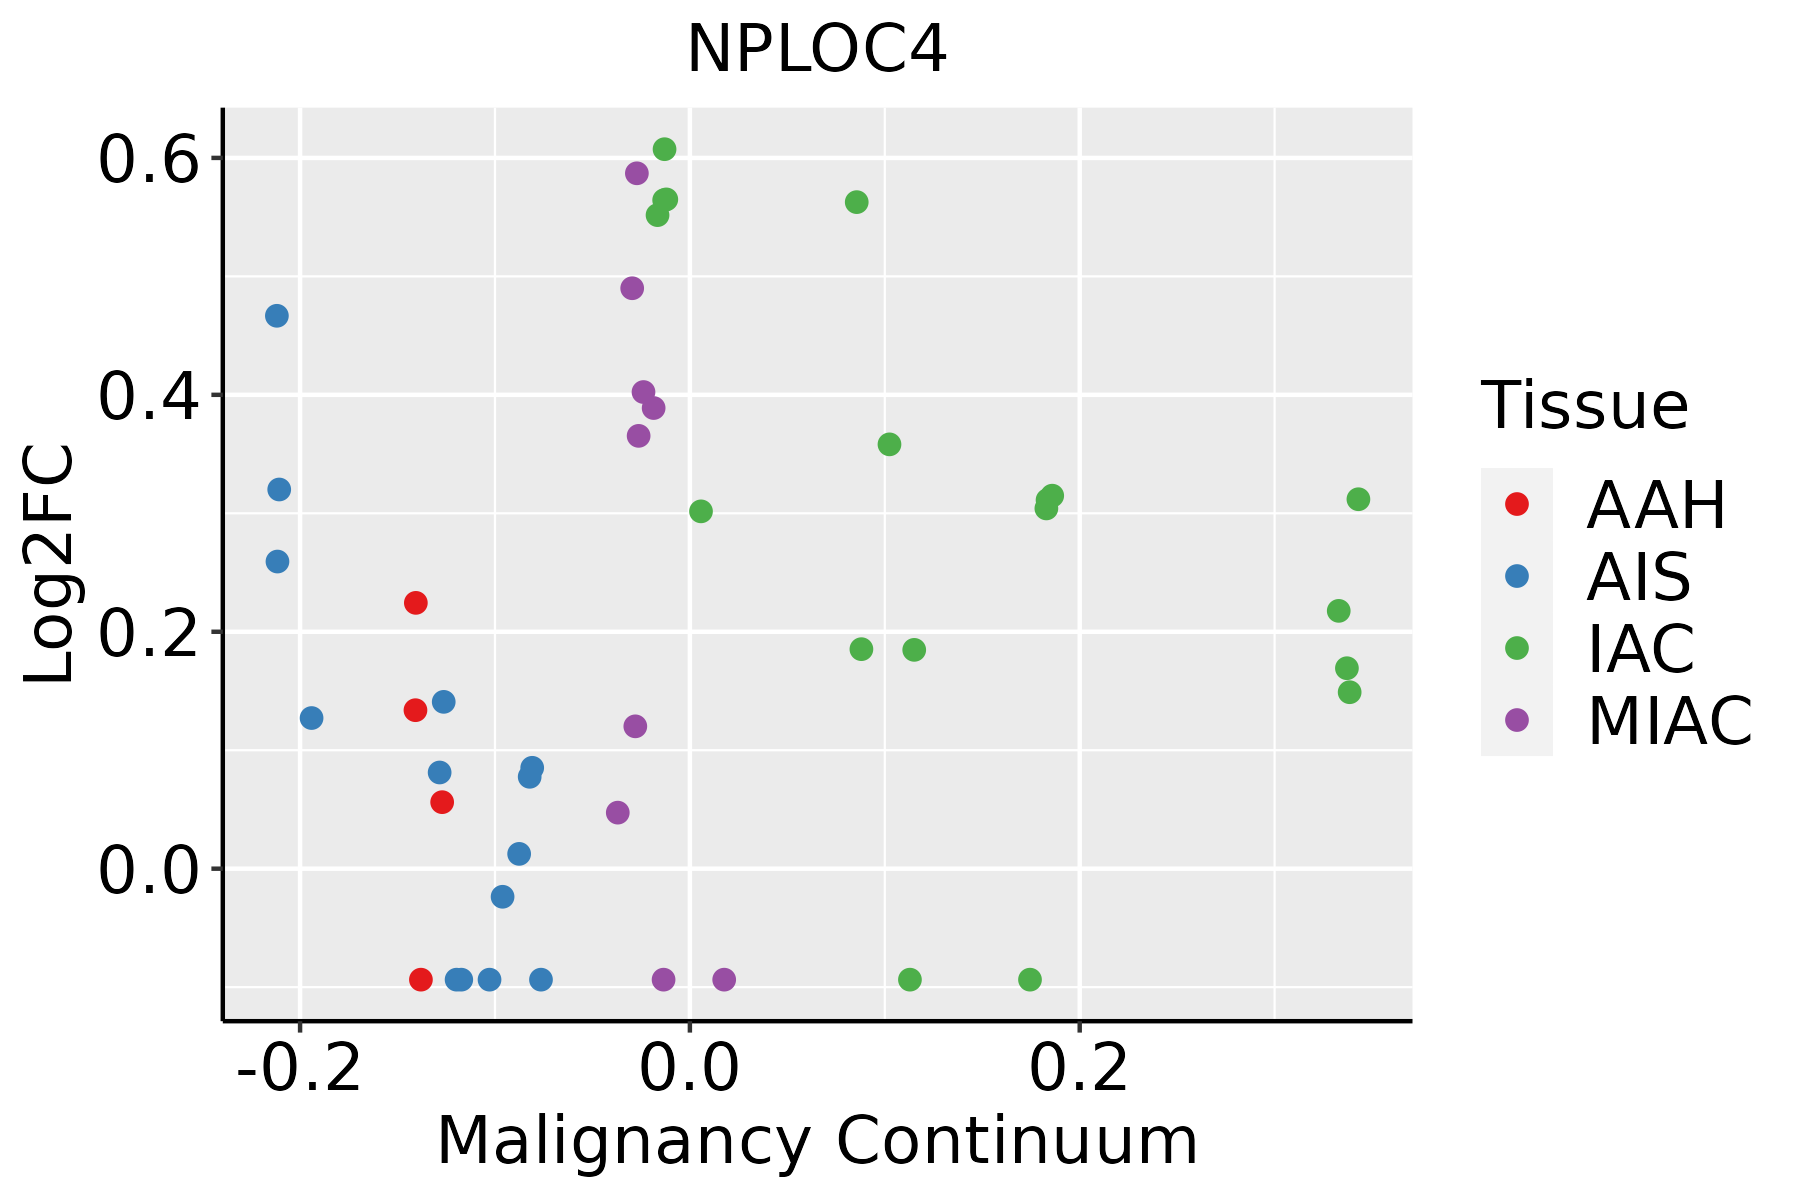 | AAH: Atypical adenomatous hyperplasia |
| AIS: Adenocarcinoma in situ |
| IAC: Invasive lung adenocarcinoma |
| MIA: Minimally invasive adenocarcinoma |
| Oral Cavity |  | EOLP: Erosive Oral lichen planus |
| LP: leukoplakia |
| NEOLP: Non-erosive oral lichen planus |
| OSCC: Oral squamous cell carcinoma |
| Skin |  | AK: Actinic keratosis |
| cSCC: Cutaneous squamous cell carcinoma |
| SCCIS:squamous cell carcinoma in situ |
| Thyroid |  | ATC: Anaplastic thyroid cancer |
| HT: Hashimoto's thyroiditis |
| PTC: Papillary thyroid cancer |
| GO ID | Tissue | Disease Stage | Description | Gene Ratio | Bg Ratio | pvalue | p.adjust | Count |
| GO:001049810 | Cervix | CC | proteasomal protein catabolic process | 111/2311 | 490/18723 | 8.98e-11 | 1.58e-08 | 111 |
| GO:004316110 | Cervix | CC | proteasome-mediated ubiquitin-dependent protein catabolic process | 91/2311 | 412/18723 | 1.65e-08 | 1.25e-06 | 91 |
| GO:00026837 | Cervix | CC | negative regulation of immune system process | 94/2311 | 434/18723 | 2.63e-08 | 1.87e-06 | 94 |
| GO:00027644 | Cervix | CC | immune response-regulating signaling pathway | 97/2311 | 468/18723 | 1.49e-07 | 7.07e-06 | 97 |
| GO:00305229 | Cervix | CC | intracellular receptor signaling pathway | 60/2311 | 265/18723 | 1.89e-06 | 5.97e-05 | 60 |
| GO:003497610 | Cervix | CC | response to endoplasmic reticulum stress | 57/2311 | 256/18723 | 5.81e-06 | 1.42e-04 | 57 |
| GO:00028315 | Cervix | CC | regulation of response to biotic stimulus | 67/2311 | 327/18723 | 1.79e-05 | 3.36e-04 | 67 |
| GO:00096158 | Cervix | CC | response to virus | 73/2311 | 367/18723 | 2.22e-05 | 3.95e-04 | 73 |
| GO:00022212 | Cervix | CC | pattern recognition receptor signaling pathway | 39/2311 | 172/18723 | 1.08e-04 | 1.38e-03 | 39 |
| GO:00622073 | Cervix | CC | regulation of pattern recognition receptor signaling pathway | 27/2311 | 105/18723 | 1.37e-04 | 1.68e-03 | 27 |
| GO:00027534 | Cervix | CC | cytoplasmic pattern recognition receptor signaling pathway | 18/2311 | 60/18723 | 2.26e-04 | 2.55e-03 | 18 |
| GO:00028322 | Cervix | CC | negative regulation of response to biotic stimulus | 27/2311 | 108/18723 | 2.27e-04 | 2.55e-03 | 27 |
| GO:00507773 | Cervix | CC | negative regulation of immune response | 41/2311 | 194/18723 | 3.63e-04 | 3.76e-03 | 41 |
| GO:00321022 | Cervix | CC | negative regulation of response to external stimulus | 75/2311 | 420/18723 | 5.96e-04 | 5.61e-03 | 75 |
| GO:00395292 | Cervix | CC | RIG-I signaling pathway | 10/2311 | 27/18723 | 9.25e-04 | 7.84e-03 | 10 |
| GO:00395352 | Cervix | CC | regulation of RIG-I signaling pathway | 8/2311 | 20/18723 | 1.69e-03 | 1.29e-02 | 8 |
| GO:0031348 | Cervix | CC | negative regulation of defense response | 48/2311 | 258/18723 | 2.30e-03 | 1.65e-02 | 48 |
| GO:00985863 | Cervix | CC | cellular response to virus | 20/2311 | 84/18723 | 2.62e-03 | 1.81e-02 | 20 |
| GO:00070304 | Cervix | CC | Golgi organization | 32/2311 | 157/18723 | 2.78e-03 | 1.87e-02 | 32 |
| GO:00324791 | Cervix | CC | regulation of type I interferon production | 21/2311 | 95/18723 | 5.32e-03 | 3.10e-02 | 21 |
| Pathway ID | Tissue | Disease Stage | Description | Gene Ratio | Bg Ratio | pvalue | p.adjust | qvalue | Count |
| hsa0414120 | Cervix | CC | Protein processing in endoplasmic reticulum | 55/1267 | 174/8465 | 1.74e-08 | 2.68e-07 | 1.58e-07 | 55 |
| hsa04141110 | Cervix | CC | Protein processing in endoplasmic reticulum | 55/1267 | 174/8465 | 1.74e-08 | 2.68e-07 | 1.58e-07 | 55 |
| hsa0414126 | Endometrium | AEH | Protein processing in endoplasmic reticulum | 62/1197 | 174/8465 | 5.97e-13 | 1.39e-11 | 1.01e-11 | 62 |
| hsa04141111 | Endometrium | AEH | Protein processing in endoplasmic reticulum | 62/1197 | 174/8465 | 5.97e-13 | 1.39e-11 | 1.01e-11 | 62 |
| hsa0414127 | Endometrium | EEC | Protein processing in endoplasmic reticulum | 64/1237 | 174/8465 | 2.17e-13 | 5.09e-12 | 3.80e-12 | 64 |
| hsa0414136 | Endometrium | EEC | Protein processing in endoplasmic reticulum | 64/1237 | 174/8465 | 2.17e-13 | 5.09e-12 | 3.80e-12 | 64 |
| hsa04141211 | Esophagus | ESCC | Protein processing in endoplasmic reticulum | 147/4205 | 174/8465 | 3.29e-22 | 1.10e-19 | 5.64e-20 | 147 |
| hsa04141310 | Esophagus | ESCC | Protein processing in endoplasmic reticulum | 147/4205 | 174/8465 | 3.29e-22 | 1.10e-19 | 5.64e-20 | 147 |
| hsa0414114 | Liver | Cirrhotic | Protein processing in endoplasmic reticulum | 114/2530 | 174/8465 | 1.16e-22 | 9.67e-21 | 5.96e-21 | 114 |
| hsa0414115 | Liver | Cirrhotic | Protein processing in endoplasmic reticulum | 114/2530 | 174/8465 | 1.16e-22 | 9.67e-21 | 5.96e-21 | 114 |
| hsa0414122 | Liver | HCC | Protein processing in endoplasmic reticulum | 146/4020 | 174/8465 | 7.34e-24 | 2.46e-21 | 1.37e-21 | 146 |
| hsa0414132 | Liver | HCC | Protein processing in endoplasmic reticulum | 146/4020 | 174/8465 | 7.34e-24 | 2.46e-21 | 1.37e-21 | 146 |
| hsa0414116 | Lung | IAC | Protein processing in endoplasmic reticulum | 37/1053 | 174/8465 | 6.53e-04 | 5.73e-03 | 3.81e-03 | 37 |
| hsa0414117 | Lung | IAC | Protein processing in endoplasmic reticulum | 37/1053 | 174/8465 | 6.53e-04 | 5.73e-03 | 3.81e-03 | 37 |
| hsa0414123 | Lung | AIS | Protein processing in endoplasmic reticulum | 35/961 | 174/8465 | 4.88e-04 | 4.39e-03 | 2.81e-03 | 35 |
| hsa0414133 | Lung | AIS | Protein processing in endoplasmic reticulum | 35/961 | 174/8465 | 4.88e-04 | 4.39e-03 | 2.81e-03 | 35 |
| hsa0414130 | Oral cavity | OSCC | Protein processing in endoplasmic reticulum | 143/3704 | 174/8465 | 6.82e-26 | 2.28e-23 | 1.16e-23 | 143 |
| hsa04141113 | Oral cavity | OSCC | Protein processing in endoplasmic reticulum | 143/3704 | 174/8465 | 6.82e-26 | 2.28e-23 | 1.16e-23 | 143 |
| hsa04141210 | Oral cavity | LP | Protein processing in endoplasmic reticulum | 113/2418 | 174/8465 | 8.74e-24 | 5.82e-22 | 3.76e-22 | 113 |
| hsa0414138 | Oral cavity | LP | Protein processing in endoplasmic reticulum | 113/2418 | 174/8465 | 8.74e-24 | 5.82e-22 | 3.76e-22 | 113 |
| Hugo Symbol | Variant Class | Variant Classification | dbSNP RS | HGVSc | HGVSp | HGVSp Short | SWISSPROT | BIOTYPE | SIFT | PolyPhen | Tumor Sample Barcode | Tissue | Histology | Sex | Age | Stage | Therapy Types | Drugs | Outcome |
| NPLOC4 | SNV | Missense_Mutation | novel | c.1536C>A | p.Phe512Leu | p.F512L | Q8TAT6 | protein_coding | deleterious(0.03) | benign(0.389) | TCGA-A2-A3XU-01 | Breast | breast invasive carcinoma | Female | <65 | I/II | Hormone Therapy | arimidex | PD |
| NPLOC4 | SNV | Missense_Mutation | novel | c.974T>C | p.Val325Ala | p.V325A | Q8TAT6 | protein_coding | deleterious(0) | probably_damaging(0.999) | TCGA-D8-A1XK-01 | Breast | breast invasive carcinoma | Female | <65 | I/II | Chemotherapy | doxorubicine+cyclophosphamide | SD |
| NPLOC4 | insertion | Frame_Shift_Ins | novel | c.497_498insTATTATTTTAC | p.Tyr167IlefsTer9 | p.Y167Ifs*9 | Q8TAT6 | protein_coding | | | TCGA-A8-A09X-01 | Breast | breast invasive carcinoma | Female | <65 | III/IV | Unknown | Unknown | SD |
| NPLOC4 | insertion | Frame_Shift_Ins | novel | c.495_496insACCCTACCAGAAAGTAGCAGGCTTCA | p.Ala166ThrfsTer15 | p.A166Tfs*15 | Q8TAT6 | protein_coding | | | TCGA-A8-A09X-01 | Breast | breast invasive carcinoma | Female | <65 | III/IV | Unknown | Unknown | SD |
| NPLOC4 | insertion | Frame_Shift_Ins | novel | c.1415_1416insATTTCTATTTCGCAAAATCCATTTCC | p.Ile473PhefsTer129 | p.I473Ffs*129 | Q8TAT6 | protein_coding | | | TCGA-AR-A2LR-01 | Breast | breast invasive carcinoma | Female | <65 | I/II | Chemotherapy | adriamycin | SD |
| NPLOC4 | deletion | Frame_Shift_Del | novel | c.936delT | p.Phe312LeufsTer25 | p.F312Lfs*25 | Q8TAT6 | protein_coding | | | TCGA-EW-A2FV-01 | Breast | breast invasive carcinoma | Female | <65 | III/IV | Chemotherapy | docetaxel | SD |
| NPLOC4 | SNV | Missense_Mutation | novel | c.442N>A | p.Asp148Asn | p.D148N | Q8TAT6 | protein_coding | deleterious(0.05) | possibly_damaging(0.518) | TCGA-2W-A8YY-01 | Cervix | cervical & endocervical cancer | Female | <65 | I/II | Chemotherapy | cisplatin | CR |
| NPLOC4 | SNV | Missense_Mutation | novel | c.397N>A | p.Gly133Ser | p.G133S | Q8TAT6 | protein_coding | tolerated(0.06) | benign(0.209) | TCGA-2W-A8YY-01 | Cervix | cervical & endocervical cancer | Female | <65 | I/II | Chemotherapy | cisplatin | CR |
| NPLOC4 | SNV | Missense_Mutation | novel | c.962G>A | p.Arg321Gln | p.R321Q | Q8TAT6 | protein_coding | tolerated(0.51) | benign(0.045) | TCGA-C5-A7CK-01 | Cervix | cervical & endocervical cancer | Female | <65 | I/II | Chemotherapy | cisplatin | SD |
| NPLOC4 | SNV | Missense_Mutation | novel | c.1762N>T | p.His588Tyr | p.H588Y | Q8TAT6 | protein_coding | deleterious(0.03) | possibly_damaging(0.854) | TCGA-EA-A410-01 | Cervix | cervical & endocervical cancer | Female | <65 | I/II | Unknown | Unknown | SD |


