
|
|||||
|
 | |
| |
| |
| |
| |
| |
|
Gene: NPDC1 |
Gene summary for NPDC1 |
| Gene information | Species | Human | Gene symbol | NPDC1 | Gene ID | 56654 |
| Gene name | neural proliferation, differentiation and control 1 | |
| Gene Alias | CAB | |
| Cytomap | 9q34.3 | |
| Gene Type | protein-coding | GO ID | GO:0005575 | UniProtAcc | Q9NQX5 |
Top |
Malignant transformation analysis |
| Identification of the aberrant gene expression in precancerous and cancerous lesions by comparing the gene expression of stem-like cells in diseased tissues with normal stem cells |
| Entrez ID | Symbol | Replicates | Species | Organ | Tissue | Adj P-value | Log2FC | Malignancy |
| 56654 | NPDC1 | HTA11_3410_2000001011 | Human | Colorectum | AD | 1.70e-12 | 2.59e-01 | 0.0155 |
| 56654 | NPDC1 | HTA11_2487_2000001011 | Human | Colorectum | SER | 7.58e-13 | 4.76e-01 | -0.1808 |
| 56654 | NPDC1 | HTA11_2951_2000001011 | Human | Colorectum | AD | 2.97e-03 | 3.20e-01 | 0.0216 |
| 56654 | NPDC1 | HTA11_1938_2000001011 | Human | Colorectum | AD | 1.73e-23 | 5.83e-01 | -0.0811 |
| 56654 | NPDC1 | HTA11_78_2000001011 | Human | Colorectum | AD | 8.19e-22 | 5.75e-01 | -0.1088 |
| 56654 | NPDC1 | HTA11_411_2000001011 | Human | Colorectum | SER | 5.97e-08 | 6.45e-01 | -0.2602 |
| 56654 | NPDC1 | HTA11_2112_2000001011 | Human | Colorectum | SER | 4.03e-10 | 9.07e-01 | -0.2196 |
| 56654 | NPDC1 | HTA11_3361_2000001011 | Human | Colorectum | AD | 3.24e-15 | 6.40e-01 | -0.1207 |
| 56654 | NPDC1 | HTA11_696_2000001011 | Human | Colorectum | AD | 1.93e-23 | 5.53e-01 | -0.1464 |
| 56654 | NPDC1 | HTA11_866_2000001011 | Human | Colorectum | AD | 1.69e-11 | 4.06e-01 | -0.1001 |
| 56654 | NPDC1 | HTA11_1391_2000001011 | Human | Colorectum | AD | 5.27e-25 | 7.09e-01 | -0.059 |
| 56654 | NPDC1 | HTA11_2992_2000001011 | Human | Colorectum | SER | 1.17e-02 | 3.41e-01 | -0.1706 |
| 56654 | NPDC1 | HTA11_546_2000001011 | Human | Colorectum | AD | 4.90e-08 | 4.52e-01 | -0.0842 |
| 56654 | NPDC1 | HTA11_866_3004761011 | Human | Colorectum | AD | 2.88e-22 | 4.89e-01 | 0.096 |
| 56654 | NPDC1 | HTA11_9408_2000001011 | Human | Colorectum | AD | 3.18e-05 | 5.70e-01 | 0.0451 |
| 56654 | NPDC1 | HTA11_8622_2000001021 | Human | Colorectum | SER | 1.80e-04 | 3.31e-01 | 0.0528 |
| 56654 | NPDC1 | HTA11_10623_2000001011 | Human | Colorectum | AD | 1.32e-05 | 3.72e-01 | -0.0177 |
| 56654 | NPDC1 | HTA11_10711_2000001011 | Human | Colorectum | AD | 2.89e-31 | 7.93e-01 | 0.0338 |
| 56654 | NPDC1 | HTA11_7696_3000711011 | Human | Colorectum | AD | 4.75e-30 | 6.82e-01 | 0.0674 |
| 56654 | NPDC1 | HTA11_6818_2000001011 | Human | Colorectum | AD | 1.87e-09 | 3.61e-01 | 0.0112 |
| Page: 1 2 3 4 5 6 7 |
| Tissue | Expression Dynamics | Abbreviation |
| Colorectum (GSE201348) |  | FAP: Familial adenomatous polyposis |
| CRC: Colorectal cancer | ||
| Colorectum (HTA11) | 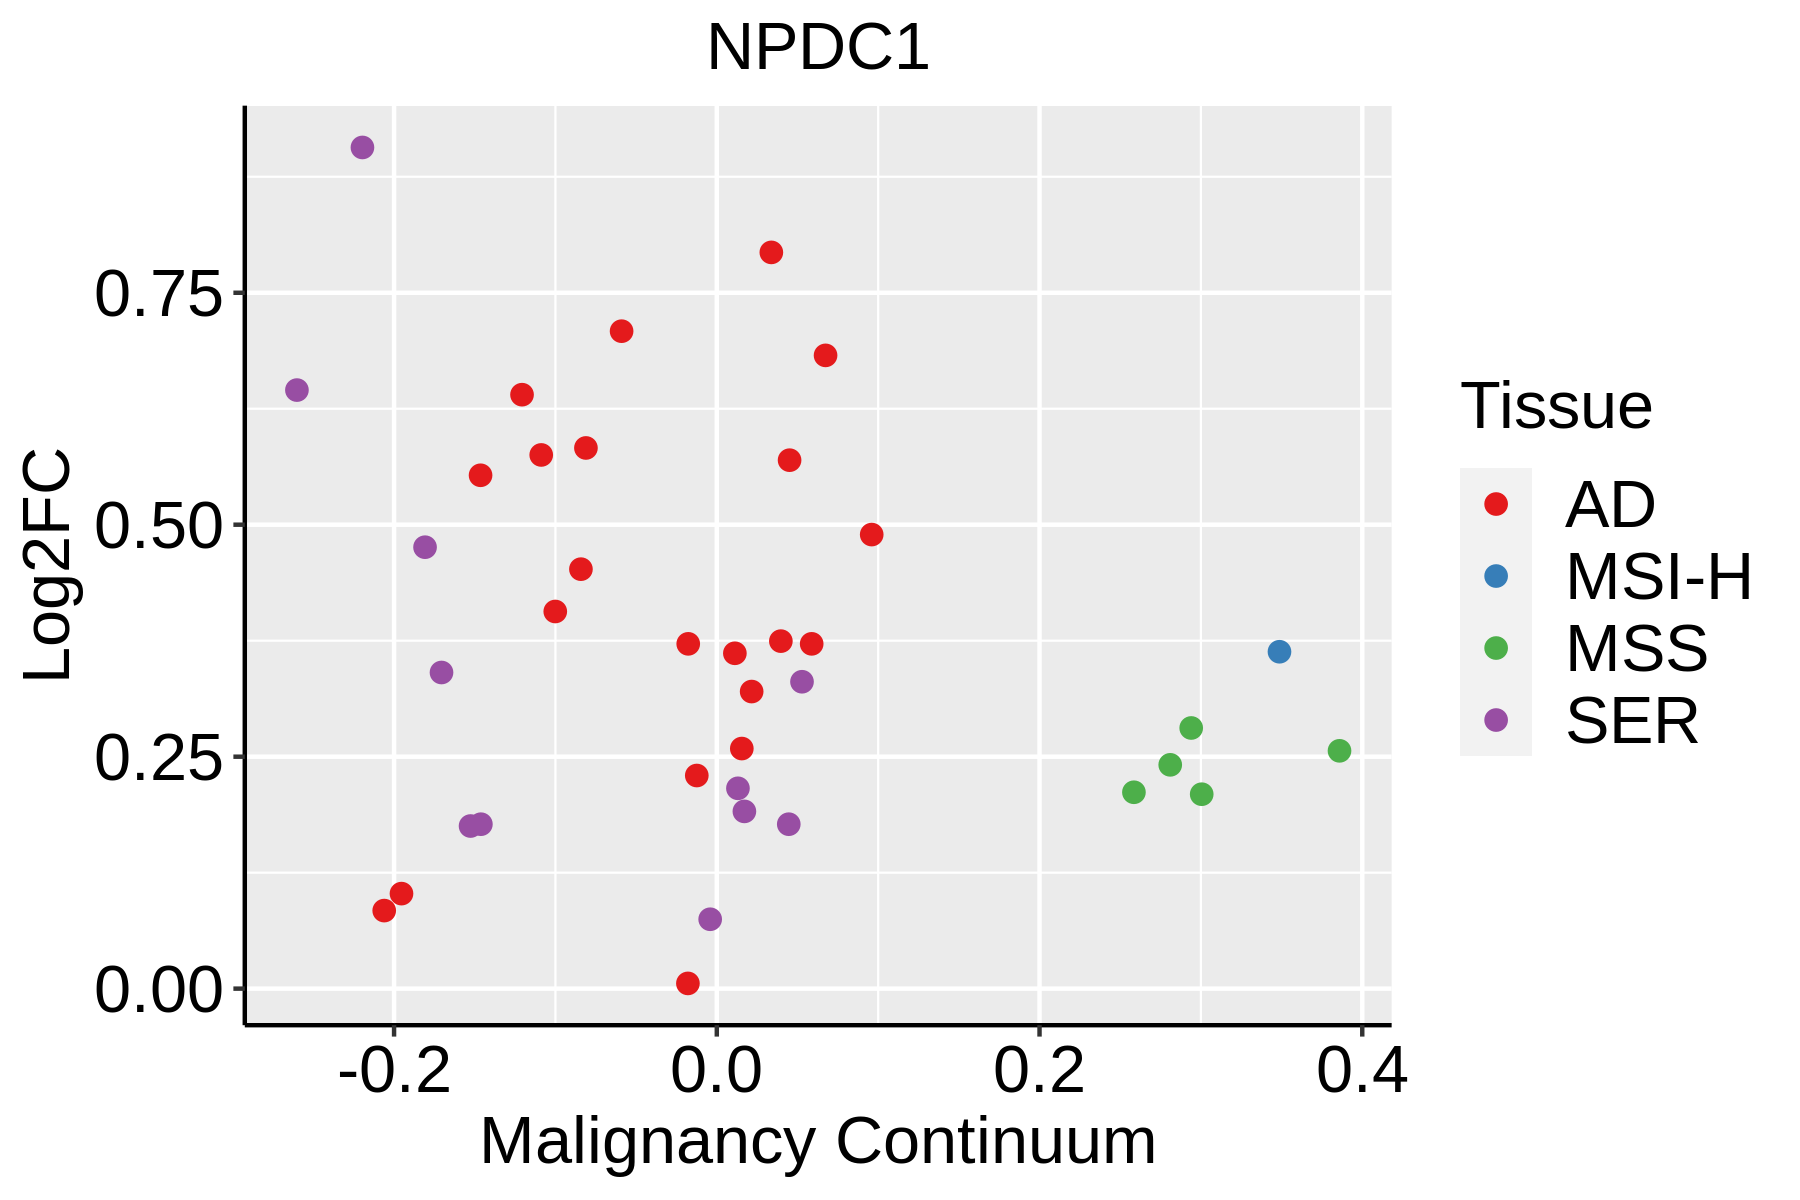 | AD: Adenomas |
| SER: Sessile serrated lesions | ||
| MSI-H: Microsatellite-high colorectal cancer | ||
| MSS: Microsatellite stable colorectal cancer | ||
| Endometrium | 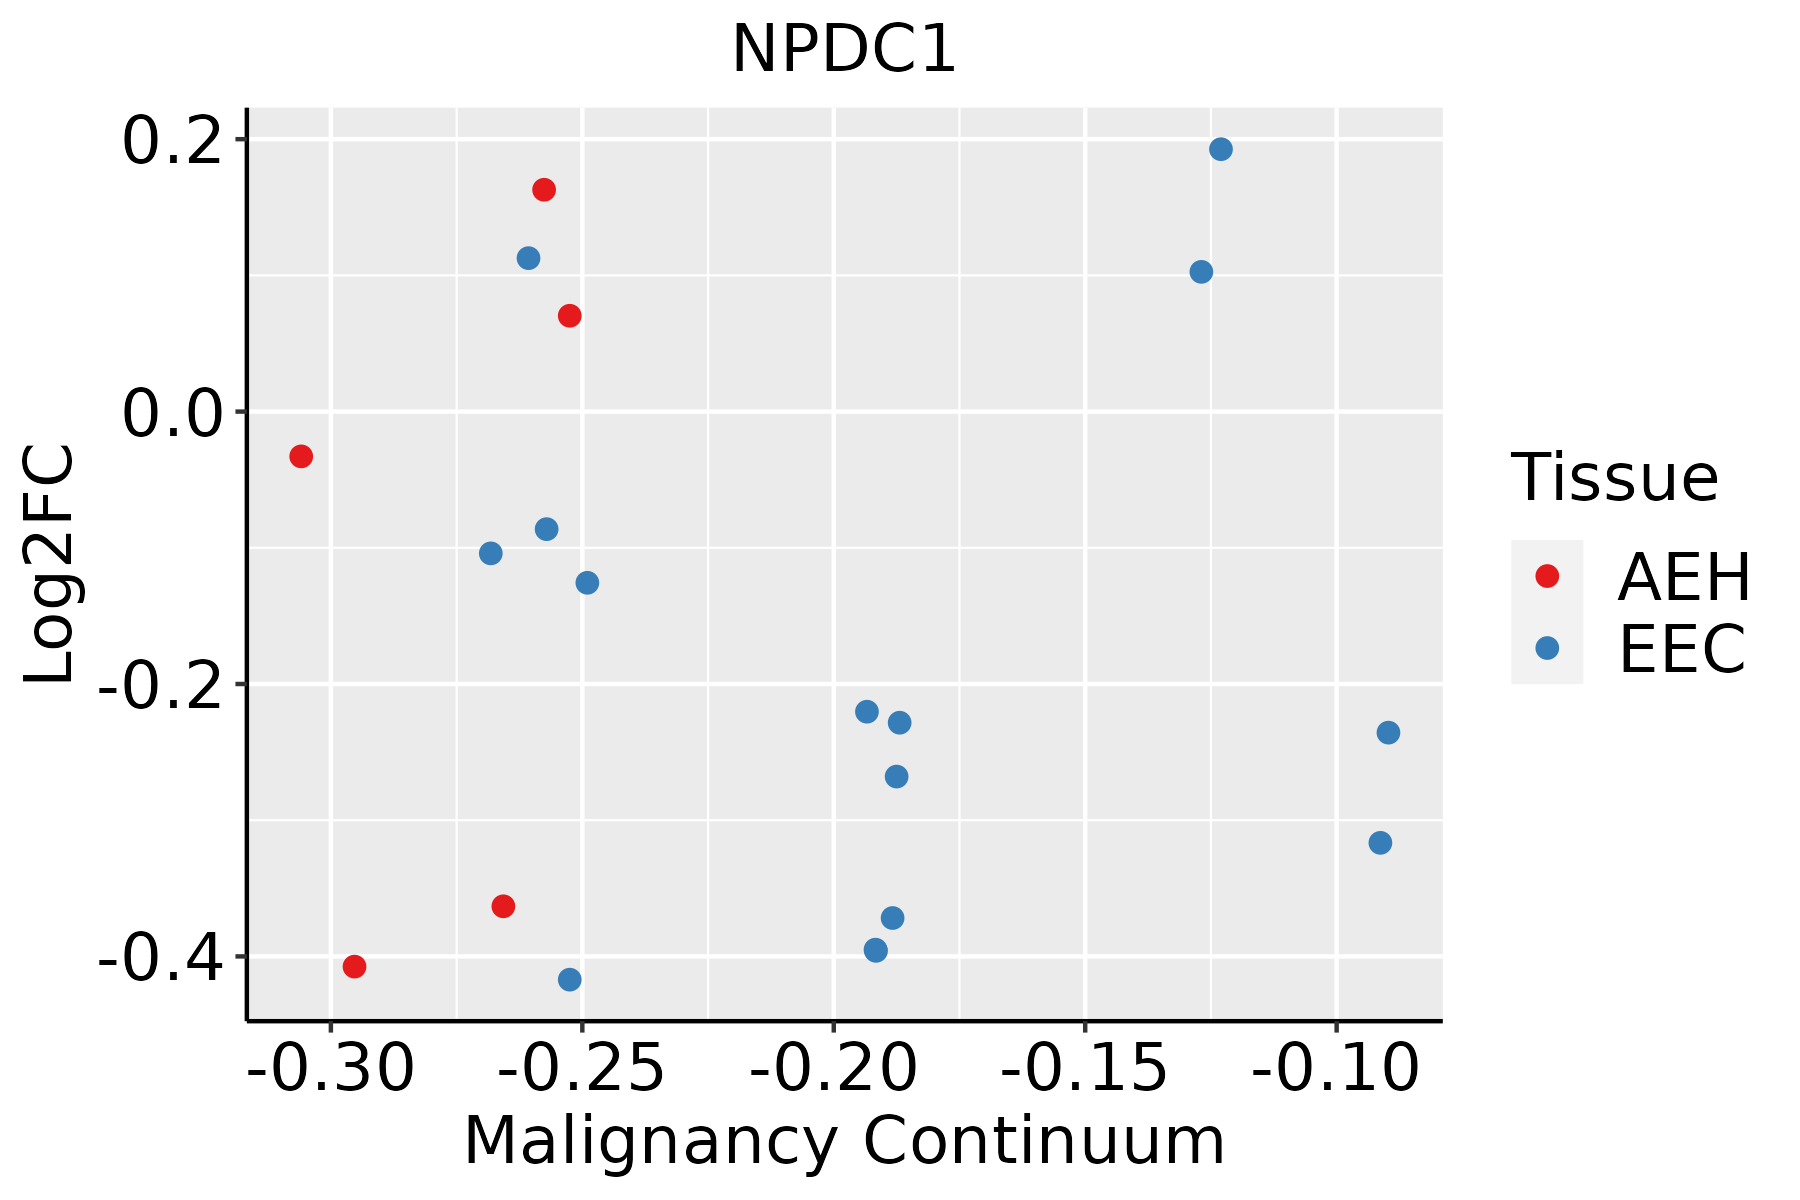 | AEH: Atypical endometrial hyperplasia |
| EEC: Endometrioid Cancer | ||
| Esophagus | 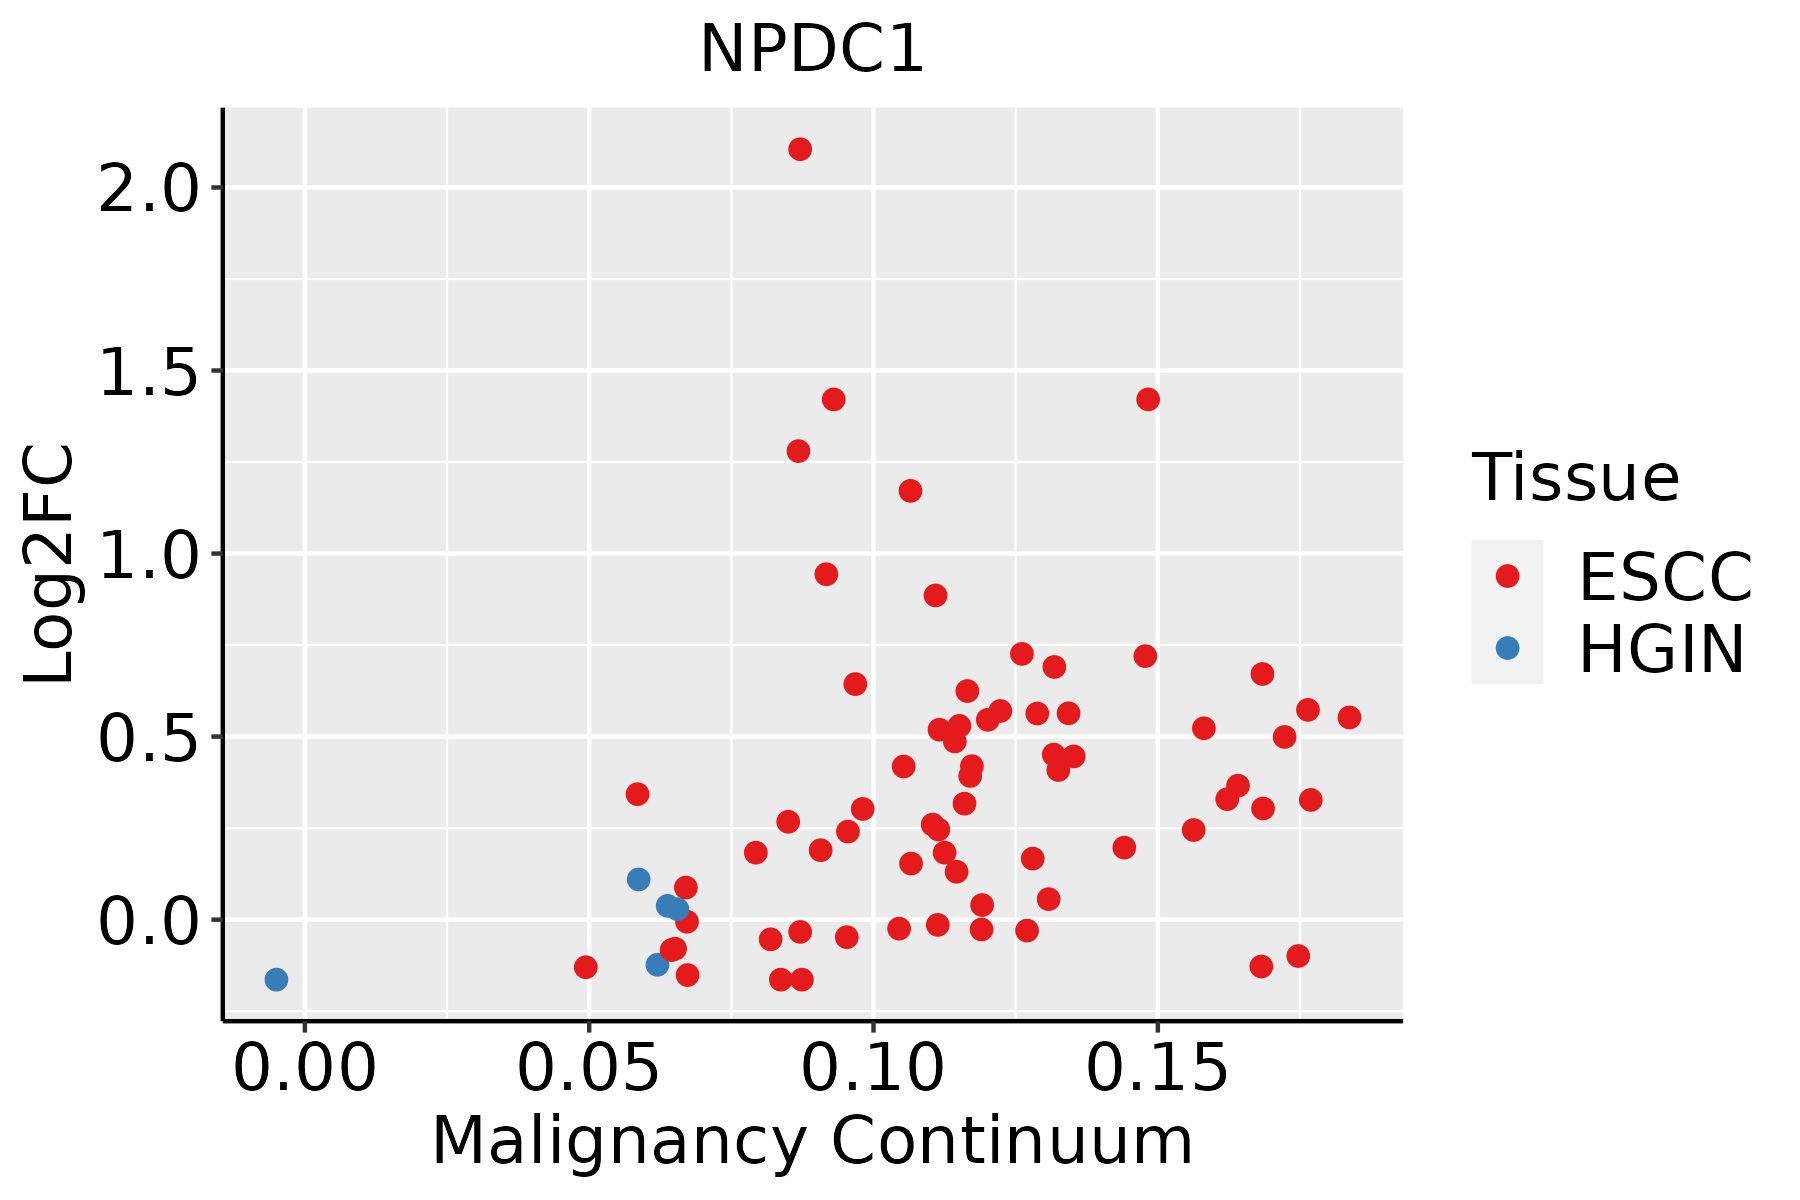 | ESCC: Esophageal squamous cell carcinoma |
| HGIN: High-grade intraepithelial neoplasias | ||
| LGIN: Low-grade intraepithelial neoplasias | ||
| GC | 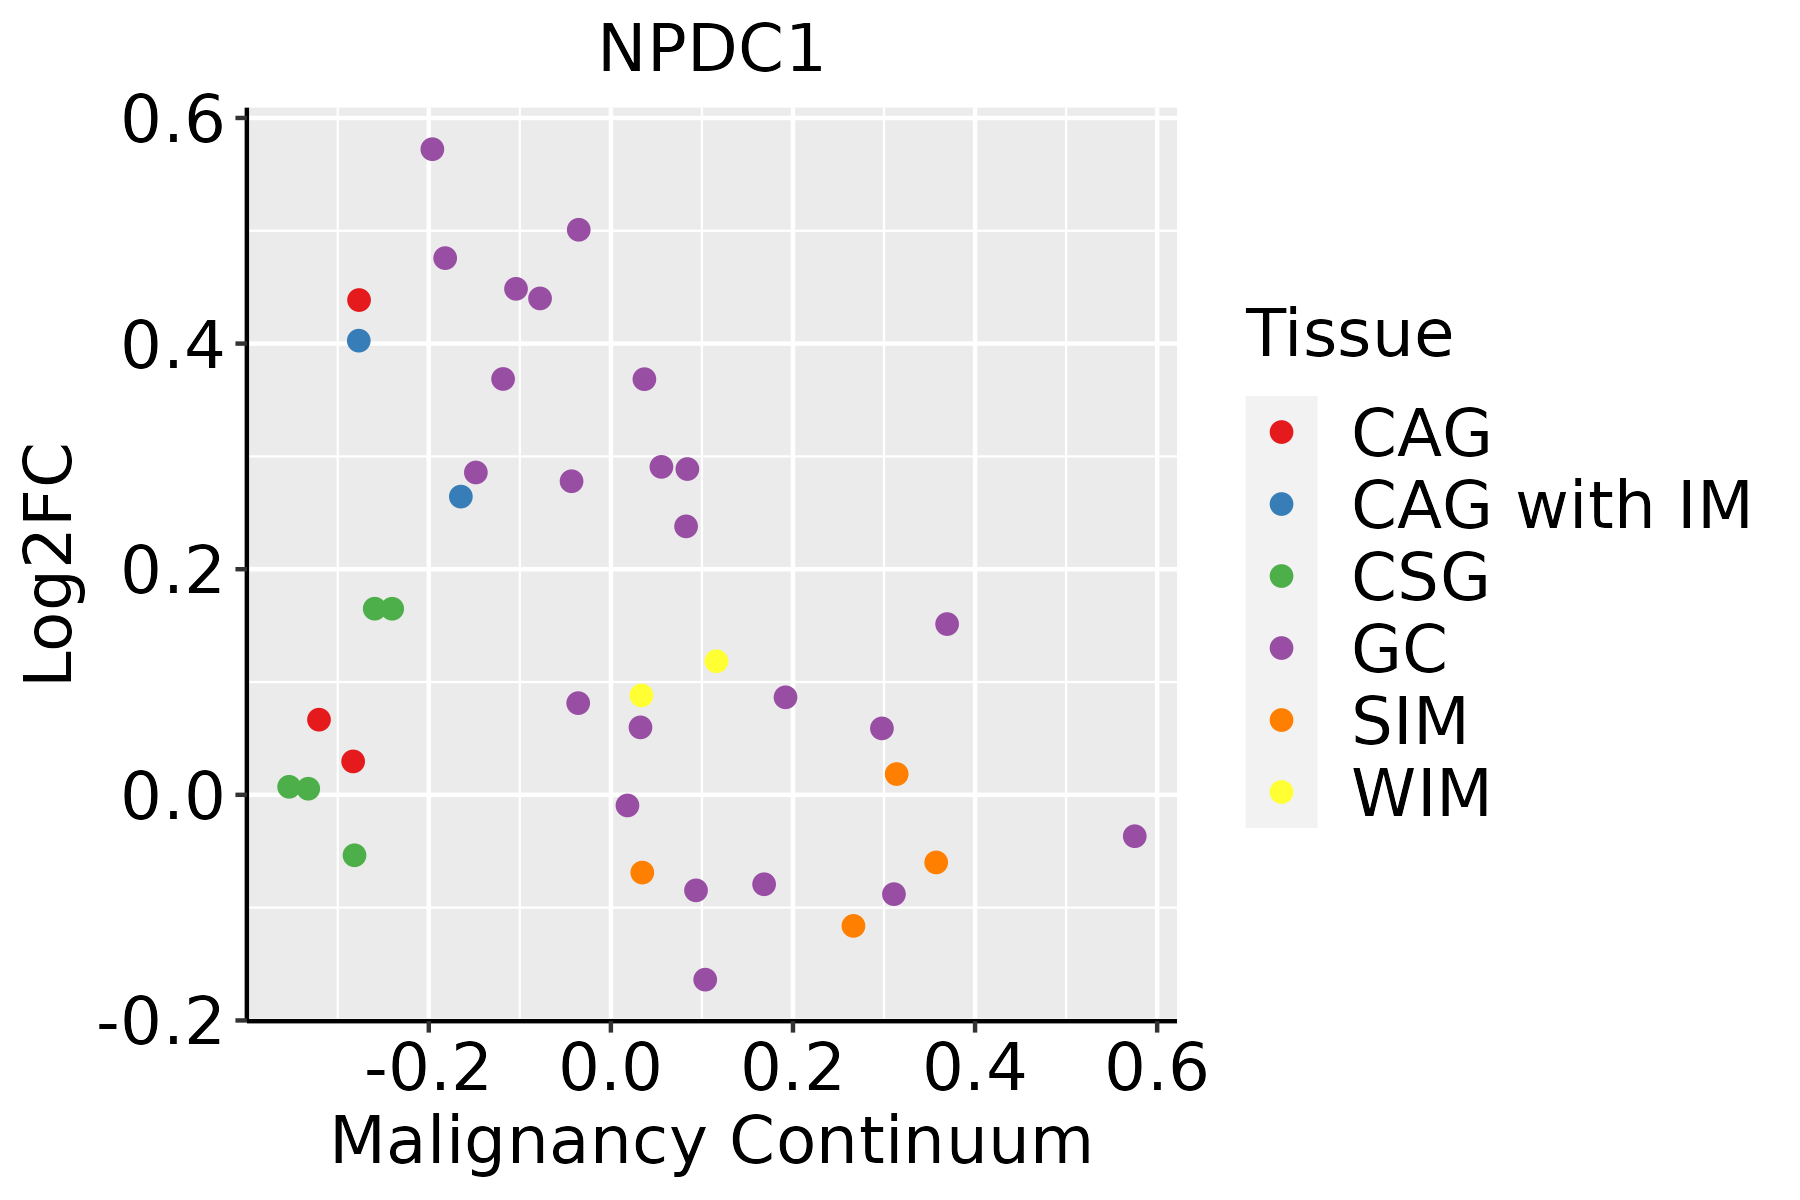 | CAG: Chronic atrophic gastritis |
| CAG with IM: Chronic atrophic gastritis with intestinal metaplasia | ||
| CSG: Chronic superficial gastritis | ||
| GC: Gastric cancer | ||
| SIM: Severe intestinal metaplasia | ||
| WIM: Wild intestinal metaplasia | ||
| Oral Cavity | 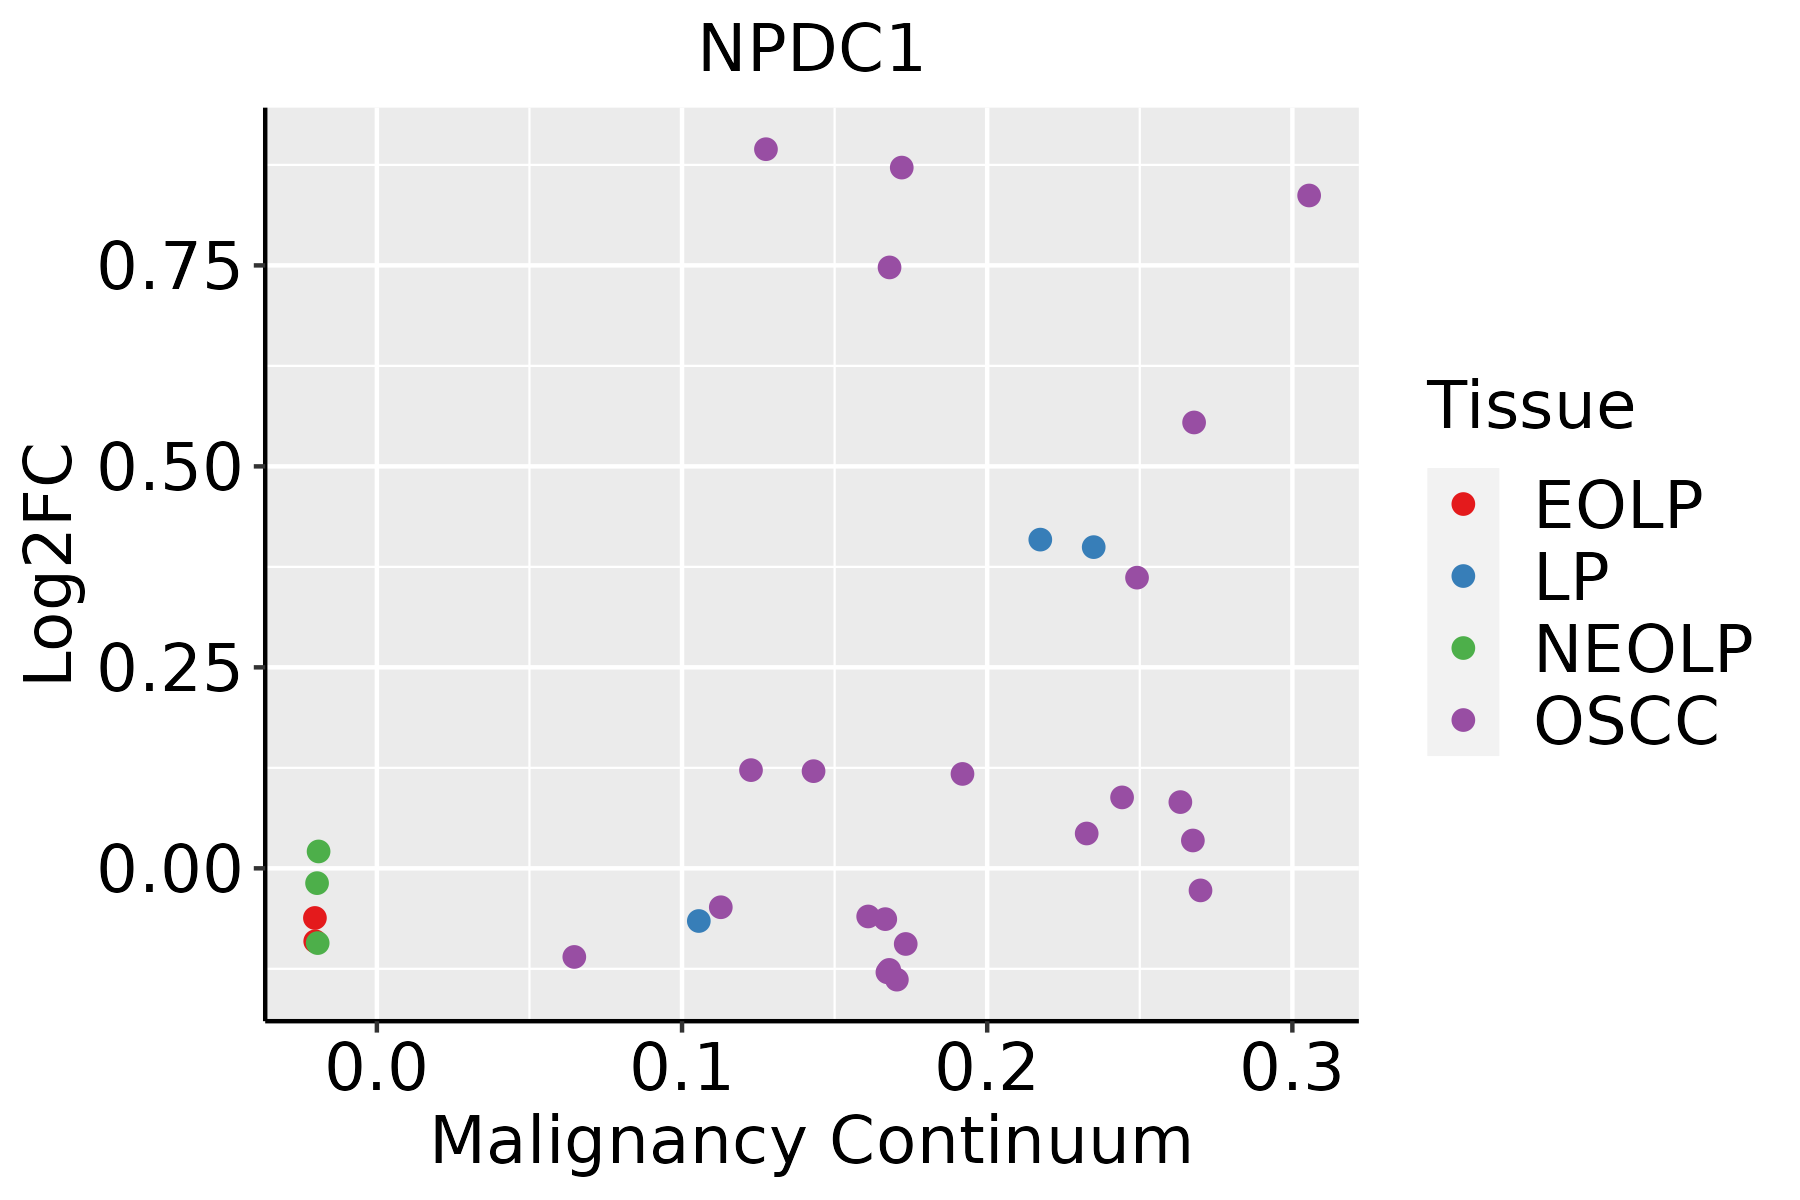 | EOLP: Erosive Oral lichen planus |
| LP: leukoplakia | ||
| NEOLP: Non-erosive oral lichen planus | ||
| OSCC: Oral squamous cell carcinoma | ||
| Prostate |  | BPH: Benign Prostatic Hyperplasia |
| Thyroid | 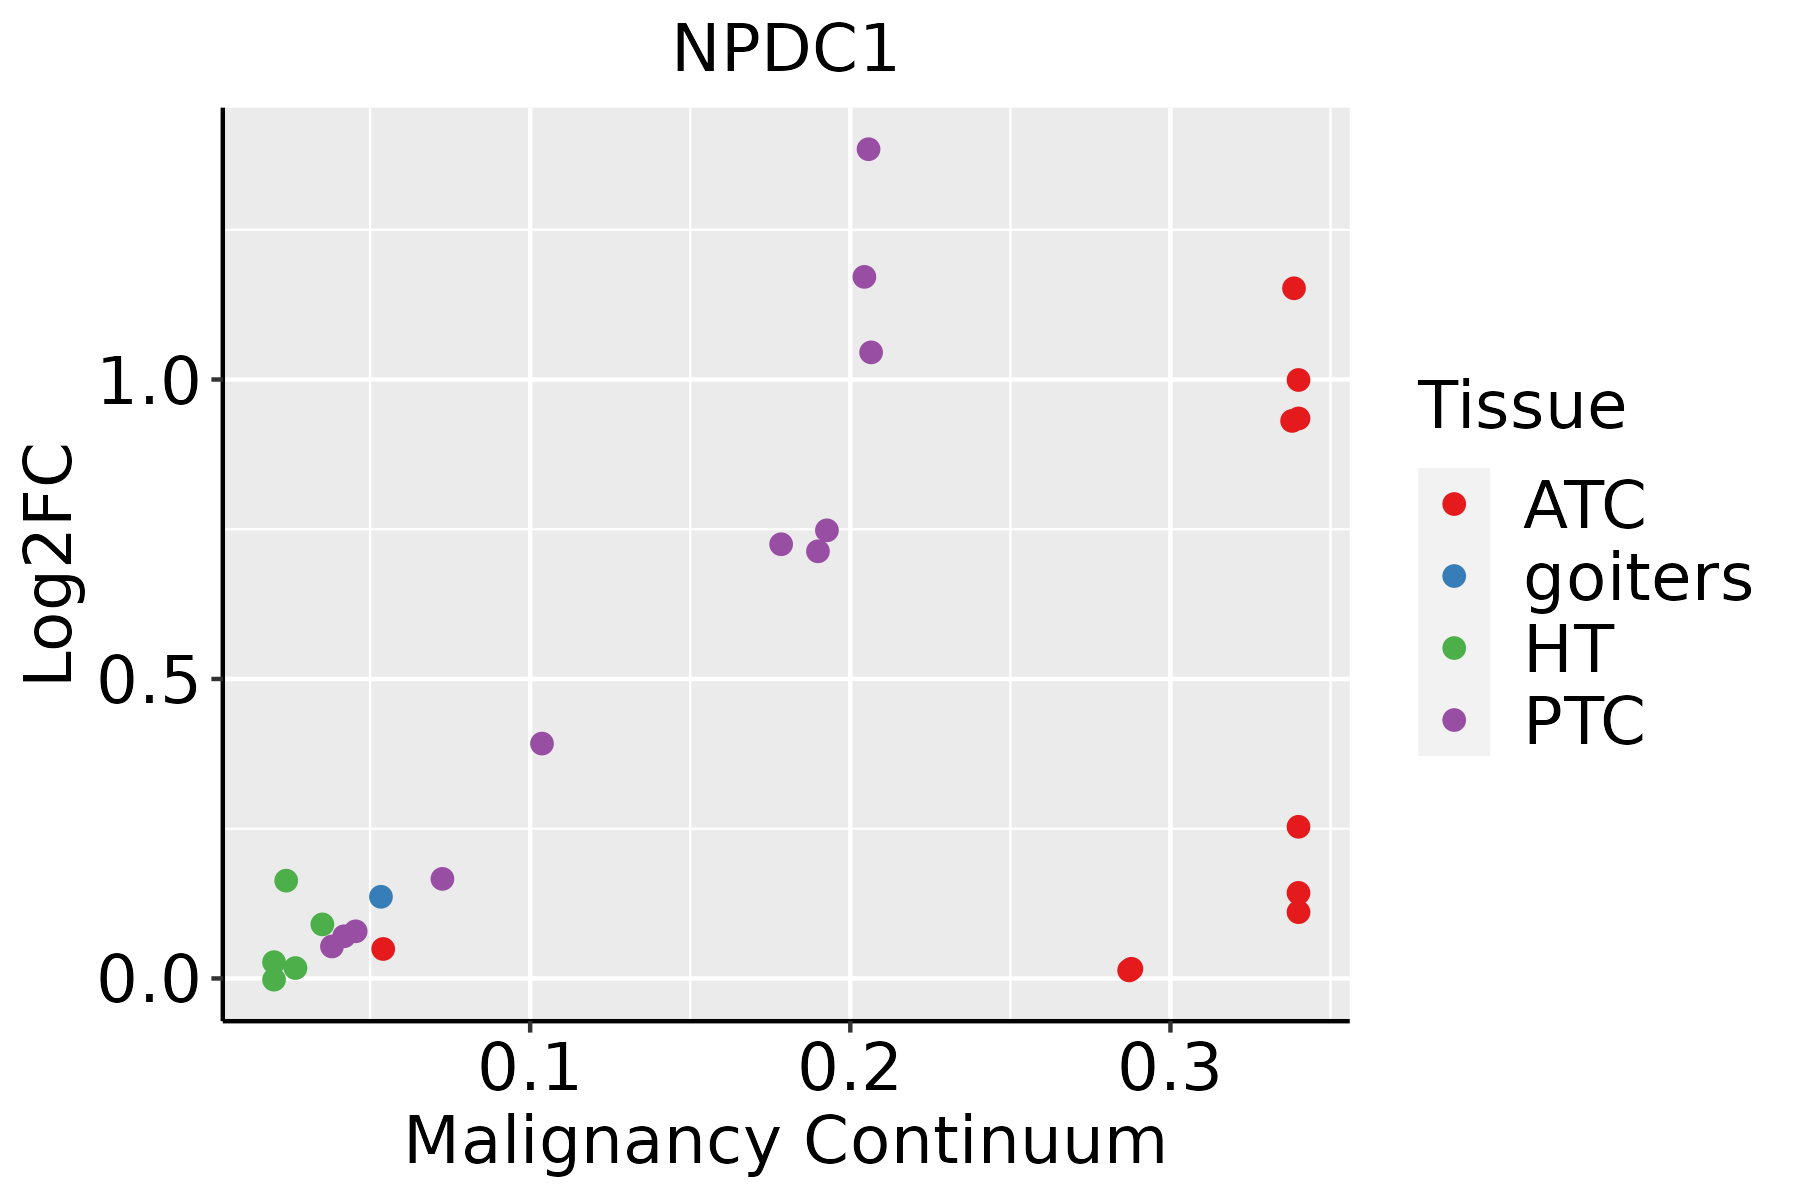 | ATC: Anaplastic thyroid cancer |
| HT: Hashimoto's thyroiditis | ||
| PTC: Papillary thyroid cancer |
| ∗log2FC in expression of this searched gene in stem-like cells from each diseased tissue sample relative to stem-like cells in normal samples in each tissue plotted against the malignancy continuum. Samples are colored based on if they are from different disease stage. |
Top |
Malignant transformation related pathway analysis |
| Find out the enriched GO biological processes and KEGG pathways involved in transition from healthy to precancer to cancer |
| Tissue | Disease Stage | Enriched GO biological Processes |
| Colorectum | AD |  |
| Colorectum | SER |  |
| Colorectum | MSS |  |
| Colorectum | MSI-H |  |
| Colorectum | FAP |  |
| ∗Top 15 enriched GO BP terms are showed in the bar plot of each disease state in each tissue. Each row represents a significant GO biological process which is colored according to the -log10(p.adjust). |
| Page: 1 2 3 4 5 6 7 8 9 |
| GO ID | Tissue | Disease Stage | Description | Gene Ratio | Bg Ratio | pvalue | p.adjust | Count |
| Page: 1 |
| Pathway ID | Tissue | Disease Stage | Description | Gene Ratio | Bg Ratio | pvalue | p.adjust | qvalue | Count |
| Page: 1 |
Top |
Cell-cell communication analysis |
| Identification of potential cell-cell interactions between two cell types and their ligand-receptor pairs for different disease states |
| Ligand | Receptor | LRpair | Pathway | Tissue | Disease Stage |
| Page: 1 |
Top |
Single-cell gene regulatory network inference analysis |
| Find out the significant the regulons (TFs) and the target genes of each regulon across cell types for different disease states |
| TF | Cell Type | Tissue | Disease Stage | Target Gene | RSS | Regulon Activity |
| NPDC1 | KER | Cervix | ADJ | AQP1,TSPAN1,CYSTM1, etc. | 0.00e+00 |  |
| NPDC1 | COL | Cervix | ADJ | AQP1,TSPAN1,CYSTM1, etc. | 0.00e+00 | |
| NPDC1 | KER | Cervix | HSIL_HPV | AQP1,TSPAN1,CYSTM1, etc. | 1.40e-01 |  |
| NPDC1 | M1MAC | Endometrium | ADJ | IGFBP7,DUSP23,SEPW1, etc. | 8.39e-02 |  |
| NPDC1 | M1MAC | Endometrium | AEH | IGFBP7,DUSP23,SEPW1, etc. | 3.83e-02 |  |
| NPDC1 | CD4TN | Endometrium | AEH | IGFBP7,DUSP23,SEPW1, etc. | 2.40e-03 | |
| NPDC1 | CD8TEFF | Endometrium | AEH | IGFBP7,DUSP23,SEPW1, etc. | 0.00e+00 | |
| NPDC1 | NKT | Endometrium | EEC | IGFBP7,DUSP23,SEPW1, etc. | 0.00e+00 |  |
| NPDC1 | GOB | Esophagus | Healthy | CLDN10,KDELR3,SSR4, etc. | 1.97e-01 |  |
| NPDC1 | BN | Lung | AIS | LTB,APOLD1,VMO1, etc. | 1.14e-01 |  |
| ∗The dot plots of a searched regulon are shown for all cell subpopulations in each disease state of each tissue based on the regulon specific score inferred using pySCENIC and by calculating the average expression. |
| Page: 1 2 3 |
Top |
Somatic mutation of malignant transformation related genes |
| Annotation of somatic variants for genes involved in malignant transformation |
| Hugo Symbol | Variant Class | Variant Classification | dbSNP RS | HGVSc | HGVSp | HGVSp Short | SWISSPROT | BIOTYPE | SIFT | PolyPhen | Tumor Sample Barcode | Tissue | Histology | Sex | Age | Stage | Therapy Types | Drugs | Outcome |
| NPDC1 | SNV | Missense_Mutation | c.334N>A | p.Gly112Arg | p.G112R | Q9NQX5 | protein_coding | tolerated(0.48) | benign(0.213) | TCGA-A7-A0DA-01 | Breast | breast invasive carcinoma | Female | <65 | I/II | Chemotherapy | adriamycin | SD | |
| NPDC1 | SNV | Missense_Mutation | c.265N>A | p.Gly89Ser | p.G89S | Q9NQX5 | protein_coding | tolerated(0.82) | benign(0.054) | TCGA-BH-A0AV-01 | Breast | breast invasive carcinoma | Female | <65 | I/II | Chemotherapy | taxotere | CR | |
| NPDC1 | SNV | Missense_Mutation | c.832G>C | p.Glu278Gln | p.E278Q | Q9NQX5 | protein_coding | deleterious(0) | probably_damaging(0.911) | TCGA-E2-A159-01 | Breast | breast invasive carcinoma | Female | <65 | I/II | Chemotherapy | cyclophosphamide | SD | |
| NPDC1 | insertion | Frame_Shift_Ins | novel | c.350_351insAAGA | p.Leu118ArgfsTer96 | p.L118Rfs*96 | Q9NQX5 | protein_coding | TCGA-DS-A1OB-01 | Cervix | cervical & endocervical cancer | Female | <65 | I/II | Chemotherapy | carboplatin | PD | ||
| NPDC1 | SNV | Missense_Mutation | rs778983633 | c.407G>A | p.Arg136Gln | p.R136Q | Q9NQX5 | protein_coding | tolerated(0.23) | benign(0.006) | TCGA-A6-2686-01 | Colorectum | colon adenocarcinoma | Female | >=65 | I/II | Unknown | Unknown | SD |
| NPDC1 | SNV | Missense_Mutation | rs564238459 | c.406C>T | p.Arg136Trp | p.R136W | Q9NQX5 | protein_coding | tolerated(0.13) | benign(0.003) | TCGA-AA-3713-01 | Colorectum | colon adenocarcinoma | Male | >=65 | III/IV | Chemotherapy | 5-fluorouracil | PR |
| NPDC1 | SNV | Missense_Mutation | novel | c.141N>A | p.Asp47Glu | p.D47E | Q9NQX5 | protein_coding | tolerated(0.1) | benign(0.207) | TCGA-A5-A1OF-01 | Endometrium | uterine corpus endometrioid carcinoma | Female | <65 | I/II | Unknown | Unknown | SD |
| NPDC1 | SNV | Missense_Mutation | rs751469138 | c.445N>A | p.Gly149Arg | p.G149R | Q9NQX5 | protein_coding | deleterious(0.05) | probably_damaging(0.929) | TCGA-A5-A2K7-01 | Endometrium | uterine corpus endometrioid carcinoma | Female | <65 | I/II | Chemotherapy | taxol | SD |
| NPDC1 | SNV | Missense_Mutation | rs780477037 | c.928G>A | p.Ala310Thr | p.A310T | Q9NQX5 | protein_coding | tolerated(0.54) | benign(0.001) | TCGA-D1-A103-01 | Endometrium | uterine corpus endometrioid carcinoma | Female | >=65 | I/II | Unknown | Unknown | SD |
| NPDC1 | SNV | Missense_Mutation | novel | c.742N>G | p.Met248Val | p.M248V | Q9NQX5 | protein_coding | deleterious(0.04) | benign(0.007) | TCGA-E6-A1LX-01 | Endometrium | uterine corpus endometrioid carcinoma | Female | <65 | I/II | Unknown | Unknown | SD |
| Page: 1 2 |
Top |
Related drugs of malignant transformation related genes |
| Identification of chemicals and drugs interact with genes involved in malignant transfromation |
| (DGIdb 4.0) |
| Entrez ID | Symbol | Category | Interaction Types | Drug Claim Name | Drug Name | PMIDs |
| Page: 1 |

Copyright 2023-Present -The University of Texas Health Science Center at Houston |