
|
|||||
|
 | |
| |
| |
| |
| |
| |
|
Gene: NPC1 |
Gene summary for NPC1 |
| Gene information | Species | Human | Gene symbol | NPC1 | Gene ID | 4864 |
| Gene name | NPC intracellular cholesterol transporter 1 | |
| Gene Alias | NPC | |
| Cytomap | 18q11.2 | |
| Gene Type | protein-coding | GO ID | GO:0006066 | UniProtAcc | O15118 |
Top |
Malignant transformation analysis |
| Identification of the aberrant gene expression in precancerous and cancerous lesions by comparing the gene expression of stem-like cells in diseased tissues with normal stem cells |
| Entrez ID | Symbol | Replicates | Species | Organ | Tissue | Adj P-value | Log2FC | Malignancy |
| 4864 | NPC1 | CCI_1 | Human | Cervix | CC | 6.98e-05 | 6.52e-01 | 0.528 |
| 4864 | NPC1 | CCI_2 | Human | Cervix | CC | 1.74e-04 | 5.18e-01 | 0.5249 |
| 4864 | NPC1 | CCI_3 | Human | Cervix | CC | 1.15e-12 | 7.60e-01 | 0.516 |
| 4864 | NPC1 | sample3 | Human | Cervix | CC | 2.50e-04 | 2.11e-01 | 0.1387 |
| 4864 | NPC1 | T3 | Human | Cervix | CC | 7.78e-03 | 2.15e-01 | 0.1389 |
| 4864 | NPC1 | LZE4T | Human | Esophagus | ESCC | 1.26e-08 | 1.47e-01 | 0.0811 |
| 4864 | NPC1 | LZE7T | Human | Esophagus | ESCC | 9.80e-04 | 3.38e-01 | 0.0667 |
| 4864 | NPC1 | LZE8T | Human | Esophagus | ESCC | 4.49e-02 | 4.33e-02 | 0.067 |
| 4864 | NPC1 | LZE20T | Human | Esophagus | ESCC | 2.26e-02 | 1.82e-02 | 0.0662 |
| 4864 | NPC1 | LZE24T | Human | Esophagus | ESCC | 2.22e-03 | 1.87e-01 | 0.0596 |
| 4864 | NPC1 | LZE6T | Human | Esophagus | ESCC | 4.80e-02 | 1.54e-02 | 0.0845 |
| 4864 | NPC1 | P1T-E | Human | Esophagus | ESCC | 2.98e-04 | 3.86e-01 | 0.0875 |
| 4864 | NPC1 | P2T-E | Human | Esophagus | ESCC | 7.76e-08 | 7.03e-02 | 0.1177 |
| 4864 | NPC1 | P4T-E | Human | Esophagus | ESCC | 2.29e-08 | 2.45e-01 | 0.1323 |
| 4864 | NPC1 | P5T-E | Human | Esophagus | ESCC | 3.04e-10 | 1.84e-01 | 0.1327 |
| 4864 | NPC1 | P8T-E | Human | Esophagus | ESCC | 3.97e-13 | 5.97e-02 | 0.0889 |
| 4864 | NPC1 | P9T-E | Human | Esophagus | ESCC | 6.85e-29 | 4.83e-01 | 0.1131 |
| 4864 | NPC1 | P10T-E | Human | Esophagus | ESCC | 4.07e-07 | 9.56e-02 | 0.116 |
| 4864 | NPC1 | P11T-E | Human | Esophagus | ESCC | 8.81e-03 | 1.56e-01 | 0.1426 |
| 4864 | NPC1 | P12T-E | Human | Esophagus | ESCC | 3.21e-13 | 1.98e-01 | 0.1122 |
| Page: 1 2 3 4 5 6 |
| Tissue | Expression Dynamics | Abbreviation |
| Cervix | 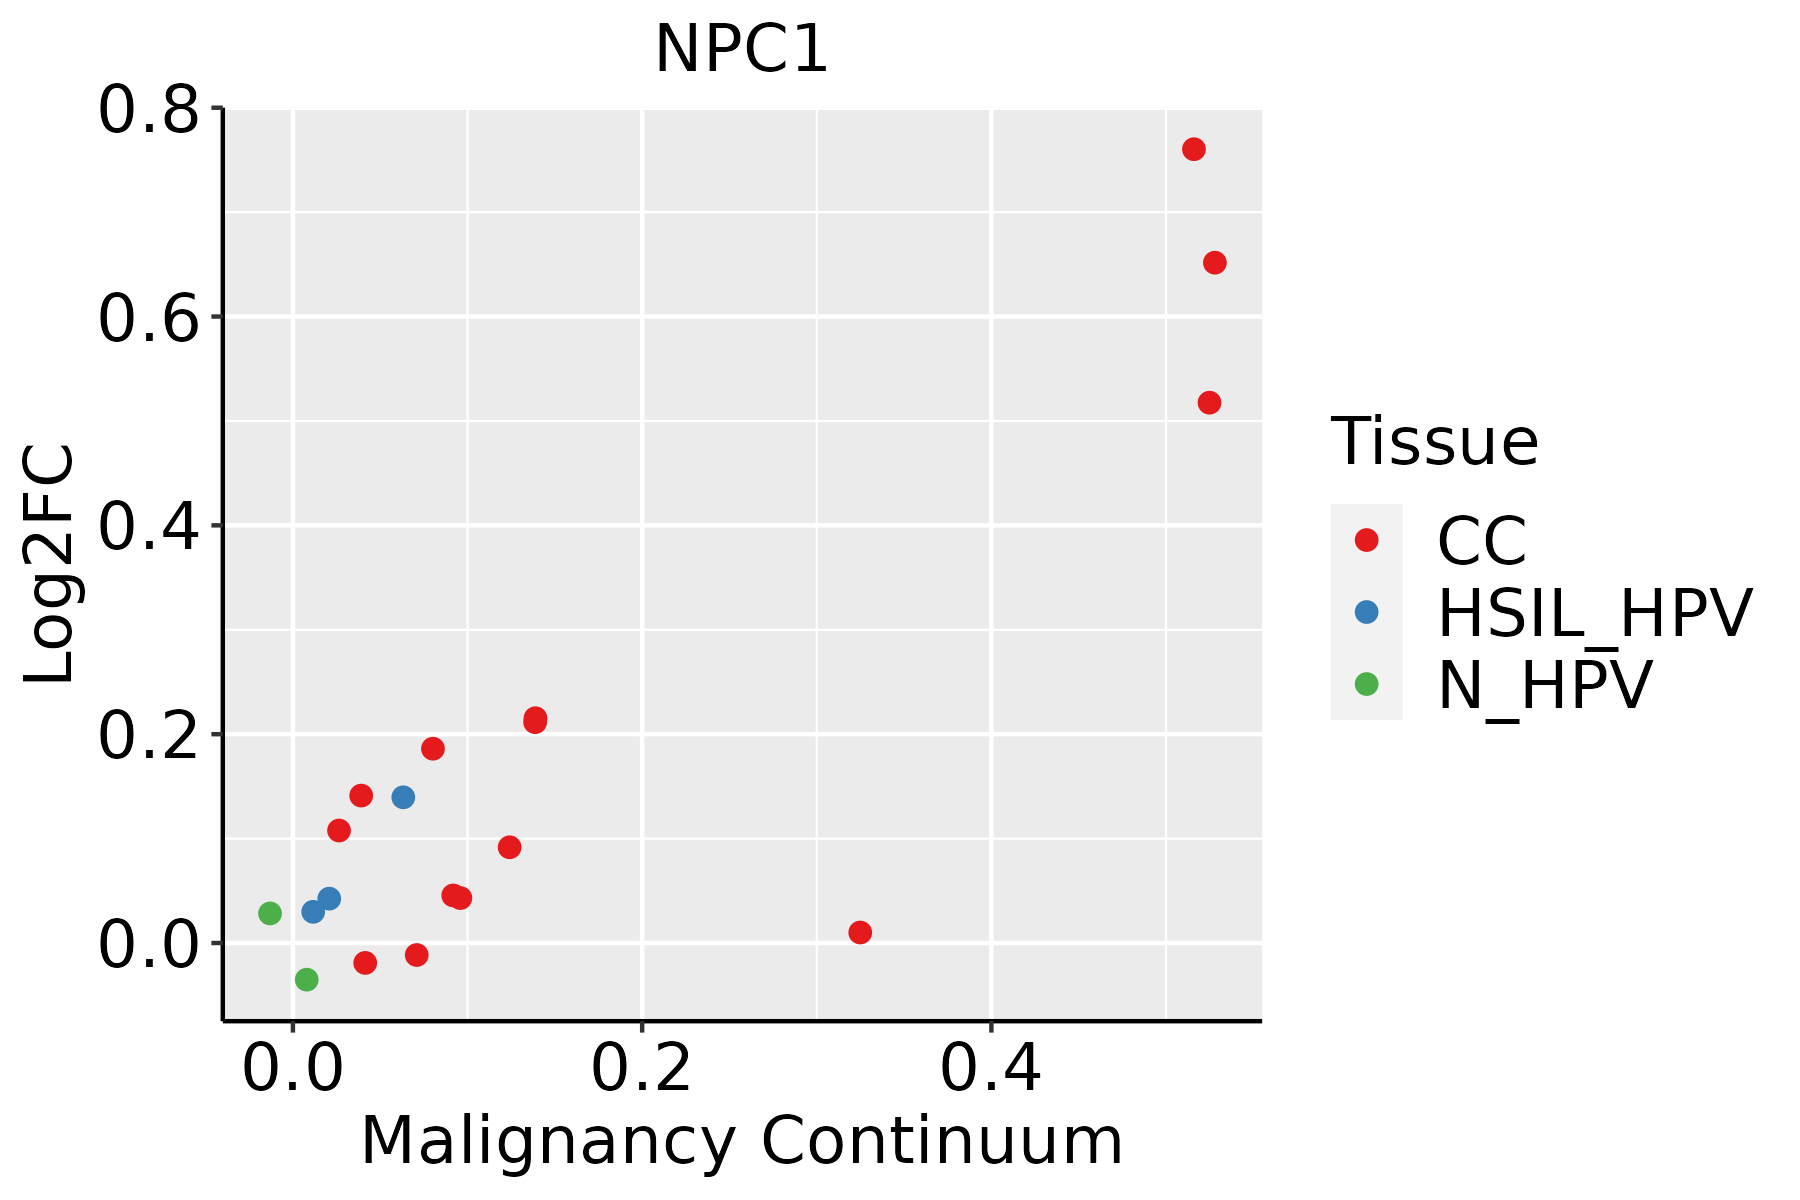 | CC: Cervix cancer |
| HSIL_HPV: HPV-infected high-grade squamous intraepithelial lesions | ||
| N_HPV: HPV-infected normal cervix | ||
| Esophagus |  | ESCC: Esophageal squamous cell carcinoma |
| HGIN: High-grade intraepithelial neoplasias | ||
| LGIN: Low-grade intraepithelial neoplasias | ||
| Liver | 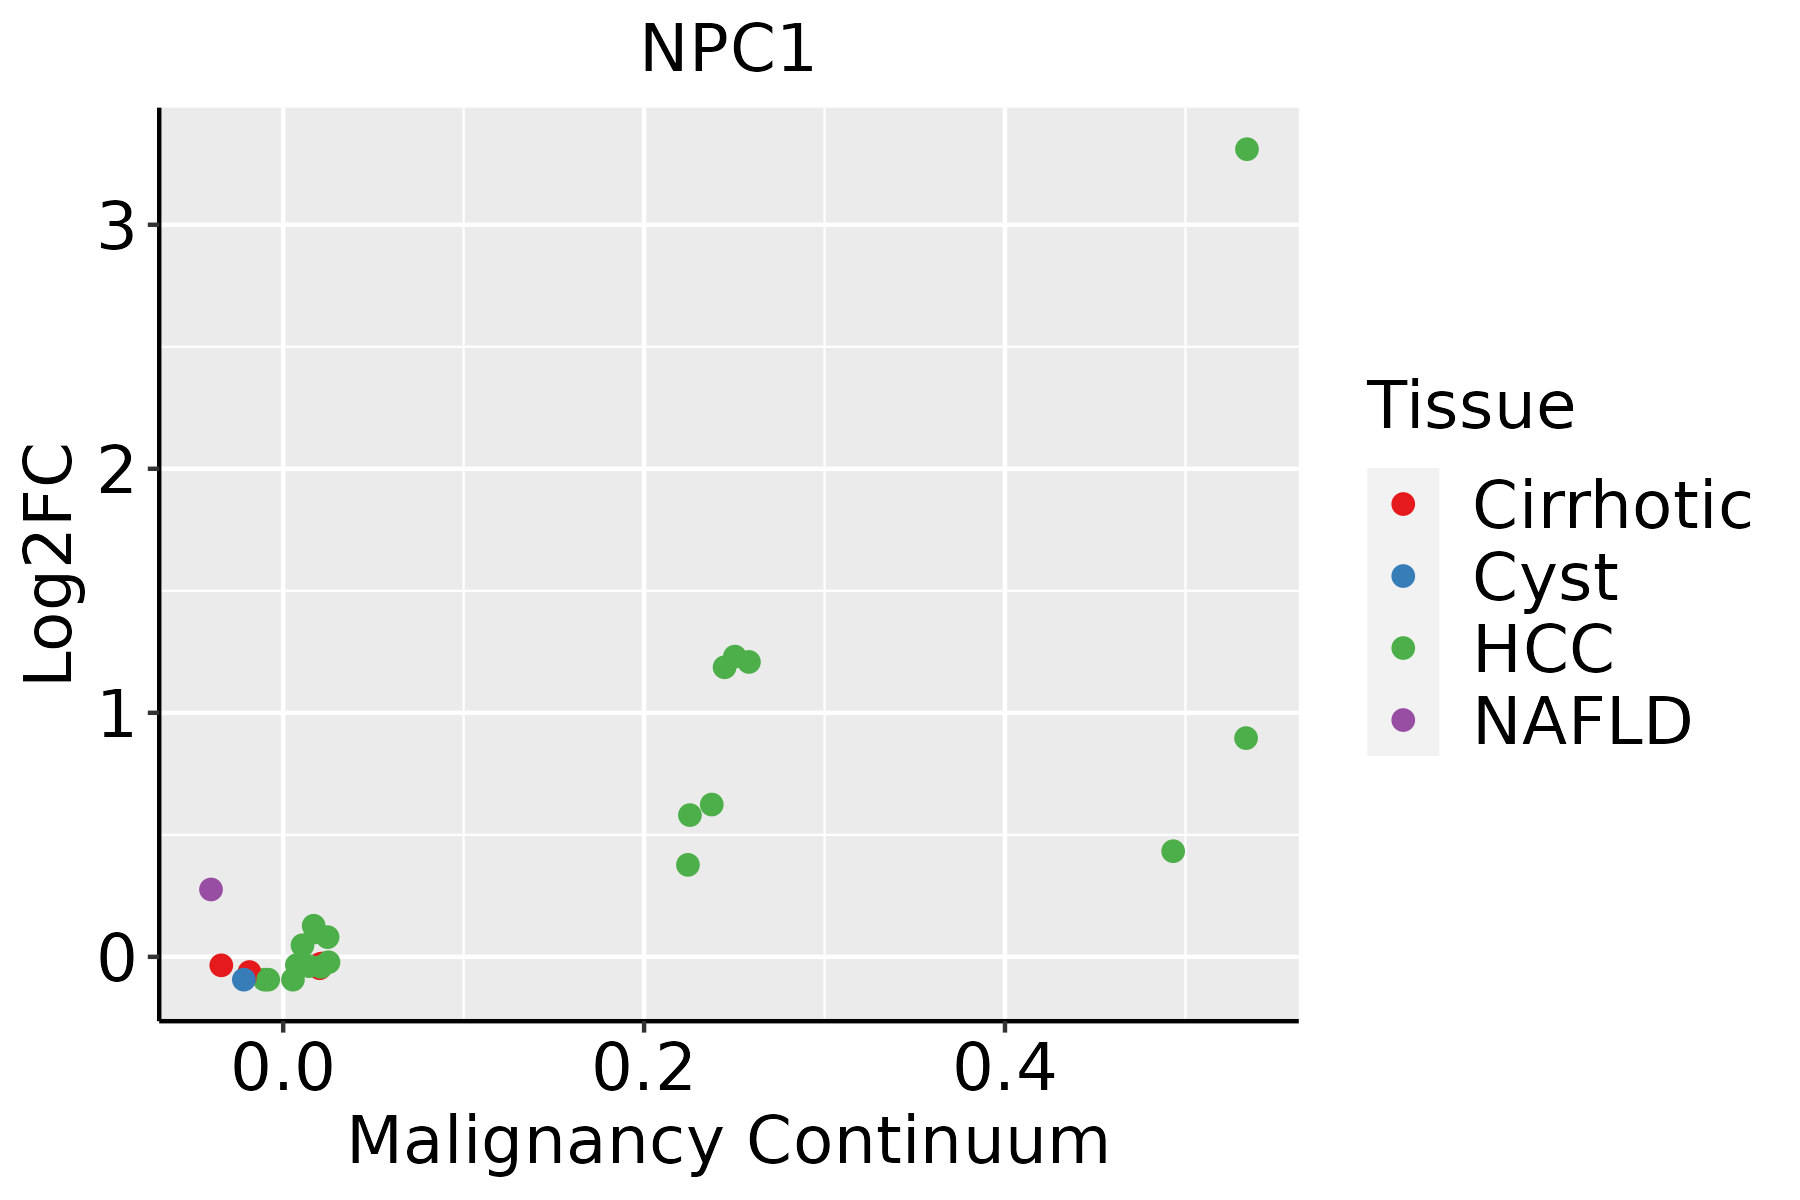 | HCC: Hepatocellular carcinoma |
| NAFLD: Non-alcoholic fatty liver disease | ||
| Lung |  | AAH: Atypical adenomatous hyperplasia |
| AIS: Adenocarcinoma in situ | ||
| IAC: Invasive lung adenocarcinoma | ||
| MIA: Minimally invasive adenocarcinoma | ||
| Prostate | 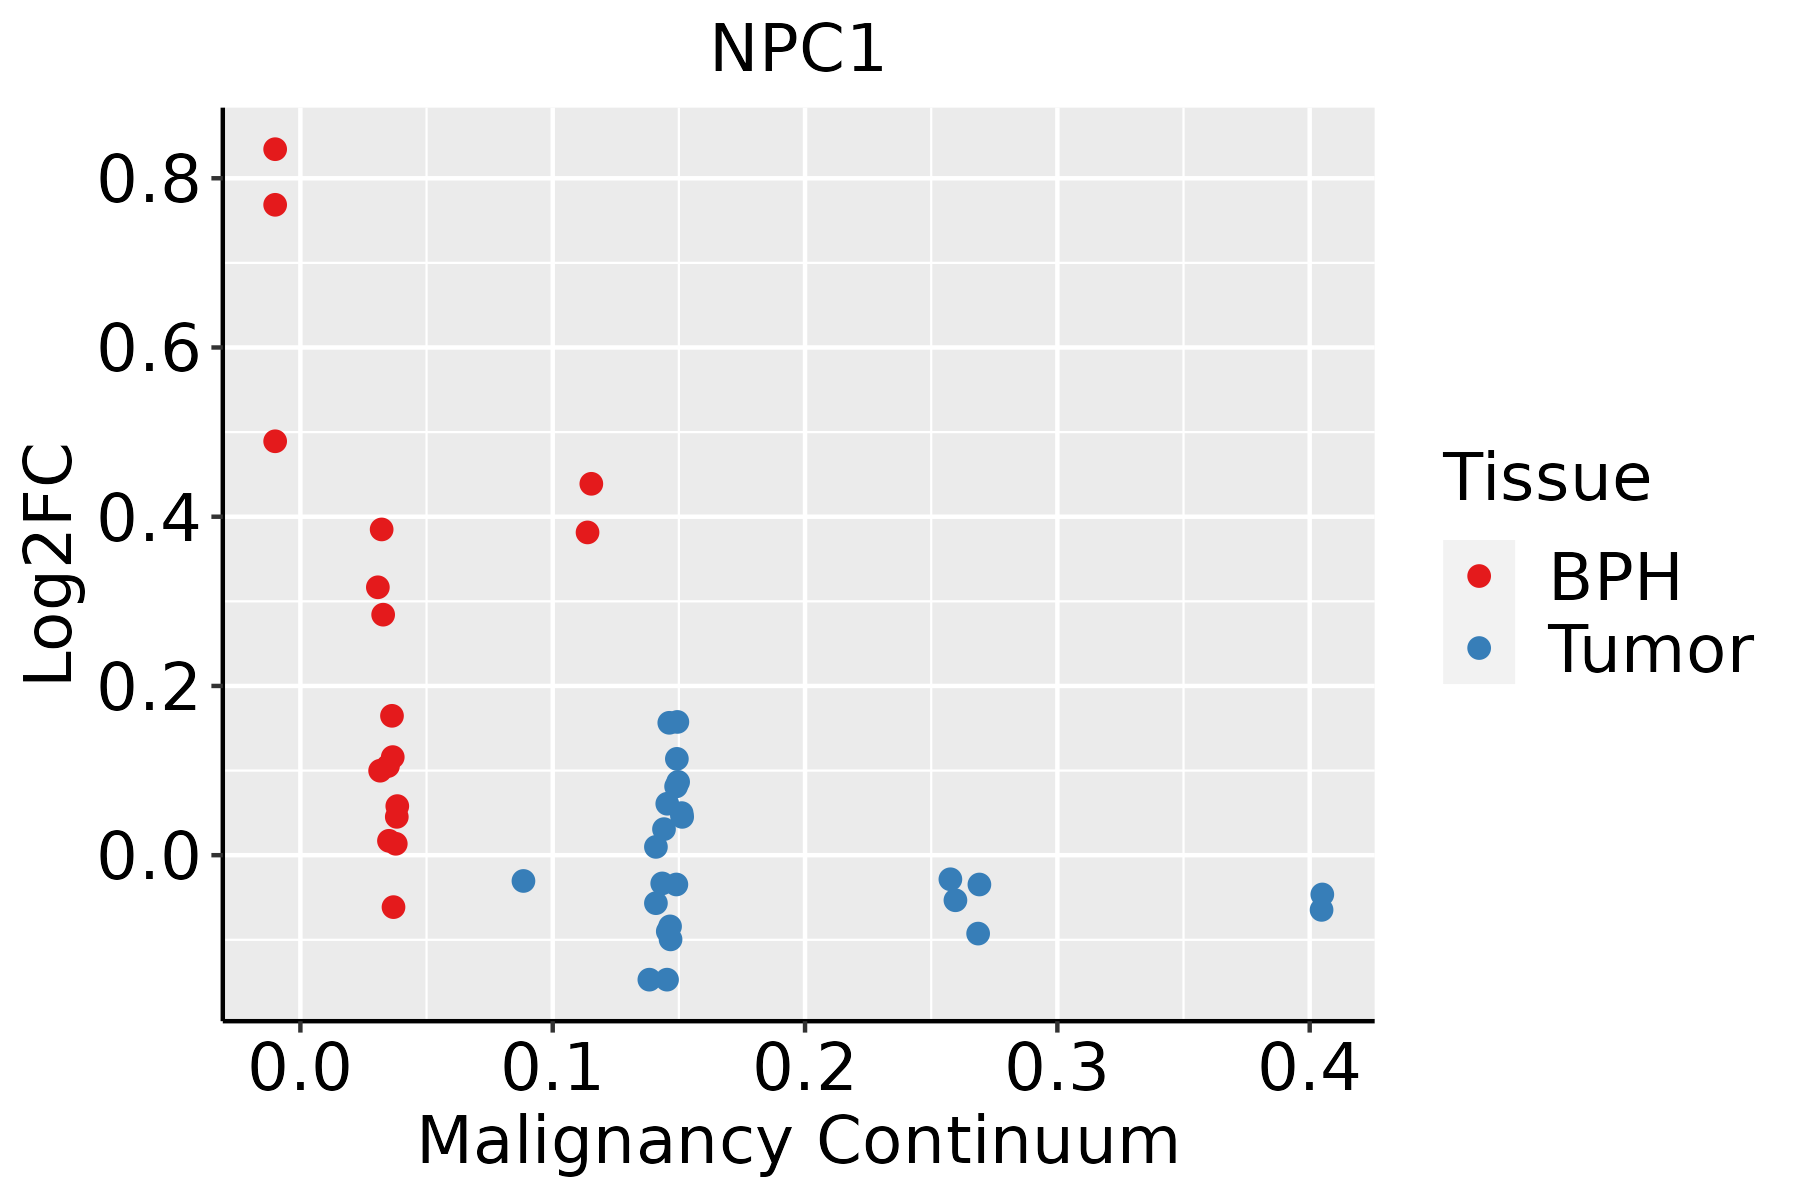 | BPH: Benign Prostatic Hyperplasia |
| Thyroid | 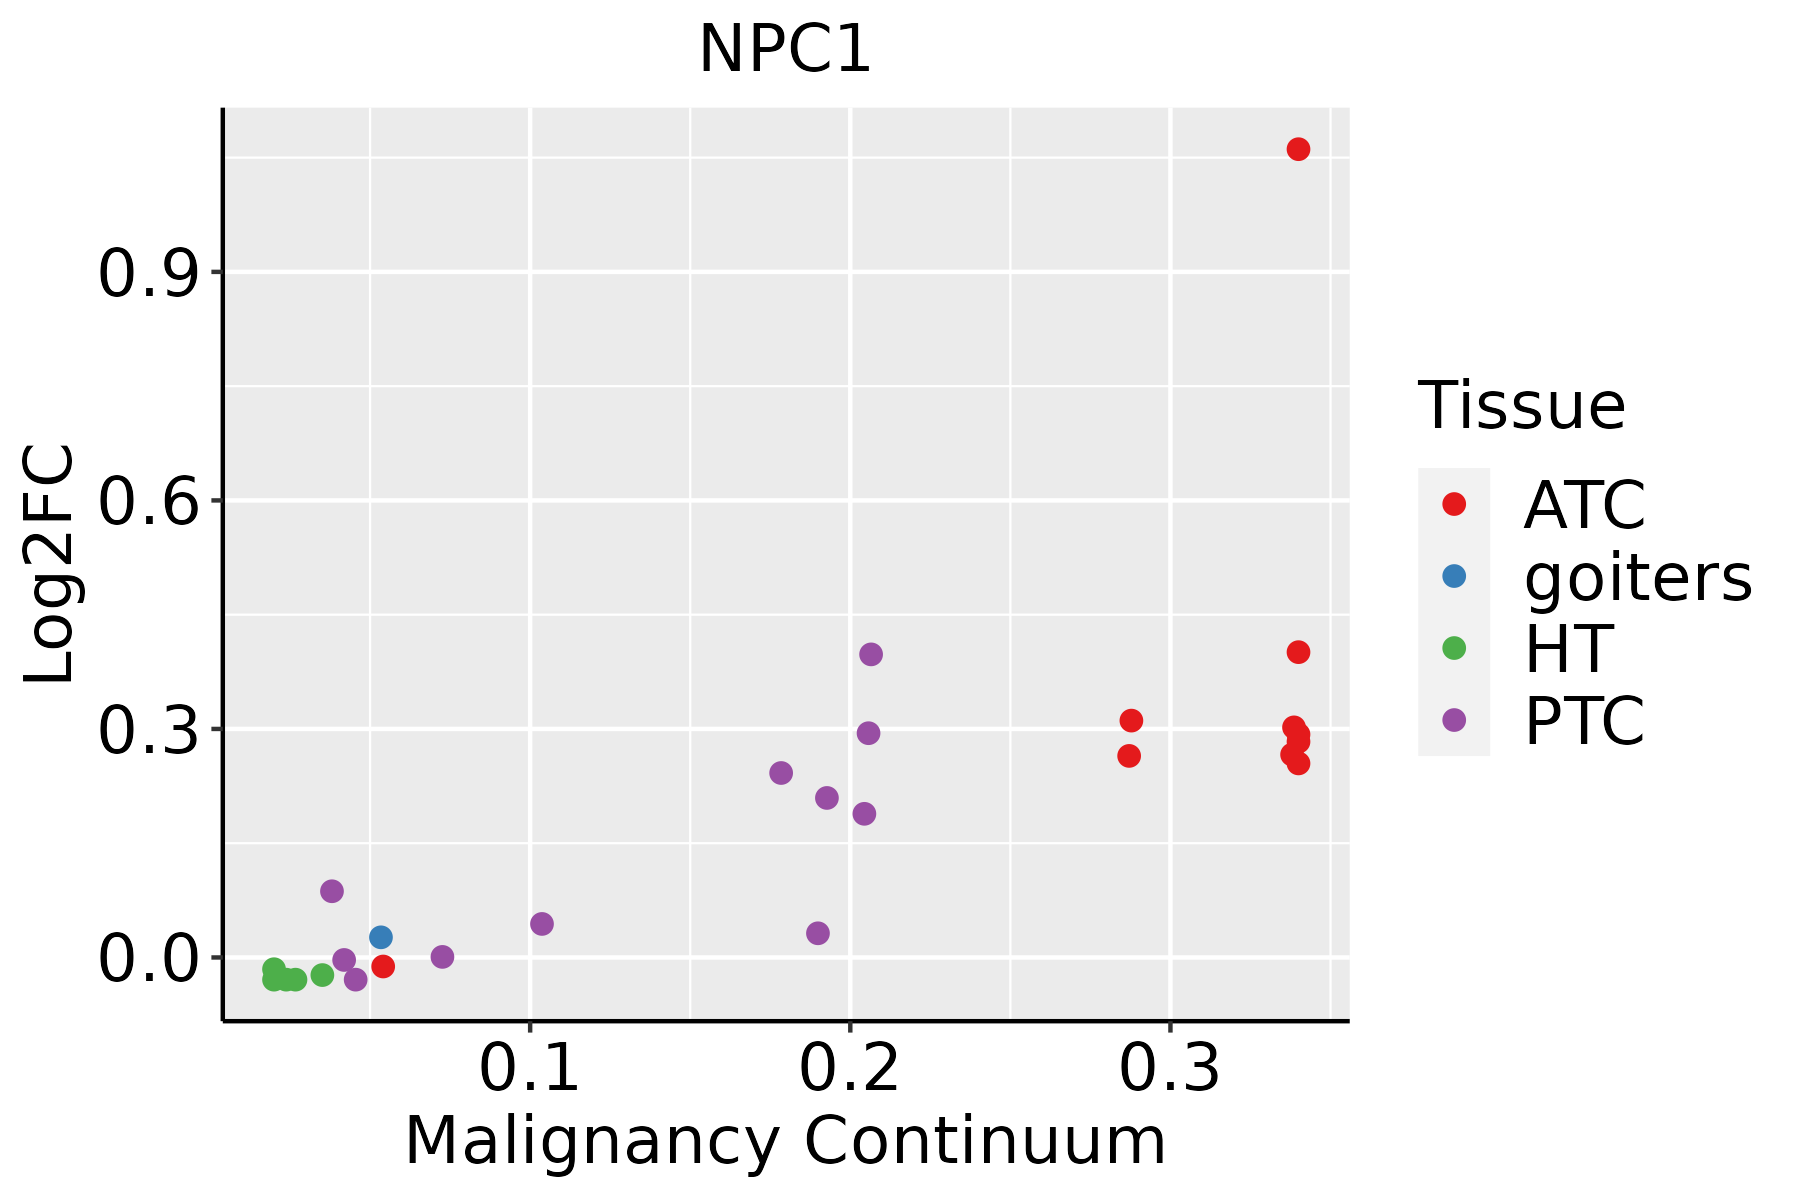 | ATC: Anaplastic thyroid cancer |
| HT: Hashimoto's thyroiditis | ||
| PTC: Papillary thyroid cancer |
| ∗log2FC in expression of this searched gene in stem-like cells from each diseased tissue sample relative to stem-like cells in normal samples in each tissue plotted against the malignancy continuum. Samples are colored based on if they are from different disease stage. |
Top |
Malignant transformation related pathway analysis |
| Find out the enriched GO biological processes and KEGG pathways involved in transition from healthy to precancer to cancer |
| Tissue | Disease Stage | Enriched GO biological Processes |
| Colorectum | AD |  |
| Colorectum | SER |  |
| Colorectum | MSS |  |
| Colorectum | MSI-H |  |
| Colorectum | FAP |  |
| ∗Top 15 enriched GO BP terms are showed in the bar plot of each disease state in each tissue. Each row represents a significant GO biological process which is colored according to the -log10(p.adjust). |
| Page: 1 2 3 4 5 6 7 8 9 |
| GO ID | Tissue | Disease Stage | Description | Gene Ratio | Bg Ratio | pvalue | p.adjust | Count |
| GO:001603210 | Cervix | CC | viral process | 109/2311 | 415/18723 | 5.40e-15 | 6.46e-12 | 109 |
| GO:001905810 | Cervix | CC | viral life cycle | 87/2311 | 317/18723 | 2.20e-13 | 1.20e-10 | 87 |
| GO:005212610 | Cervix | CC | movement in host environment | 52/2311 | 175/18723 | 7.03e-10 | 8.76e-08 | 52 |
| GO:004440910 | Cervix | CC | entry into host | 47/2311 | 151/18723 | 8.45e-10 | 1.03e-07 | 47 |
| GO:005170110 | Cervix | CC | biological process involved in interaction with host | 57/2311 | 203/18723 | 1.18e-09 | 1.41e-07 | 57 |
| GO:004671810 | Cervix | CC | viral entry into host cell | 44/2311 | 144/18723 | 5.47e-09 | 5.03e-07 | 44 |
| GO:004440310 | Cervix | CC | biological process involved in symbiotic interaction | 71/2311 | 290/18723 | 7.94e-09 | 6.98e-07 | 71 |
| GO:003133010 | Cervix | CC | negative regulation of cellular catabolic process | 63/2311 | 262/18723 | 1.10e-07 | 5.68e-06 | 63 |
| GO:004854510 | Cervix | CC | response to steroid hormone | 74/2311 | 339/18723 | 5.71e-07 | 2.09e-05 | 74 |
| GO:000989510 | Cervix | CC | negative regulation of catabolic process | 69/2311 | 320/18723 | 2.15e-06 | 6.55e-05 | 69 |
| GO:00901509 | Cervix | CC | establishment of protein localization to membrane | 54/2311 | 260/18723 | 7.67e-05 | 1.05e-03 | 54 |
| GO:00162367 | Cervix | CC | macroautophagy | 58/2311 | 291/18723 | 1.40e-04 | 1.70e-03 | 58 |
| GO:00105067 | Cervix | CC | regulation of autophagy | 61/2311 | 317/18723 | 2.61e-04 | 2.87e-03 | 61 |
| GO:00070347 | Cervix | CC | vacuolar transport | 34/2311 | 157/18723 | 7.03e-04 | 6.40e-03 | 34 |
| GO:00714042 | Cervix | CC | cellular response to low-density lipoprotein particle stimulus | 9/2311 | 22/18723 | 7.19e-04 | 6.49e-03 | 9 |
| GO:001003810 | Cervix | CC | response to metal ion | 67/2311 | 373/18723 | 9.67e-04 | 8.10e-03 | 67 |
| GO:00713839 | Cervix | CC | cellular response to steroid hormone stimulus | 40/2311 | 204/18723 | 1.93e-03 | 1.42e-02 | 40 |
| GO:00315795 | Cervix | CC | membrane raft organization | 9/2311 | 25/18723 | 2.09e-03 | 1.52e-02 | 9 |
| GO:00094109 | Cervix | CC | response to xenobiotic stimulus | 78/2311 | 462/18723 | 2.39e-03 | 1.70e-02 | 78 |
| GO:00070416 | Cervix | CC | lysosomal transport | 24/2311 | 114/18723 | 5.81e-03 | 3.33e-02 | 24 |
| Page: 1 2 3 4 5 6 7 8 9 10 11 12 13 14 15 16 |
| Pathway ID | Tissue | Disease Stage | Description | Gene Ratio | Bg Ratio | pvalue | p.adjust | qvalue | Count |
| hsa0414222 | Esophagus | ESCC | Lysosome | 102/4205 | 132/8465 | 5.11e-11 | 7.13e-10 | 3.65e-10 | 102 |
| hsa0414232 | Esophagus | ESCC | Lysosome | 102/4205 | 132/8465 | 5.11e-11 | 7.13e-10 | 3.65e-10 | 102 |
| hsa049796 | Liver | NAFLD | Cholesterol metabolism | 20/1043 | 51/8465 | 9.73e-07 | 4.56e-05 | 3.67e-05 | 20 |
| hsa0497911 | Liver | NAFLD | Cholesterol metabolism | 20/1043 | 51/8465 | 9.73e-07 | 4.56e-05 | 3.67e-05 | 20 |
| hsa041422 | Liver | HCC | Lysosome | 100/4020 | 132/8465 | 2.32e-11 | 4.31e-10 | 2.40e-10 | 100 |
| hsa049794 | Liver | HCC | Cholesterol metabolism | 41/4020 | 51/8465 | 1.33e-06 | 1.35e-05 | 7.49e-06 | 41 |
| hsa041423 | Liver | HCC | Lysosome | 100/4020 | 132/8465 | 2.32e-11 | 4.31e-10 | 2.40e-10 | 100 |
| hsa049795 | Liver | HCC | Cholesterol metabolism | 41/4020 | 51/8465 | 1.33e-06 | 1.35e-05 | 7.49e-06 | 41 |
| Page: 1 |
Top |
Cell-cell communication analysis |
| Identification of potential cell-cell interactions between two cell types and their ligand-receptor pairs for different disease states |
| Ligand | Receptor | LRpair | Pathway | Tissue | Disease Stage |
| Page: 1 |
Top |
Single-cell gene regulatory network inference analysis |
| Find out the significant the regulons (TFs) and the target genes of each regulon across cell types for different disease states |
| TF | Cell Type | Tissue | Disease Stage | Target Gene | RSS | Regulon Activity |
| ∗The dot plots of a searched regulon are shown for all cell subpopulations in each disease state of each tissue based on the regulon specific score inferred using pySCENIC and by calculating the average expression. |
| Page: 1 |
Top |
Somatic mutation of malignant transformation related genes |
| Annotation of somatic variants for genes involved in malignant transformation |
| Hugo Symbol | Variant Class | Variant Classification | dbSNP RS | HGVSc | HGVSp | HGVSp Short | SWISSPROT | BIOTYPE | SIFT | PolyPhen | Tumor Sample Barcode | Tissue | Histology | Sex | Age | Stage | Therapy Types | Drugs | Outcome |
| NPC1 | SNV | Missense_Mutation | novel | c.2941N>T | p.Pro981Ser | p.P981S | O15118 | protein_coding | tolerated(0.5) | benign(0) | TCGA-A2-A0CP-01 | Breast | breast invasive carcinoma | Female | <65 | I/II | Chemotherapy | cytoxan | SD |
| NPC1 | SNV | Missense_Mutation | rs758362397 | c.2429T>G | p.Val810Gly | p.V810G | O15118 | protein_coding | tolerated(0.4) | benign(0) | TCGA-A2-A0CQ-01 | Breast | breast invasive carcinoma | Female | <65 | I/II | Chemotherapy | adriamycin | SD |
| NPC1 | SNV | Missense_Mutation | novel | c.1030N>G | p.Ser344Ala | p.S344A | O15118 | protein_coding | tolerated(0.43) | benign(0) | TCGA-A2-A0CS-01 | Breast | breast invasive carcinoma | Female | >=65 | III/IV | Hormone Therapy | anastrozole | SD |
| NPC1 | SNV | Missense_Mutation | rs748862167 | c.3493N>A | p.Val1165Met | p.V1165M | O15118 | protein_coding | deleterious(0) | probably_damaging(0.999) | TCGA-A2-A0YD-01 | Breast | breast invasive carcinoma | Female | <65 | I/II | Chemotherapy | cytoxan | SD |
| NPC1 | SNV | Missense_Mutation | c.2918N>T | p.Asp973Val | p.D973V | O15118 | protein_coding | deleterious(0.02) | benign(0.01) | TCGA-A8-A0AD-01 | Breast | breast invasive carcinoma | Female | >=65 | I/II | Hormone Therapy | tamoxiphen | SD | |
| NPC1 | SNV | Missense_Mutation | c.1756G>C | p.Glu586Gln | p.E586Q | O15118 | protein_coding | tolerated(0.15) | benign(0.042) | TCGA-AN-A0XW-01 | Breast | breast invasive carcinoma | Female | <65 | III/IV | Unknown | Unknown | SD | |
| NPC1 | SNV | Missense_Mutation | novel | c.1030N>G | p.Ser344Ala | p.S344A | O15118 | protein_coding | tolerated(0.43) | benign(0) | TCGA-B6-A0IA-01 | Breast | breast invasive carcinoma | Female | <65 | I/II | Unknown | Unknown | SD |
| NPC1 | SNV | Missense_Mutation | novel | c.1030N>G | p.Ser344Ala | p.S344A | O15118 | protein_coding | tolerated(0.43) | benign(0) | TCGA-BH-A0BR-01 | Breast | breast invasive carcinoma | Female | <65 | I/II | Unknown | Unknown | SD |
| NPC1 | SNV | Missense_Mutation | novel | c.1030N>G | p.Ser344Ala | p.S344A | O15118 | protein_coding | tolerated(0.43) | benign(0) | TCGA-BH-A0HO-01 | Breast | breast invasive carcinoma | Female | <65 | I/II | Chemotherapy | cyclophosphamide | SD |
| NPC1 | SNV | Missense_Mutation | novel | c.271N>G | p.Leu91Val | p.L91V | O15118 | protein_coding | tolerated(0.49) | benign(0) | TCGA-BH-A2L8-01 | Breast | breast invasive carcinoma | Female | <65 | I/II | Chemotherapy | cytoxan | CR |
| Page: 1 2 3 4 5 6 7 8 9 10 11 12 |
Top |
Related drugs of malignant transformation related genes |
| Identification of chemicals and drugs interact with genes involved in malignant transfromation |
| (DGIdb 4.0) |
| Entrez ID | Symbol | Category | Interaction Types | Drug Claim Name | Drug Name | PMIDs |
| 4864 | NPC1 | TRANSPORTER, DRUGGABLE GENOME | SU-4312 | CHEMBL328710 | ||
| 4864 | NPC1 | TRANSPORTER, DRUGGABLE GENOME | GNF-PF-1872 | CHEMBL600103 | ||
| 4864 | NPC1 | TRANSPORTER, DRUGGABLE GENOME | DNDI1417701 | CHEMBL1326164 | ||
| 4864 | NPC1 | TRANSPORTER, DRUGGABLE GENOME | TCMDC-124354 | CHEMBL546344 | ||
| 4864 | NPC1 | TRANSPORTER, DRUGGABLE GENOME | GNF-PF-3149 | CHEMBL582507 | ||
| 4864 | NPC1 | TRANSPORTER, DRUGGABLE GENOME | BIOCHANIN | BIOCHANIN | ||
| 4864 | NPC1 | TRANSPORTER, DRUGGABLE GENOME | 25-HYDROXYCHOLESTEROL | CHEMBL169046 | 23830695 | |
| 4864 | NPC1 | TRANSPORTER, DRUGGABLE GENOME | TCMDC-125353 | CHEMBL547924 | ||
| 4864 | NPC1 | TRANSPORTER, DRUGGABLE GENOME | NITAZOXANIDE | NITAZOXANIDE | ||
| 4864 | NPC1 | TRANSPORTER, DRUGGABLE GENOME | NSC-44661 | CHEMBL571228 |
| Page: 1 2 3 4 5 6 7 8 9 10 11 12 13 14 |

Copyright 2023-Present -The University of Texas Health Science Center at Houston |