
|
|||||
|
 | |
| |
| |
| |
| |
| |
|
Gene: NPAS3 |
Gene summary for NPAS3 |
| Gene information | Species | Human | Gene symbol | NPAS3 | Gene ID | 64067 |
| Gene name | neuronal PAS domain protein 3 | |
| Gene Alias | MOP6 | |
| Cytomap | 14q13.1 | |
| Gene Type | protein-coding | GO ID | GO:0006139 | UniProtAcc | Q8IXF0 |
Top |
Malignant transformation analysis |
| Identification of the aberrant gene expression in precancerous and cancerous lesions by comparing the gene expression of stem-like cells in diseased tissues with normal stem cells |
| Entrez ID | Symbol | Replicates | Species | Organ | Tissue | Adj P-value | Log2FC | Malignancy |
| 64067 | NPAS3 | HTA11_3410_2000001011 | Human | Colorectum | AD | 2.43e-12 | 1.66e-01 | 0.0155 |
| 64067 | NPAS3 | HTA11_2487_2000001011 | Human | Colorectum | SER | 3.41e-05 | 1.44e-01 | -0.1808 |
| 64067 | NPAS3 | HTA11_1938_2000001011 | Human | Colorectum | AD | 1.79e-07 | 1.74e-01 | -0.0811 |
| 64067 | NPAS3 | HTA11_78_2000001011 | Human | Colorectum | AD | 2.23e-07 | 1.76e-01 | -0.1088 |
| 64067 | NPAS3 | HTA11_347_2000001011 | Human | Colorectum | AD | 2.94e-04 | 1.42e-01 | -0.1954 |
| 64067 | NPAS3 | HTA11_696_2000001011 | Human | Colorectum | AD | 3.95e-07 | 1.89e-01 | -0.1464 |
| 64067 | NPAS3 | HTA11_1391_2000001011 | Human | Colorectum | AD | 1.51e-03 | 1.27e-01 | -0.059 |
| 64067 | NPAS3 | HTA11_2992_2000001011 | Human | Colorectum | SER | 1.38e-02 | 1.59e-01 | -0.1706 |
| 64067 | NPAS3 | HTA11_5216_2000001011 | Human | Colorectum | SER | 1.99e-03 | 2.56e-01 | -0.1462 |
| 64067 | NPAS3 | HTA11_546_2000001011 | Human | Colorectum | AD | 5.84e-06 | 1.95e-01 | -0.0842 |
| 64067 | NPAS3 | HTA11_866_3004761011 | Human | Colorectum | AD | 6.00e-04 | 5.05e-02 | 0.096 |
| 64067 | NPAS3 | HTA11_99999970781_79442 | Human | Colorectum | MSS | 6.22e-04 | 1.62e-01 | 0.294 |
| 64067 | NPAS3 | HTA11_99999965062_69753 | Human | Colorectum | MSI-H | 4.87e-05 | 5.52e-01 | 0.3487 |
| 64067 | NPAS3 | AEH-subject1 | Human | Endometrium | AEH | 1.59e-53 | 1.12e+00 | -0.3059 |
| 64067 | NPAS3 | AEH-subject2 | Human | Endometrium | AEH | 8.73e-19 | 8.25e-01 | -0.2525 |
| 64067 | NPAS3 | AEH-subject3 | Human | Endometrium | AEH | 1.17e-116 | 1.80e+00 | -0.2576 |
| 64067 | NPAS3 | AEH-subject4 | Human | Endometrium | AEH | 4.81e-26 | 1.10e+00 | -0.2657 |
| 64067 | NPAS3 | AEH-subject5 | Human | Endometrium | AEH | 6.35e-76 | 1.46e+00 | -0.2953 |
| 64067 | NPAS3 | EEC-subject1 | Human | Endometrium | EEC | 6.36e-88 | 1.48e+00 | -0.2682 |
| 64067 | NPAS3 | EEC-subject2 | Human | Endometrium | EEC | 2.76e-56 | 1.17e+00 | -0.2607 |
| Page: 1 2 3 |
| Tissue | Expression Dynamics | Abbreviation |
| Colorectum (GSE201348) |  | FAP: Familial adenomatous polyposis |
| CRC: Colorectal cancer | ||
| Colorectum (HTA11) |  | AD: Adenomas |
| SER: Sessile serrated lesions | ||
| MSI-H: Microsatellite-high colorectal cancer | ||
| MSS: Microsatellite stable colorectal cancer | ||
| Endometrium | 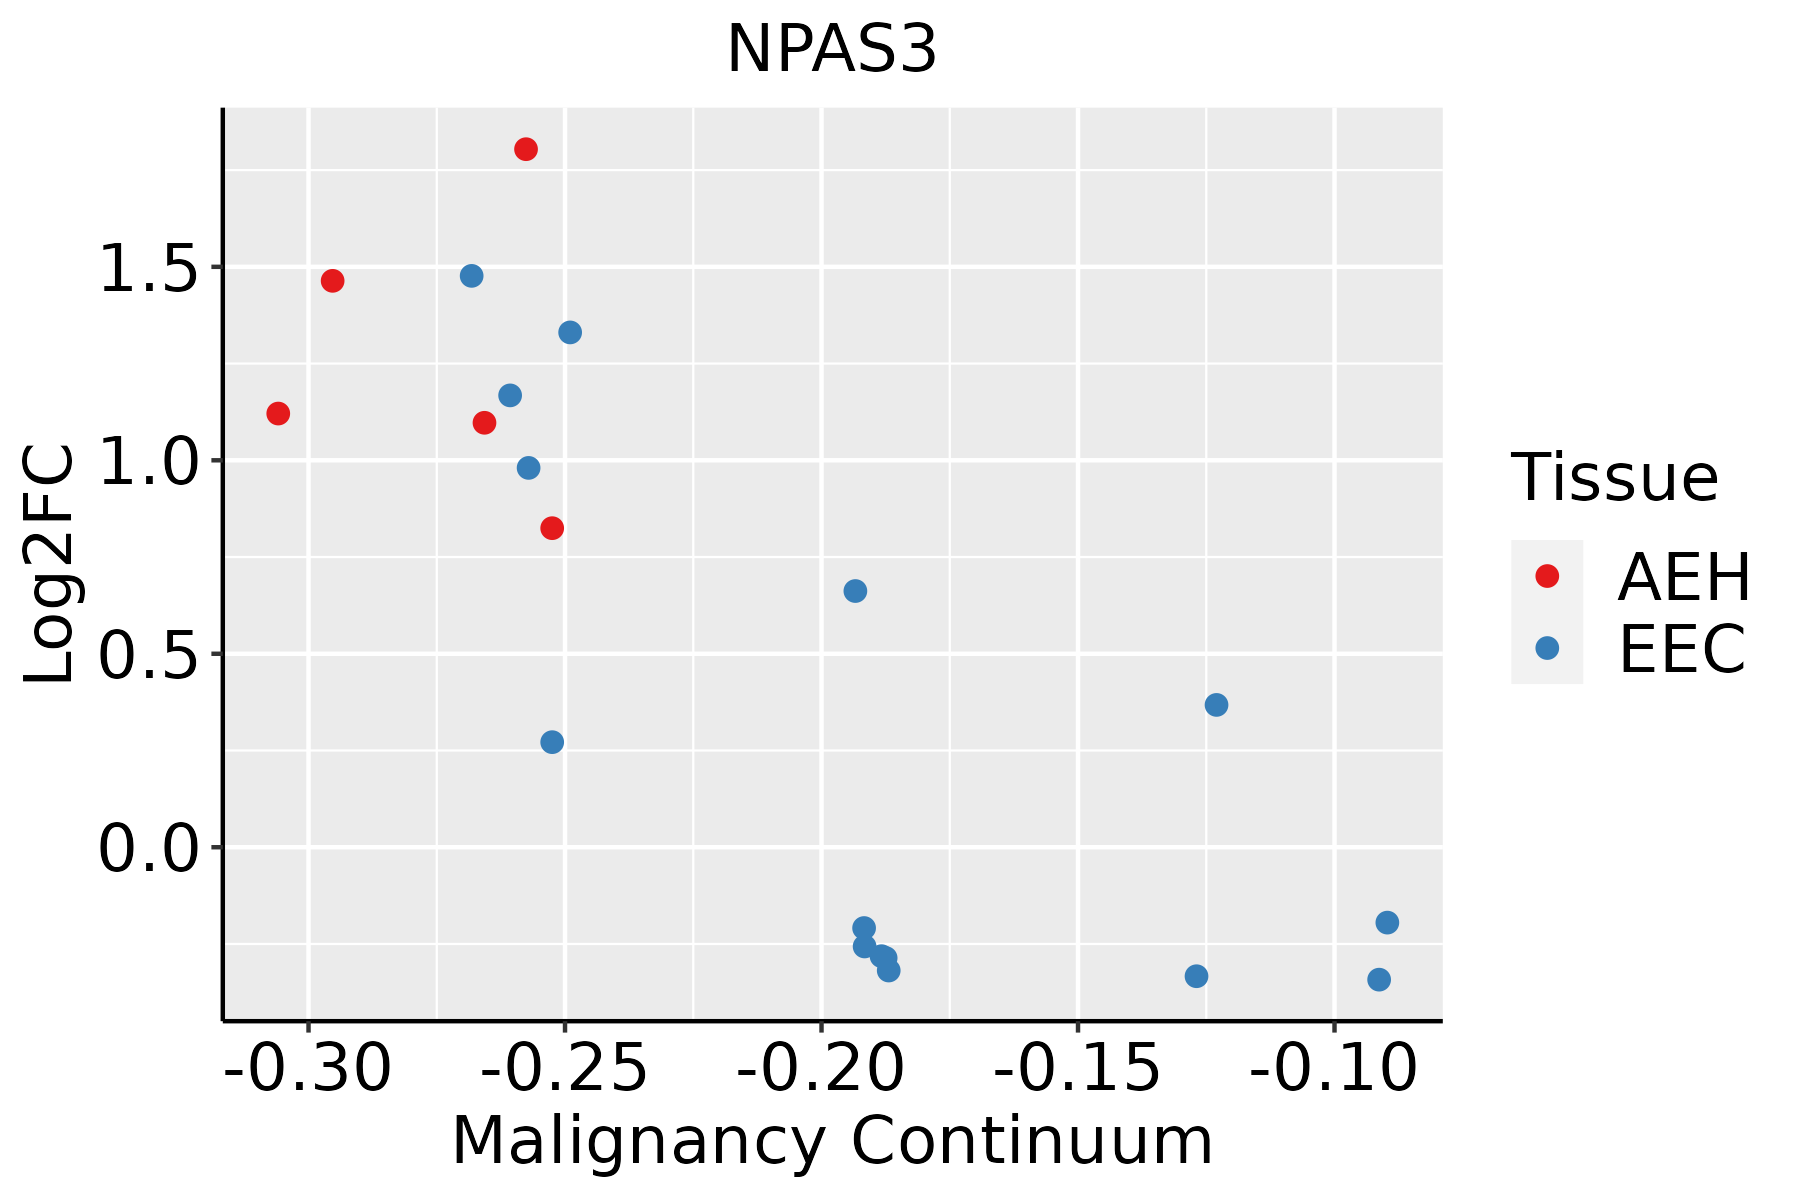 | AEH: Atypical endometrial hyperplasia |
| EEC: Endometrioid Cancer | ||
| Prostate |  | BPH: Benign Prostatic Hyperplasia |
| ∗log2FC in expression of this searched gene in stem-like cells from each diseased tissue sample relative to stem-like cells in normal samples in each tissue plotted against the malignancy continuum. Samples are colored based on if they are from different disease stage. |
Top |
Malignant transformation related pathway analysis |
| Find out the enriched GO biological processes and KEGG pathways involved in transition from healthy to precancer to cancer |
| Tissue | Disease Stage | Enriched GO biological Processes |
| Colorectum | AD |  |
| Colorectum | SER |  |
| Colorectum | MSS |  |
| Colorectum | MSI-H |  |
| Colorectum | FAP |  |
| ∗Top 15 enriched GO BP terms are showed in the bar plot of each disease state in each tissue. Each row represents a significant GO biological process which is colored according to the -log10(p.adjust). |
| Page: 1 2 3 4 5 6 7 8 9 |
| GO ID | Tissue | Disease Stage | Description | Gene Ratio | Bg Ratio | pvalue | p.adjust | Count |
| Page: 1 |
| Pathway ID | Tissue | Disease Stage | Description | Gene Ratio | Bg Ratio | pvalue | p.adjust | qvalue | Count |
| Page: 1 |
Top |
Cell-cell communication analysis |
| Identification of potential cell-cell interactions between two cell types and their ligand-receptor pairs for different disease states |
| Ligand | Receptor | LRpair | Pathway | Tissue | Disease Stage |
| Page: 1 |
Top |
Single-cell gene regulatory network inference analysis |
| Find out the significant the regulons (TFs) and the target genes of each regulon across cell types for different disease states |
| TF | Cell Type | Tissue | Disease Stage | Target Gene | RSS | Regulon Activity |
| ∗The dot plots of a searched regulon are shown for all cell subpopulations in each disease state of each tissue based on the regulon specific score inferred using pySCENIC and by calculating the average expression. |
| Page: 1 |
Top |
Somatic mutation of malignant transformation related genes |
| Annotation of somatic variants for genes involved in malignant transformation |
| Hugo Symbol | Variant Class | Variant Classification | dbSNP RS | HGVSc | HGVSp | HGVSp Short | SWISSPROT | BIOTYPE | SIFT | PolyPhen | Tumor Sample Barcode | Tissue | Histology | Sex | Age | Stage | Therapy Types | Drugs | Outcome |
| NPAS3 | SNV | Missense_Mutation | c.1543N>A | p.Asp515Asn | p.D515N | Q8IXF0 | protein_coding | deleterious(0.01) | benign(0.102) | TCGA-A2-A04R-01 | Breast | breast invasive carcinoma | Female | <65 | I/II | Chemotherapy | taxol | SD | |
| NPAS3 | SNV | Missense_Mutation | c.235N>T | p.Pro79Ser | p.P79S | Q8IXF0 | protein_coding | deleterious(0) | probably_damaging(0.985) | TCGA-C8-A26Y-01 | Breast | breast invasive carcinoma | Female | >=65 | I/II | Unknown | Unknown | SD | |
| NPAS3 | SNV | Missense_Mutation | c.2003N>T | p.Pro668Leu | p.P668L | Q8IXF0 | protein_coding | deleterious_low_confidence(0) | benign(0.003) | TCGA-D8-A140-01 | Breast | breast invasive carcinoma | Female | <65 | I/II | Chemotherapy | doxorubicin+cyclophosphamid | SD | |
| NPAS3 | SNV | Missense_Mutation | rs144067606 | c.1499N>A | p.Arg500Gln | p.R500Q | Q8IXF0 | protein_coding | tolerated(0.43) | benign(0.078) | TCGA-D8-A1JK-01 | Breast | breast invasive carcinoma | Female | >=65 | I/II | Unknown | Unknown | SD |
| NPAS3 | SNV | Missense_Mutation | novel | c.239N>G | p.Leu80Arg | p.L80R | Q8IXF0 | protein_coding | deleterious(0) | probably_damaging(0.971) | TCGA-S3-A6ZH-01 | Breast | breast invasive carcinoma | Female | <65 | III/IV | Chemotherapy | adriamycin | CR |
| NPAS3 | insertion | In_Frame_Ins | novel | c.2035_2036insTGT | p.Pro679delinsLeuSer | p.P679delinsLS | Q8IXF0 | protein_coding | TCGA-A8-A07R-01 | Breast | breast invasive carcinoma | Female | >=65 | III/IV | Ancillary | zoledronic | SD | ||
| NPAS3 | insertion | Frame_Shift_Ins | novel | c.2036_2037insT | p.Tyr680LeufsTer10 | p.Y680Lfs*10 | Q8IXF0 | protein_coding | TCGA-A8-A07R-01 | Breast | breast invasive carcinoma | Female | >=65 | III/IV | Ancillary | zoledronic | SD | ||
| NPAS3 | insertion | Frame_Shift_Ins | novel | c.2033_2034insGCTTCGGTGCTCTGGGCGCGATGCAGATCAAGGTGGAG | p.Pro679LeufsTer17 | p.P679Lfs*17 | Q8IXF0 | protein_coding | TCGA-A8-A0A6-01 | Breast | breast invasive carcinoma | Female | <65 | III/IV | Chemotherapy | epirubicin | CR | ||
| NPAS3 | deletion | Frame_Shift_Del | c.1007_1016delNNNNNNNNNN | p.Val337ThrfsTer17 | p.V337Tfs*17 | Q8IXF0 | protein_coding | TCGA-B6-A0I8-01 | Breast | breast invasive carcinoma | Female | <65 | I/II | Unknown | Unknown | PD | |||
| NPAS3 | insertion | In_Frame_Ins | novel | c.690_691insCCTTTTTCAGGAATAGCTATTAACCAAACTGAATTT | p.Ala230_Ser231insProPheSerGlyIleAlaIleAsnGlnThrGluPhe | p.A230_S231insPFSGIAINQTEF | Q8IXF0 | protein_coding | TCGA-B6-A0RE-01 | Breast | breast invasive carcinoma | Female | <65 | I/II | Unknown | Unknown | SD |
| Page: 1 2 3 4 5 6 7 8 9 10 11 12 13 |
Top |
Related drugs of malignant transformation related genes |
| Identification of chemicals and drugs interact with genes involved in malignant transfromation |
| (DGIdb 4.0) |
| Entrez ID | Symbol | Category | Interaction Types | Drug Claim Name | Drug Name | PMIDs |
| Page: 1 |

Copyright 2023-Present -The University of Texas Health Science Center at Houston |