
|
|||||
|
 | |
| |
| |
| |
| |
| |
|
Gene: NPAS2 |
Gene summary for NPAS2 |
| Gene information | Species | Human | Gene symbol | NPAS2 | Gene ID | 4862 |
| Gene name | neuronal PAS domain protein 2 | |
| Gene Alias | MOP4 | |
| Cytomap | 2q11.2 | |
| Gene Type | protein-coding | GO ID | GO:0001662 | UniProtAcc | A2I2P5 |
Top |
Malignant transformation analysis |
| Identification of the aberrant gene expression in precancerous and cancerous lesions by comparing the gene expression of stem-like cells in diseased tissues with normal stem cells |
| Entrez ID | Symbol | Replicates | Species | Organ | Tissue | Adj P-value | Log2FC | Malignancy |
| 4862 | NPAS2 | A002-C-010 | Human | Colorectum | FAP | 1.20e-03 | -1.83e-01 | 0.242 |
| 4862 | NPAS2 | A015-C-203 | Human | Colorectum | FAP | 1.72e-41 | -6.42e-01 | -0.1294 |
| 4862 | NPAS2 | A015-C-204 | Human | Colorectum | FAP | 1.96e-08 | -5.19e-01 | -0.0228 |
| 4862 | NPAS2 | A014-C-040 | Human | Colorectum | FAP | 6.79e-04 | -5.11e-01 | -0.1184 |
| 4862 | NPAS2 | A002-C-201 | Human | Colorectum | FAP | 9.51e-12 | -4.44e-01 | 0.0324 |
| 4862 | NPAS2 | A002-C-203 | Human | Colorectum | FAP | 1.12e-03 | -2.23e-01 | 0.2786 |
| 4862 | NPAS2 | A001-C-119 | Human | Colorectum | FAP | 3.28e-09 | -6.09e-01 | -0.1557 |
| 4862 | NPAS2 | A001-C-108 | Human | Colorectum | FAP | 1.90e-23 | -3.72e-01 | -0.0272 |
| 4862 | NPAS2 | A002-C-021 | Human | Colorectum | FAP | 1.29e-02 | -2.34e-01 | 0.1171 |
| 4862 | NPAS2 | A002-C-205 | Human | Colorectum | FAP | 3.21e-26 | -7.19e-01 | -0.1236 |
| 4862 | NPAS2 | A001-C-104 | Human | Colorectum | FAP | 6.39e-05 | -2.81e-01 | 0.0184 |
| 4862 | NPAS2 | A015-C-005 | Human | Colorectum | FAP | 3.17e-02 | -3.47e-01 | -0.0336 |
| 4862 | NPAS2 | A015-C-006 | Human | Colorectum | FAP | 1.01e-12 | -4.27e-01 | -0.0994 |
| 4862 | NPAS2 | A015-C-106 | Human | Colorectum | FAP | 7.69e-19 | -4.20e-01 | -0.0511 |
| 4862 | NPAS2 | A002-C-114 | Human | Colorectum | FAP | 8.53e-16 | -5.33e-01 | -0.1561 |
| 4862 | NPAS2 | A015-C-104 | Human | Colorectum | FAP | 1.25e-42 | -6.99e-01 | -0.1899 |
| 4862 | NPAS2 | A001-C-014 | Human | Colorectum | FAP | 2.31e-16 | -3.71e-01 | 0.0135 |
| 4862 | NPAS2 | A002-C-016 | Human | Colorectum | FAP | 1.06e-30 | -5.49e-01 | 0.0521 |
| 4862 | NPAS2 | A015-C-002 | Human | Colorectum | FAP | 4.25e-12 | -5.90e-01 | -0.0763 |
| 4862 | NPAS2 | A001-C-203 | Human | Colorectum | FAP | 1.59e-17 | -4.13e-01 | -0.0481 |
| Page: 1 2 |
| Tissue | Expression Dynamics | Abbreviation |
| Colorectum (GSE201348) |  | FAP: Familial adenomatous polyposis |
| CRC: Colorectal cancer | ||
| Colorectum (HTA11) |  | AD: Adenomas |
| SER: Sessile serrated lesions | ||
| MSI-H: Microsatellite-high colorectal cancer | ||
| MSS: Microsatellite stable colorectal cancer | ||
| Prostate | 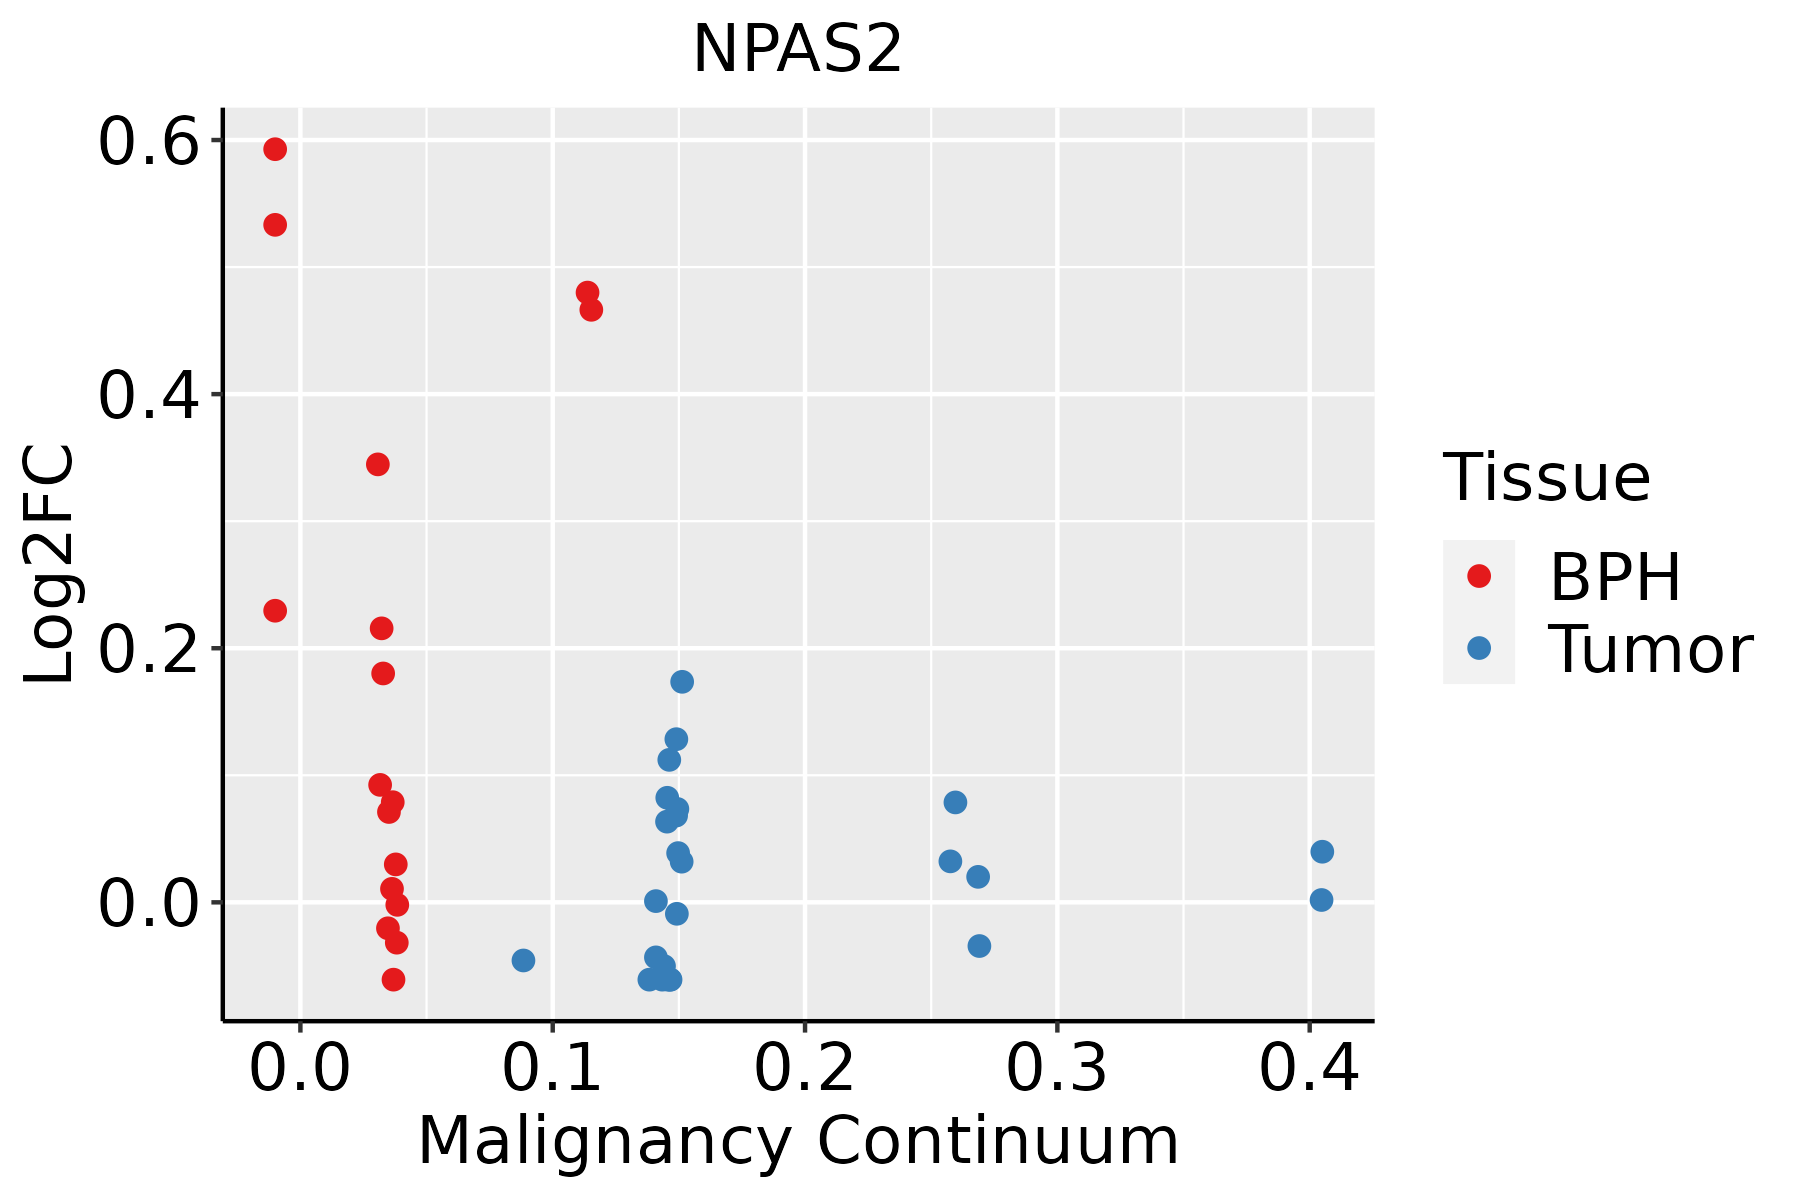 | BPH: Benign Prostatic Hyperplasia |
| ∗log2FC in expression of this searched gene in stem-like cells from each diseased tissue sample relative to stem-like cells in normal samples in each tissue plotted against the malignancy continuum. Samples are colored based on if they are from different disease stage. |
Top |
Malignant transformation related pathway analysis |
| Find out the enriched GO biological processes and KEGG pathways involved in transition from healthy to precancer to cancer |
| Tissue | Disease Stage | Enriched GO biological Processes |
| Colorectum | AD |  |
| Colorectum | SER |  |
| Colorectum | MSS |  |
| Colorectum | MSI-H |  |
| Colorectum | FAP |  |
| ∗Top 15 enriched GO BP terms are showed in the bar plot of each disease state in each tissue. Each row represents a significant GO biological process which is colored according to the -log10(p.adjust). |
| Page: 1 2 3 4 5 6 7 8 9 |
| GO ID | Tissue | Disease Stage | Description | Gene Ratio | Bg Ratio | pvalue | p.adjust | Count |
| GO:00076233 | Colorectum | FAP | circadian rhythm | 56/2622 | 210/18723 | 9.12e-07 | 4.14e-05 | 56 |
| GO:00510524 | Colorectum | FAP | regulation of DNA metabolic process | 84/2622 | 359/18723 | 9.80e-07 | 4.38e-05 | 84 |
| GO:00485113 | Colorectum | FAP | rhythmic process | 72/2622 | 298/18723 | 1.67e-06 | 6.99e-05 | 72 |
| GO:00510544 | Colorectum | FAP | positive regulation of DNA metabolic process | 53/2622 | 201/18723 | 2.55e-06 | 9.82e-05 | 53 |
| GO:20010204 | Colorectum | FAP | regulation of response to DNA damage stimulus | 51/2622 | 219/18723 | 1.40e-04 | 2.21e-03 | 51 |
| GO:00062822 | Colorectum | FAP | regulation of DNA repair | 32/2622 | 130/18723 | 8.53e-04 | 8.79e-03 | 32 |
| GO:20010222 | Colorectum | FAP | positive regulation of response to DNA damage stimulus | 27/2622 | 105/18723 | 1.04e-03 | 1.02e-02 | 27 |
| GO:00094102 | Colorectum | FAP | response to xenobiotic stimulus | 87/2622 | 462/18723 | 2.15e-03 | 1.77e-02 | 87 |
| GO:00457391 | Colorectum | FAP | positive regulation of DNA repair | 19/2622 | 73/18723 | 4.71e-03 | 3.17e-02 | 19 |
| GO:0032922 | Colorectum | FAP | circadian regulation of gene expression | 18/2622 | 68/18723 | 4.83e-03 | 3.25e-02 | 18 |
| GO:00485114 | Colorectum | CRC | rhythmic process | 64/2078 | 298/18723 | 1.43e-07 | 1.62e-05 | 64 |
| GO:00510545 | Colorectum | CRC | positive regulation of DNA metabolic process | 46/2078 | 201/18723 | 1.26e-06 | 7.21e-05 | 46 |
| GO:00510525 | Colorectum | CRC | regulation of DNA metabolic process | 70/2078 | 359/18723 | 1.75e-06 | 8.92e-05 | 70 |
| GO:00076234 | Colorectum | CRC | circadian rhythm | 47/2078 | 210/18723 | 1.89e-06 | 9.29e-05 | 47 |
| GO:20010205 | Colorectum | CRC | regulation of response to DNA damage stimulus | 45/2078 | 219/18723 | 3.13e-05 | 8.09e-04 | 45 |
| GO:00062823 | Colorectum | CRC | regulation of DNA repair | 30/2078 | 130/18723 | 7.15e-05 | 1.52e-03 | 30 |
| GO:20010223 | Colorectum | CRC | positive regulation of response to DNA damage stimulus | 25/2078 | 105/18723 | 1.64e-04 | 2.94e-03 | 25 |
| GO:00457392 | Colorectum | CRC | positive regulation of DNA repair | 18/2078 | 73/18723 | 8.33e-04 | 1.04e-02 | 18 |
| GO:00094103 | Colorectum | CRC | response to xenobiotic stimulus | 69/2078 | 462/18723 | 6.34e-03 | 4.61e-02 | 69 |
| GO:004851110 | Prostate | BPH | rhythmic process | 96/3107 | 298/18723 | 1.88e-11 | 1.31e-09 | 96 |
| Page: 1 2 |
| Pathway ID | Tissue | Disease Stage | Description | Gene Ratio | Bg Ratio | pvalue | p.adjust | qvalue | Count |
| hsa047104 | Prostate | BPH | Circadian rhythm | 15/1718 | 34/8465 | 1.40e-03 | 5.85e-03 | 3.62e-03 | 15 |
| hsa0471011 | Prostate | BPH | Circadian rhythm | 15/1718 | 34/8465 | 1.40e-03 | 5.85e-03 | 3.62e-03 | 15 |
| hsa0471021 | Prostate | Tumor | Circadian rhythm | 14/1791 | 34/8465 | 6.44e-03 | 2.16e-02 | 1.34e-02 | 14 |
| hsa0471031 | Prostate | Tumor | Circadian rhythm | 14/1791 | 34/8465 | 6.44e-03 | 2.16e-02 | 1.34e-02 | 14 |
| Page: 1 |
Top |
Cell-cell communication analysis |
| Identification of potential cell-cell interactions between two cell types and their ligand-receptor pairs for different disease states |
| Ligand | Receptor | LRpair | Pathway | Tissue | Disease Stage |
| Page: 1 |
Top |
Single-cell gene regulatory network inference analysis |
| Find out the significant the regulons (TFs) and the target genes of each regulon across cell types for different disease states |
| TF | Cell Type | Tissue | Disease Stage | Target Gene | RSS | Regulon Activity |
| NPAS2 | CHO | Liver | Healthy | SLC35F3,FMNL2,SLC12A2, etc. | 3.38e-01 |  |
| NPAS2 | LYMEND | Lung | ADJ | SULF1,KIF26B,TENM4, etc. | 4.26e-02 |  |
| NPAS2 | PERI | Lung | ADJ | SULF1,KIF26B,TENM4, etc. | 2.09e-02 | |
| NPAS2 | LYMEND | Lung | AIS | SULF1,KIF26B,TENM4, etc. | 7.85e-03 |  |
| NPAS2 | MEGA | Lung | AIS | SULF1,KIF26B,TENM4, etc. | 1.39e-03 | |
| NPAS2 | PERI | Lung | IAC | SULF1,KIF26B,TENM4, etc. | 4.80e-01 |  |
| NPAS2 | LYMEND | Lung | IAC | SULF1,KIF26B,TENM4, etc. | 5.24e-03 | |
| NPAS2 | MEGA | Lung | IAC | SULF1,KIF26B,TENM4, etc. | 1.07e-04 | |
| NPAS2 | ICAF | Lung | IAC | SULF1,KIF26B,TENM4, etc. | 5.99e-04 | |
| NPAS2 | ECM | Lung | MIAC | SULF1,KIF26B,TENM4, etc. | 2.12e-01 |  |
| ∗The dot plots of a searched regulon are shown for all cell subpopulations in each disease state of each tissue based on the regulon specific score inferred using pySCENIC and by calculating the average expression. |
| Page: 1 2 |
Top |
Somatic mutation of malignant transformation related genes |
| Annotation of somatic variants for genes involved in malignant transformation |
| Hugo Symbol | Variant Class | Variant Classification | dbSNP RS | HGVSc | HGVSp | HGVSp Short | SWISSPROT | BIOTYPE | SIFT | PolyPhen | Tumor Sample Barcode | Tissue | Histology | Sex | Age | Stage | Therapy Types | Drugs | Outcome |
| NPAS2 | SNV | Missense_Mutation | novel | c.587C>G | p.Ser196Cys | p.S196C | Q99743 | protein_coding | tolerated(0.14) | benign(0.093) | TCGA-5L-AAT1-01 | Breast | breast invasive carcinoma | Female | <65 | III/IV | Hormone Therapy | letrozol | SD |
| NPAS2 | SNV | Missense_Mutation | c.64N>T | p.Arg22Trp | p.R22W | Q99743 | protein_coding | deleterious(0) | probably_damaging(1) | TCGA-A1-A0SK-01 | Breast | breast invasive carcinoma | Female | <65 | I/II | Unknown | Unknown | PD | |
| NPAS2 | SNV | Missense_Mutation | c.1476N>C | p.Met492Ile | p.M492I | Q99743 | protein_coding | tolerated(0.14) | benign(0.017) | TCGA-A2-A25B-01 | Breast | breast invasive carcinoma | Female | <65 | I/II | Chemotherapy | taxotere | PD | |
| NPAS2 | SNV | Missense_Mutation | c.132C>A | p.Asp44Glu | p.D44E | Q99743 | protein_coding | deleterious(0.02) | possibly_damaging(0.893) | TCGA-A8-A06P-01 | Breast | breast invasive carcinoma | Female | <65 | III/IV | Unspecific | SD | ||
| NPAS2 | SNV | Missense_Mutation | rs751210882 | c.736N>A | p.Glu246Lys | p.E246K | Q99743 | protein_coding | deleterious(0.01) | possibly_damaging(0.877) | TCGA-AN-A046-01 | Breast | breast invasive carcinoma | Female | >=65 | I/II | Unknown | Unknown | SD |
| NPAS2 | SNV | Missense_Mutation | rs530175072 | c.1487N>T | p.Ser496Leu | p.S496L | Q99743 | protein_coding | deleterious(0.02) | possibly_damaging(0.727) | TCGA-AN-A046-01 | Breast | breast invasive carcinoma | Female | >=65 | I/II | Unknown | Unknown | SD |
| NPAS2 | SNV | Missense_Mutation | c.1460G>A | p.Ser487Asn | p.S487N | Q99743 | protein_coding | tolerated(0.41) | benign(0.001) | TCGA-BH-A18G-01 | Breast | breast invasive carcinoma | Female | >=65 | I/II | Unknown | Unknown | SD | |
| NPAS2 | insertion | Frame_Shift_Ins | novel | c.1448_1449insGAGT | p.Val484SerfsTer80 | p.V484Sfs*80 | Q99743 | protein_coding | TCGA-A2-A0D2-01 | Breast | breast invasive carcinoma | Female | <65 | I/II | Chemotherapy | adriamycin | SD | ||
| NPAS2 | insertion | Frame_Shift_Ins | novel | c.1449_1450insCTTTCACT | p.Val484LeufsTer29 | p.V484Lfs*29 | Q99743 | protein_coding | TCGA-A2-A0D2-01 | Breast | breast invasive carcinoma | Female | <65 | I/II | Chemotherapy | adriamycin | SD | ||
| NPAS2 | insertion | Nonsense_Mutation | novel | c.1017_1018insGCCACCACACCCGGCTAATTTTTTGTATTTTTAGTAGAG | p.Ser339_Lys340insAlaThrThrProGlyTerPhePheValPheLeuValGlu | p.S339_K340insATTPG*FFVFLVE | Q99743 | protein_coding | TCGA-AO-A0JB-01 | Breast | breast invasive carcinoma | Female | <65 | III/IV | Chemotherapy | cyclophosphamide | SD |
| Page: 1 2 3 4 5 6 7 8 9 10 |
Top |
Related drugs of malignant transformation related genes |
| Identification of chemicals and drugs interact with genes involved in malignant transfromation |
| (DGIdb 4.0) |
| Entrez ID | Symbol | Category | Interaction Types | Drug Claim Name | Drug Name | PMIDs |
| Page: 1 |

Copyright 2023-Present -The University of Texas Health Science Center at Houston |