
|
|||||
|
 | |
| |
| |
| |
| |
| |
|
Gene: NOXA1 |
Gene summary for NOXA1 |
| Gene information | Species | Human | Gene symbol | NOXA1 | Gene ID | 10811 |
| Gene name | NADPH oxidase activator 1 | |
| Gene Alias | NY-CO-31 | |
| Cytomap | 9q34.3 | |
| Gene Type | protein-coding | GO ID | GO:0006801 | UniProtAcc | Q86UR1 |
Top |
Malignant transformation analysis |
| Identification of the aberrant gene expression in precancerous and cancerous lesions by comparing the gene expression of stem-like cells in diseased tissues with normal stem cells |
| Entrez ID | Symbol | Replicates | Species | Organ | Tissue | Adj P-value | Log2FC | Malignancy |
| 10811 | NOXA1 | LZE20T | Human | Esophagus | ESCC | 1.26e-02 | 1.51e-01 | 0.0662 |
| 10811 | NOXA1 | LZE24T | Human | Esophagus | ESCC | 5.64e-10 | 2.08e-01 | 0.0596 |
| 10811 | NOXA1 | P1T-E | Human | Esophagus | ESCC | 5.20e-08 | 2.89e-01 | 0.0875 |
| 10811 | NOXA1 | P2T-E | Human | Esophagus | ESCC | 2.51e-08 | 1.24e-01 | 0.1177 |
| 10811 | NOXA1 | P4T-E | Human | Esophagus | ESCC | 1.75e-05 | 1.26e-01 | 0.1323 |
| 10811 | NOXA1 | P8T-E | Human | Esophagus | ESCC | 5.40e-17 | 3.30e-01 | 0.0889 |
| 10811 | NOXA1 | P11T-E | Human | Esophagus | ESCC | 2.46e-02 | 1.38e-01 | 0.1426 |
| 10811 | NOXA1 | P12T-E | Human | Esophagus | ESCC | 4.13e-06 | 7.30e-02 | 0.1122 |
| 10811 | NOXA1 | P15T-E | Human | Esophagus | ESCC | 3.12e-08 | 1.79e-01 | 0.1149 |
| 10811 | NOXA1 | P16T-E | Human | Esophagus | ESCC | 1.23e-03 | 6.79e-02 | 0.1153 |
| 10811 | NOXA1 | P22T-E | Human | Esophagus | ESCC | 3.07e-09 | 1.25e-01 | 0.1236 |
| 10811 | NOXA1 | P23T-E | Human | Esophagus | ESCC | 3.88e-04 | 1.25e-01 | 0.108 |
| 10811 | NOXA1 | P26T-E | Human | Esophagus | ESCC | 2.66e-07 | 9.93e-02 | 0.1276 |
| 10811 | NOXA1 | P27T-E | Human | Esophagus | ESCC | 4.23e-09 | 1.45e-01 | 0.1055 |
| 10811 | NOXA1 | P28T-E | Human | Esophagus | ESCC | 6.30e-11 | 1.47e-01 | 0.1149 |
| 10811 | NOXA1 | P30T-E | Human | Esophagus | ESCC | 9.20e-05 | 1.65e-01 | 0.137 |
| 10811 | NOXA1 | P39T-E | Human | Esophagus | ESCC | 1.00e-05 | 9.56e-02 | 0.0894 |
| 10811 | NOXA1 | P40T-E | Human | Esophagus | ESCC | 2.37e-02 | 8.62e-02 | 0.109 |
| 10811 | NOXA1 | P42T-E | Human | Esophagus | ESCC | 9.05e-04 | 1.19e-01 | 0.1175 |
| 10811 | NOXA1 | P47T-E | Human | Esophagus | ESCC | 5.28e-07 | 8.23e-02 | 0.1067 |
| Page: 1 2 |
| Tissue | Expression Dynamics | Abbreviation |
| Esophagus | 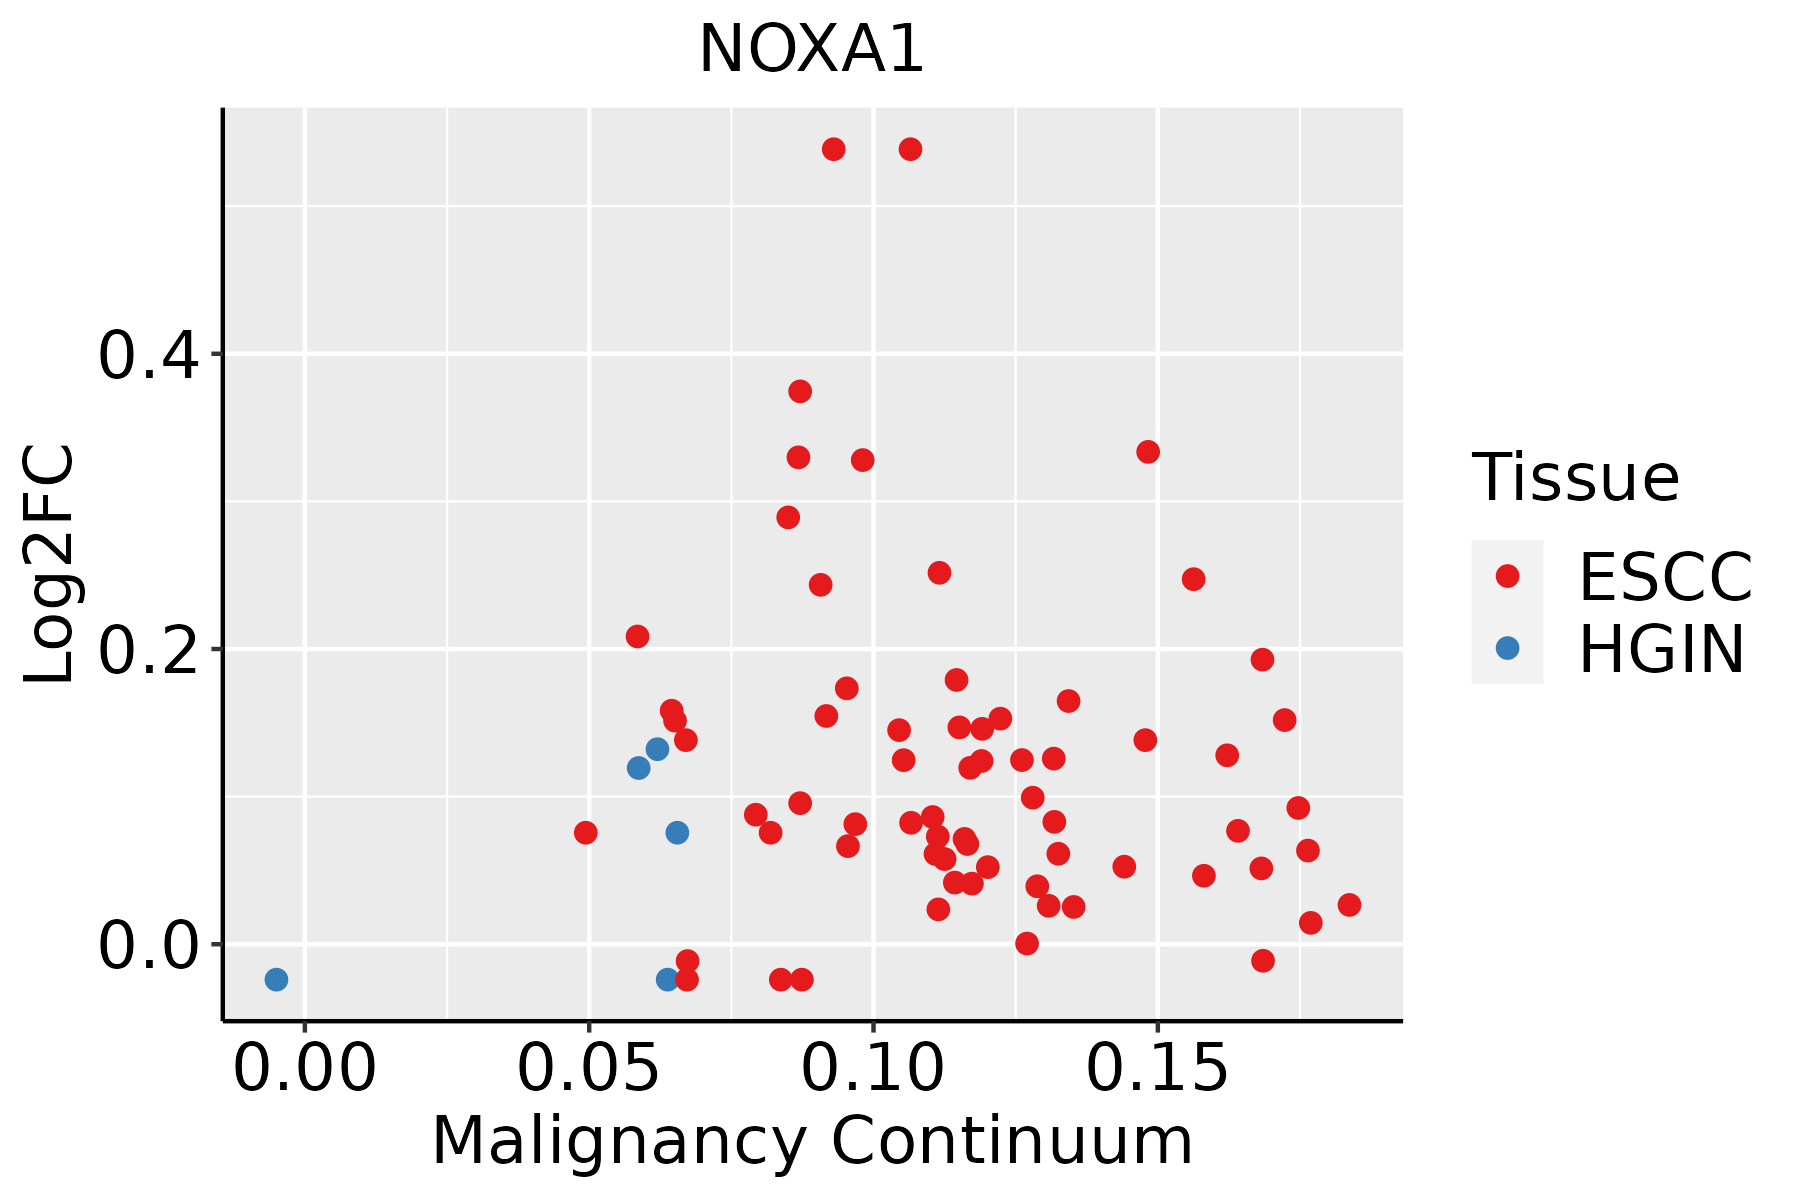 | ESCC: Esophageal squamous cell carcinoma |
| HGIN: High-grade intraepithelial neoplasias | ||
| LGIN: Low-grade intraepithelial neoplasias |
| ∗log2FC in expression of this searched gene in stem-like cells from each diseased tissue sample relative to stem-like cells in normal samples in each tissue plotted against the malignancy continuum. Samples are colored based on if they are from different disease stage. |
Top |
Malignant transformation related pathway analysis |
| Find out the enriched GO biological processes and KEGG pathways involved in transition from healthy to precancer to cancer |
| Tissue | Disease Stage | Enriched GO biological Processes |
| Colorectum | AD |  |
| Colorectum | SER |  |
| Colorectum | MSS |  |
| Colorectum | MSI-H |  |
| Colorectum | FAP |  |
| ∗Top 15 enriched GO BP terms are showed in the bar plot of each disease state in each tissue. Each row represents a significant GO biological process which is colored according to the -log10(p.adjust). |
| Page: 1 2 3 4 5 6 7 8 9 |
| GO ID | Tissue | Disease Stage | Description | Gene Ratio | Bg Ratio | pvalue | p.adjust | Count |
| GO:200037718 | Esophagus | ESCC | regulation of reactive oxygen species metabolic process | 100/8552 | 157/18723 | 3.87e-06 | 4.17e-05 | 100 |
| GO:007259318 | Esophagus | ESCC | reactive oxygen species metabolic process | 137/8552 | 239/18723 | 1.82e-04 | 1.16e-03 | 137 |
| GO:00103101 | Esophagus | ESCC | regulation of hydrogen peroxide metabolic process | 16/8552 | 22/18723 | 9.46e-03 | 3.28e-02 | 16 |
| Page: 1 |
| Pathway ID | Tissue | Disease Stage | Description | Gene Ratio | Bg Ratio | pvalue | p.adjust | qvalue | Count |
| Page: 1 |
Top |
Cell-cell communication analysis |
| Identification of potential cell-cell interactions between two cell types and their ligand-receptor pairs for different disease states |
| Ligand | Receptor | LRpair | Pathway | Tissue | Disease Stage |
| Page: 1 |
Top |
Single-cell gene regulatory network inference analysis |
| Find out the significant the regulons (TFs) and the target genes of each regulon across cell types for different disease states |
| TF | Cell Type | Tissue | Disease Stage | Target Gene | RSS | Regulon Activity |
| ∗The dot plots of a searched regulon are shown for all cell subpopulations in each disease state of each tissue based on the regulon specific score inferred using pySCENIC and by calculating the average expression. |
| Page: 1 |
Top |
Somatic mutation of malignant transformation related genes |
| Annotation of somatic variants for genes involved in malignant transformation |
| Hugo Symbol | Variant Class | Variant Classification | dbSNP RS | HGVSc | HGVSp | HGVSp Short | SWISSPROT | BIOTYPE | SIFT | PolyPhen | Tumor Sample Barcode | Tissue | Histology | Sex | Age | Stage | Therapy Types | Drugs | Outcome |
| NOXA1 | SNV | Missense_Mutation | c.1333N>C | p.Glu445Gln | p.E445Q | Q86UR1 | protein_coding | deleterious(0) | probably_damaging(0.996) | TCGA-C8-A275-01 | Breast | breast invasive carcinoma | Female | <65 | I/II | Unknown | Unknown | SD | |
| NOXA1 | SNV | Missense_Mutation | novel | c.1234G>A | p.Ala412Thr | p.A412T | Q86UR1 | protein_coding | deleterious(0) | probably_damaging(0.998) | TCGA-AA-A022-01 | Colorectum | colon adenocarcinoma | Female | >=65 | I/II | Unknown | Unknown | SD |
| NOXA1 | SNV | Missense_Mutation | c.872N>A | p.Pro291His | p.P291H | Q86UR1 | protein_coding | deleterious(0.01) | possibly_damaging(0.799) | TCGA-AD-6895-01 | Colorectum | colon adenocarcinoma | Male | >=65 | III/IV | Unknown | Unknown | SD | |
| NOXA1 | SNV | Missense_Mutation | c.776N>C | p.Arg259Pro | p.R259P | Q86UR1 | protein_coding | tolerated(0.32) | benign(0.106) | TCGA-CK-4951-01 | Colorectum | colon adenocarcinoma | Female | >=65 | I/II | Unknown | Unknown | PD | |
| NOXA1 | SNV | Missense_Mutation | c.352A>G | p.Lys118Glu | p.K118E | Q86UR1 | protein_coding | tolerated(0.16) | benign(0.142) | TCGA-G4-6586-01 | Colorectum | colon adenocarcinoma | Female | >=65 | I/II | Unknown | Unknown | SD | |
| NOXA1 | SNV | Missense_Mutation | rs145080773 | c.332N>T | p.Thr111Met | p.T111M | Q86UR1 | protein_coding | deleterious(0.01) | probably_damaging(0.977) | TCGA-DC-5337-01 | Colorectum | rectum adenocarcinoma | Male | >=65 | I/II | Unknown | Unknown | SD |
| NOXA1 | SNV | Missense_Mutation | rs769178904 | c.292N>C | p.Ala98Pro | p.A98P | Q86UR1 | protein_coding | deleterious(0) | probably_damaging(0.987) | TCGA-EI-6510-01 | Colorectum | rectum adenocarcinoma | Female | >=65 | I/II | Unknown | Unknown | SD |
| NOXA1 | deletion | Frame_Shift_Del | c.745delC | p.Leu249SerfsTer66 | p.L249Sfs*66 | Q86UR1 | protein_coding | TCGA-AZ-6598-01 | Colorectum | colon adenocarcinoma | Female | >=65 | I/II | Unknown | Unknown | SD | |||
| NOXA1 | SNV | Missense_Mutation | novel | c.1397N>A | p.Arg466Gln | p.R466Q | Q86UR1 | protein_coding | tolerated(0.18) | benign(0.127) | TCGA-AJ-A3BG-01 | Endometrium | uterine corpus endometrioid carcinoma | Female | >=65 | I/II | Chemotherapy | carboplatin | PD |
| NOXA1 | SNV | Missense_Mutation | rs756331723 | c.215N>T | p.Ala72Val | p.A72V | Q86UR1 | protein_coding | deleterious(0) | probably_damaging(1) | TCGA-AP-A0LM-01 | Endometrium | uterine corpus endometrioid carcinoma | Female | <65 | III/IV | Chemotherapy | cisplatin | SD |
| Page: 1 2 3 |
Top |
Related drugs of malignant transformation related genes |
| Identification of chemicals and drugs interact with genes involved in malignant transfromation |
| (DGIdb 4.0) |
| Entrez ID | Symbol | Category | Interaction Types | Drug Claim Name | Drug Name | PMIDs |
| Page: 1 |

Copyright 2023-Present -The University of Texas Health Science Center at Houston |