
|
|||||
|
 | |
| |
| |
| |
| |
| |
|
Gene: NOV |
Gene summary for NOV |
| Gene information | Species | Human | Gene symbol | NOV | Gene ID | 6134 |
| Gene name | ribosomal protein L10 | |
| Gene Alias | AUTSX5 | |
| Cytomap | Xq28 | |
| Gene Type | protein-coding | GO ID | GO:0000027 | UniProtAcc | P27635 |
Top |
Malignant transformation analysis |
| Identification of the aberrant gene expression in precancerous and cancerous lesions by comparing the gene expression of stem-like cells in diseased tissues with normal stem cells |
| Entrez ID | Symbol | Replicates | Species | Organ | Tissue | Adj P-value | Log2FC | Malignancy |
| 6134 | NOV | P2T-E | Human | Esophagus | ESCC | 2.24e-03 | 1.02e-01 | 0.1177 |
| 6134 | NOV | P4T-E | Human | Esophagus | ESCC | 1.53e-04 | 6.63e-01 | 0.1323 |
| 6134 | NOV | P8T-E | Human | Esophagus | ESCC | 7.20e-04 | 1.62e-01 | 0.0889 |
| 6134 | NOV | P10T-E | Human | Esophagus | ESCC | 7.48e-14 | 3.35e-01 | 0.116 |
| 6134 | NOV | P11T-E | Human | Esophagus | ESCC | 1.73e-10 | 2.82e+00 | 0.1426 |
| 6134 | NOV | P12T-E | Human | Esophagus | ESCC | 3.93e-11 | 5.12e-01 | 0.1122 |
| 6134 | NOV | P16T-E | Human | Esophagus | ESCC | 2.49e-20 | 6.58e-01 | 0.1153 |
| 6134 | NOV | P19T-E | Human | Esophagus | ESCC | 6.02e-08 | 2.16e+00 | 0.1662 |
| 6134 | NOV | P20T-E | Human | Esophagus | ESCC | 1.91e-02 | 3.53e-01 | 0.1124 |
| 6134 | NOV | P22T-E | Human | Esophagus | ESCC | 6.52e-08 | 2.41e-01 | 0.1236 |
| 6134 | NOV | P24T-E | Human | Esophagus | ESCC | 4.09e-04 | 2.20e+00 | 0.1287 |
| 6134 | NOV | P26T-E | Human | Esophagus | ESCC | 5.22e-03 | 2.55e-01 | 0.1276 |
| 6134 | NOV | P30T-E | Human | Esophagus | ESCC | 2.68e-11 | 8.86e-01 | 0.137 |
| 6134 | NOV | P31T-E | Human | Esophagus | ESCC | 1.99e-65 | 1.92e+00 | 0.1251 |
| 6134 | NOV | P32T-E | Human | Esophagus | ESCC | 2.06e-40 | 2.00e+00 | 0.1666 |
| 6134 | NOV | P52T-E | Human | Esophagus | ESCC | 1.71e-10 | 5.39e-01 | 0.1555 |
| 6134 | NOV | P54T-E | Human | Esophagus | ESCC | 8.26e-04 | 4.62e-01 | 0.0975 |
| 6134 | NOV | P61T-E | Human | Esophagus | ESCC | 3.80e-09 | 5.80e-01 | 0.099 |
| 6134 | NOV | P62T-E | Human | Esophagus | ESCC | 4.58e-25 | 1.02e+00 | 0.1302 |
| 6134 | NOV | P74T-E | Human | Esophagus | ESCC | 3.31e-02 | 3.06e-01 | 0.1479 |
| Page: 1 2 |
| Tissue | Expression Dynamics | Abbreviation |
| Esophagus | 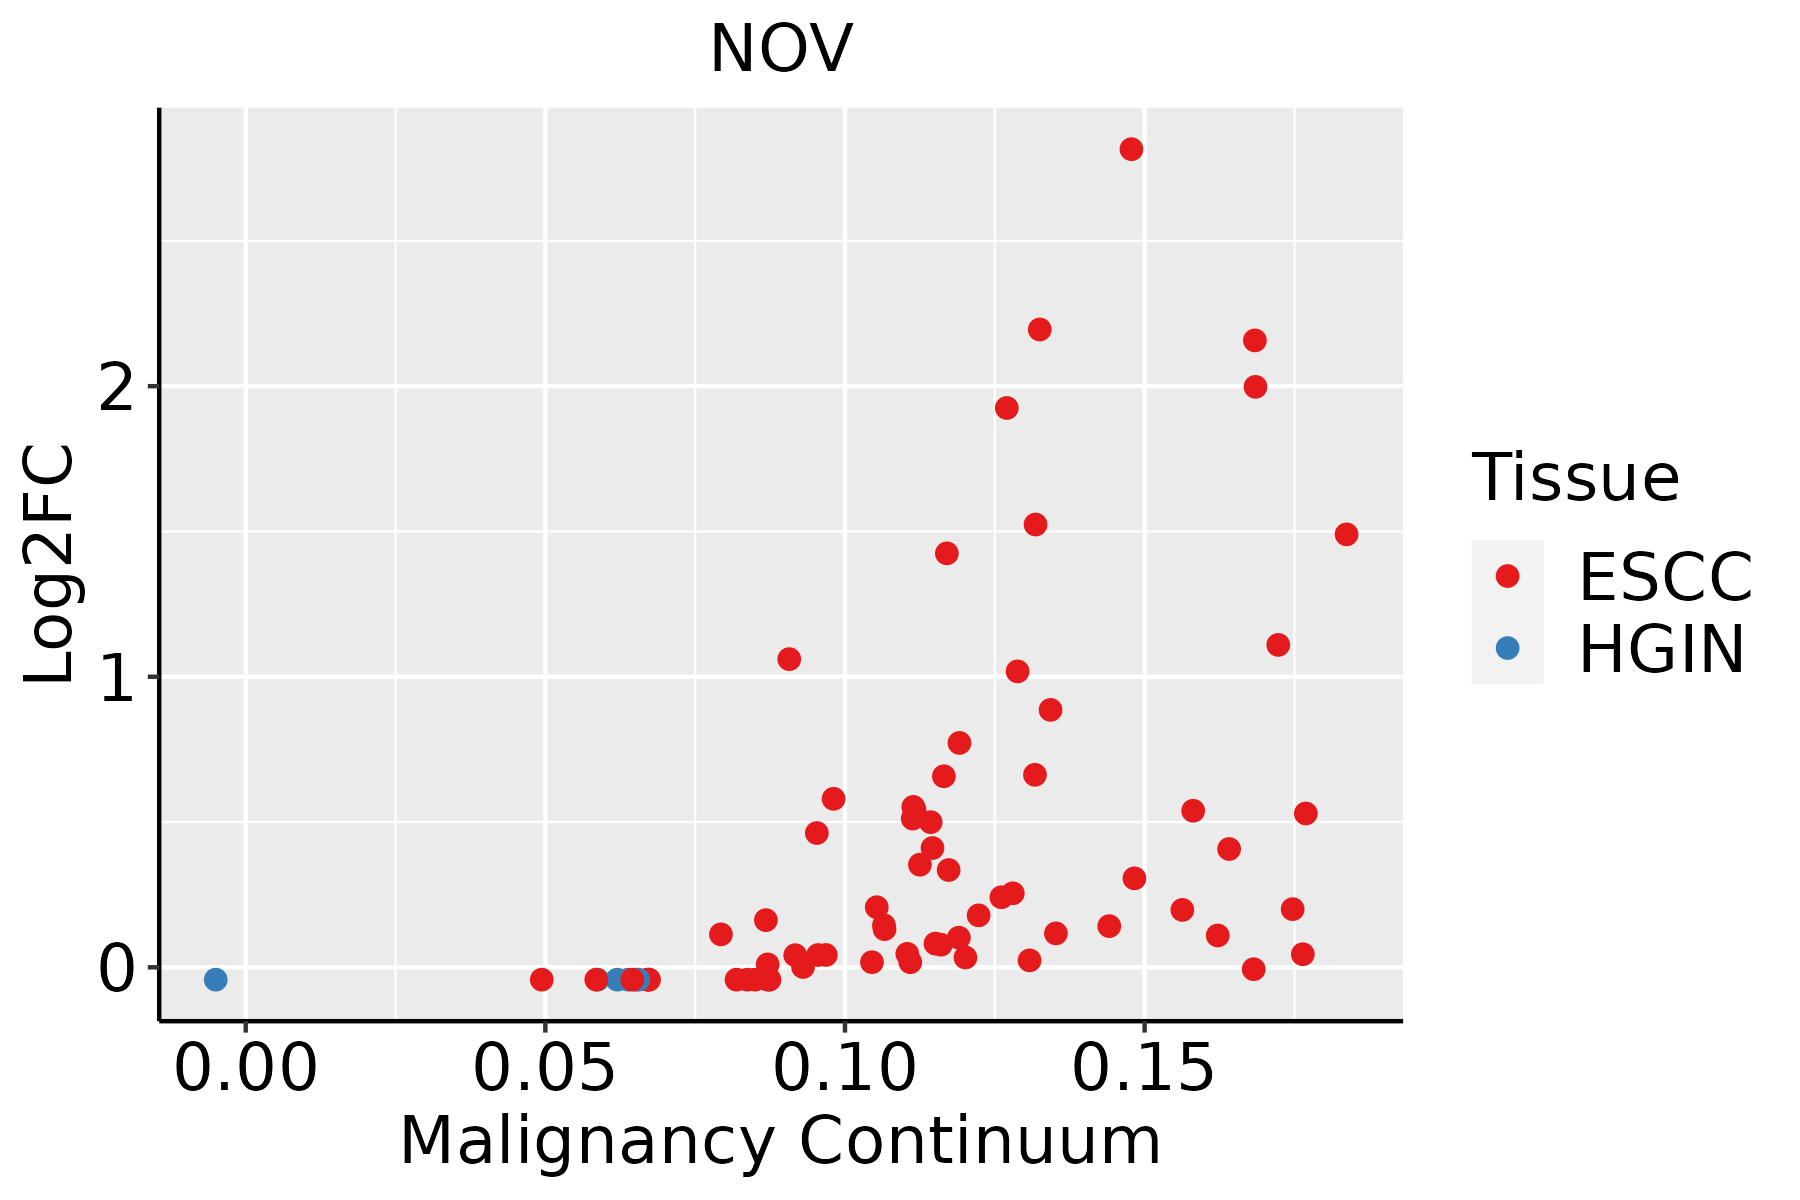 | ESCC: Esophageal squamous cell carcinoma |
| HGIN: High-grade intraepithelial neoplasias | ||
| LGIN: Low-grade intraepithelial neoplasias | ||
| Oral Cavity | 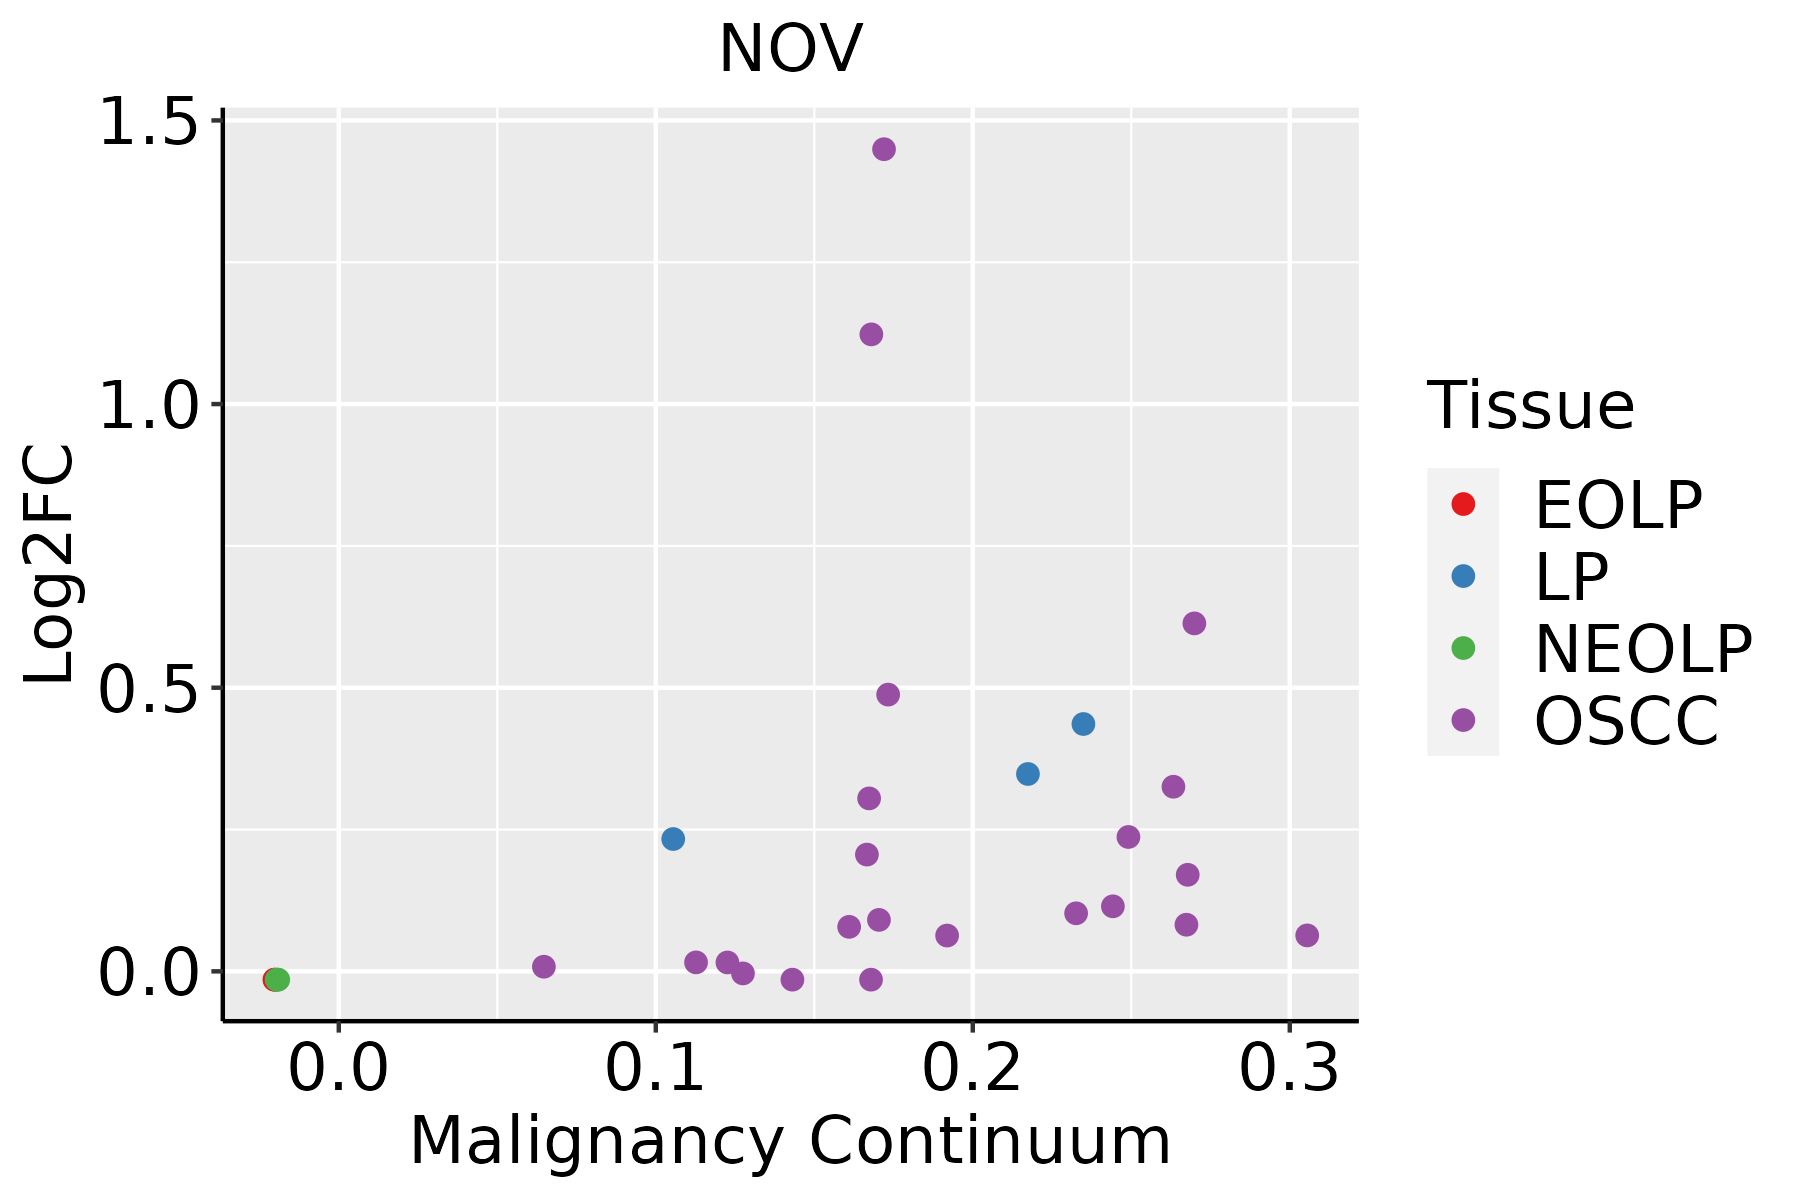 | EOLP: Erosive Oral lichen planus |
| LP: leukoplakia | ||
| NEOLP: Non-erosive oral lichen planus | ||
| OSCC: Oral squamous cell carcinoma |
| ∗log2FC in expression of this searched gene in stem-like cells from each diseased tissue sample relative to stem-like cells in normal samples in each tissue plotted against the malignancy continuum. Samples are colored based on if they are from different disease stage. |
Top |
Malignant transformation related pathway analysis |
| Find out the enriched GO biological processes and KEGG pathways involved in transition from healthy to precancer to cancer |
| Tissue | Disease Stage | Enriched GO biological Processes |
| Colorectum | AD |  |
| Colorectum | SER |  |
| Colorectum | MSS |  |
| Colorectum | MSI-H |  |
| Colorectum | FAP |  |
| ∗Top 15 enriched GO BP terms are showed in the bar plot of each disease state in each tissue. Each row represents a significant GO biological process which is colored according to the -log10(p.adjust). |
| Page: 1 2 3 4 5 6 7 8 9 |
| GO ID | Tissue | Disease Stage | Description | Gene Ratio | Bg Ratio | pvalue | p.adjust | Count |
| GO:00083809 | Breast | Precancer | RNA splicing | 65/1080 | 434/18723 | 1.27e-12 | 2.53e-10 | 65 |
| GO:00434849 | Breast | Precancer | regulation of RNA splicing | 34/1080 | 148/18723 | 2.66e-12 | 4.75e-10 | 34 |
| GO:00003759 | Breast | Precancer | RNA splicing, via transesterification reactions | 52/1080 | 324/18723 | 1.74e-11 | 2.22e-09 | 52 |
| GO:00003779 | Breast | Precancer | RNA splicing, via transesterification reactions with bulged adenosine as nucleophile | 51/1080 | 320/18723 | 3.55e-11 | 4.04e-09 | 51 |
| GO:00003989 | Breast | Precancer | mRNA splicing, via spliceosome | 51/1080 | 320/18723 | 3.55e-11 | 4.04e-09 | 51 |
| GO:00480249 | Breast | Precancer | regulation of mRNA splicing, via spliceosome | 22/1080 | 101/18723 | 5.29e-08 | 3.18e-06 | 22 |
| GO:19033118 | Breast | Precancer | regulation of mRNA metabolic process | 38/1080 | 288/18723 | 1.63e-06 | 5.97e-05 | 38 |
| GO:00506848 | Breast | Precancer | regulation of mRNA processing | 23/1080 | 137/18723 | 3.49e-06 | 1.13e-04 | 23 |
| GO:00003808 | Breast | Precancer | alternative mRNA splicing, via spliceosome | 15/1080 | 77/18723 | 2.86e-05 | 6.37e-04 | 15 |
| GO:00003818 | Breast | Precancer | regulation of alternative mRNA splicing, via spliceosome | 13/1080 | 60/18723 | 2.98e-05 | 6.58e-04 | 13 |
| GO:000838014 | Breast | IDC | RNA splicing | 73/1434 | 434/18723 | 1.27e-10 | 1.57e-08 | 73 |
| GO:004348414 | Breast | IDC | regulation of RNA splicing | 36/1434 | 148/18723 | 3.32e-10 | 3.77e-08 | 36 |
| GO:000037514 | Breast | IDC | RNA splicing, via transesterification reactions | 58/1434 | 324/18723 | 9.44e-10 | 9.58e-08 | 58 |
| GO:000037714 | Breast | IDC | RNA splicing, via transesterification reactions with bulged adenosine as nucleophile | 57/1434 | 320/18723 | 1.60e-09 | 1.49e-07 | 57 |
| GO:000039814 | Breast | IDC | mRNA splicing, via spliceosome | 57/1434 | 320/18723 | 1.60e-09 | 1.49e-07 | 57 |
| GO:004802414 | Breast | IDC | regulation of mRNA splicing, via spliceosome | 23/1434 | 101/18723 | 1.74e-06 | 7.28e-05 | 23 |
| GO:005068413 | Breast | IDC | regulation of mRNA processing | 24/1434 | 137/18723 | 1.09e-04 | 2.04e-03 | 24 |
| GO:190331113 | Breast | IDC | regulation of mRNA metabolic process | 40/1434 | 288/18723 | 1.79e-04 | 3.01e-03 | 40 |
| GO:000038113 | Breast | IDC | regulation of alternative mRNA splicing, via spliceosome | 13/1434 | 60/18723 | 5.09e-04 | 6.65e-03 | 13 |
| GO:000038013 | Breast | IDC | alternative mRNA splicing, via spliceosome | 15/1434 | 77/18723 | 6.51e-04 | 8.04e-03 | 15 |
| Page: 1 2 3 4 |
| Pathway ID | Tissue | Disease Stage | Description | Gene Ratio | Bg Ratio | pvalue | p.adjust | qvalue | Count |
| hsa0301018 | Breast | Precancer | Ribosome | 80/684 | 167/8465 | 7.33e-44 | 2.32e-41 | 1.77e-41 | 80 |
| hsa0517118 | Breast | Precancer | Coronavirus disease - COVID-19 | 81/684 | 232/8465 | 3.74e-32 | 2.36e-30 | 1.81e-30 | 81 |
| hsa0301019 | Breast | Precancer | Ribosome | 80/684 | 167/8465 | 7.33e-44 | 2.32e-41 | 1.77e-41 | 80 |
| hsa0517119 | Breast | Precancer | Coronavirus disease - COVID-19 | 81/684 | 232/8465 | 3.74e-32 | 2.36e-30 | 1.81e-30 | 81 |
| hsa0301024 | Breast | IDC | Ribosome | 83/867 | 167/8465 | 6.07e-39 | 9.87e-37 | 7.38e-37 | 83 |
| hsa0517124 | Breast | IDC | Coronavirus disease - COVID-19 | 86/867 | 232/8465 | 1.50e-28 | 9.72e-27 | 7.27e-27 | 86 |
| hsa0301034 | Breast | IDC | Ribosome | 83/867 | 167/8465 | 6.07e-39 | 9.87e-37 | 7.38e-37 | 83 |
| hsa0517134 | Breast | IDC | Coronavirus disease - COVID-19 | 86/867 | 232/8465 | 1.50e-28 | 9.72e-27 | 7.27e-27 | 86 |
| hsa0301044 | Breast | DCIS | Ribosome | 82/846 | 167/8465 | 8.69e-39 | 1.40e-36 | 1.03e-36 | 82 |
| hsa0517144 | Breast | DCIS | Coronavirus disease - COVID-19 | 86/846 | 232/8465 | 2.42e-29 | 1.56e-27 | 1.15e-27 | 86 |
| hsa0301054 | Breast | DCIS | Ribosome | 82/846 | 167/8465 | 8.69e-39 | 1.40e-36 | 1.03e-36 | 82 |
| hsa0517154 | Breast | DCIS | Coronavirus disease - COVID-19 | 86/846 | 232/8465 | 2.42e-29 | 1.56e-27 | 1.15e-27 | 86 |
| hsa0517120 | Cervix | CC | Coronavirus disease - COVID-19 | 111/1267 | 232/8465 | 1.82e-33 | 5.90e-31 | 3.49e-31 | 111 |
| hsa0301020 | Cervix | CC | Ribosome | 85/1267 | 167/8465 | 3.17e-28 | 5.14e-26 | 3.04e-26 | 85 |
| hsa05171110 | Cervix | CC | Coronavirus disease - COVID-19 | 111/1267 | 232/8465 | 1.82e-33 | 5.90e-31 | 3.49e-31 | 111 |
| hsa03010110 | Cervix | CC | Ribosome | 85/1267 | 167/8465 | 3.17e-28 | 5.14e-26 | 3.04e-26 | 85 |
| hsa0301025 | Cervix | HSIL_HPV | Ribosome | 80/459 | 167/8465 | 9.61e-58 | 2.82e-55 | 2.28e-55 | 80 |
| hsa0517125 | Cervix | HSIL_HPV | Coronavirus disease - COVID-19 | 91/459 | 232/8465 | 2.14e-56 | 3.13e-54 | 2.53e-54 | 91 |
| hsa0301035 | Cervix | HSIL_HPV | Ribosome | 80/459 | 167/8465 | 9.61e-58 | 2.82e-55 | 2.28e-55 | 80 |
| hsa0517135 | Cervix | HSIL_HPV | Coronavirus disease - COVID-19 | 91/459 | 232/8465 | 2.14e-56 | 3.13e-54 | 2.53e-54 | 91 |
| Page: 1 2 3 4 5 6 7 |
Top |
Cell-cell communication analysis |
| Identification of potential cell-cell interactions between two cell types and their ligand-receptor pairs for different disease states |
| Ligand | Receptor | LRpair | Pathway | Tissue | Disease Stage |
| Page: 1 |
Top |
Single-cell gene regulatory network inference analysis |
| Find out the significant the regulons (TFs) and the target genes of each regulon across cell types for different disease states |
| TF | Cell Type | Tissue | Disease Stage | Target Gene | RSS | Regulon Activity |
| ∗The dot plots of a searched regulon are shown for all cell subpopulations in each disease state of each tissue based on the regulon specific score inferred using pySCENIC and by calculating the average expression. |
| Page: 1 |
Top |
Somatic mutation of malignant transformation related genes |
| Annotation of somatic variants for genes involved in malignant transformation |
| Hugo Symbol | Variant Class | Variant Classification | dbSNP RS | HGVSc | HGVSp | HGVSp Short | SWISSPROT | BIOTYPE | SIFT | PolyPhen | Tumor Sample Barcode | Tissue | Histology | Sex | Age | Stage | Therapy Types | Drugs | Outcome |
| NOV | SNV | Missense_Mutation | c.655N>T | p.Ser219Cys | p.S219C | P48745 | protein_coding | deleterious(0) | probably_damaging(0.947) | TCGA-A1-A0SO-01 | Breast | breast invasive carcinoma | Female | >=65 | I/II | Chemotherapy | SD | ||
| NOV | SNV | Missense_Mutation | novel | c.427N>T | p.Arg143Cys | p.R143C | P48745 | protein_coding | deleterious(0.01) | probably_damaging(0.993) | TCGA-A2-A3XY-01 | Breast | breast invasive carcinoma | Female | <65 | I/II | Chemotherapy | adriamycin | PD |
| NOV | SNV | Missense_Mutation | c.706G>A | p.Glu236Lys | p.E236K | P48745 | protein_coding | tolerated(0.24) | benign(0.187) | TCGA-A8-A095-01 | Breast | breast invasive carcinoma | Female | <65 | I/II | Chemotherapy | 5-fluorouracil | CR | |
| NOV | SNV | Missense_Mutation | rs774463585 | c.272N>A | p.Arg91His | p.R91H | P48745 | protein_coding | tolerated(0.13) | possibly_damaging(0.681) | TCGA-AR-A0TY-01 | Breast | breast invasive carcinoma | Female | <65 | I/II | Unspecific | Paclitaxel | PD |
| NOV | SNV | Missense_Mutation | c.280N>C | p.Asp94His | p.D94H | P48745 | protein_coding | tolerated(0.17) | possibly_damaging(0.888) | TCGA-C8-A1HM-01 | Breast | breast invasive carcinoma | Female | >=65 | I/II | Chemotherapy | doxorubicin | CR | |
| NOV | deletion | Frame_Shift_Del | c.427delC | p.Arg143AlafsTer53 | p.R143Afs*53 | P48745 | protein_coding | TCGA-AN-A0AK-01 | Breast | breast invasive carcinoma | Female | >=65 | I/II | Unknown | Unknown | SD | |||
| NOV | SNV | Missense_Mutation | novel | c.56N>A | p.Thr19Asn | p.T19N | P48745 | protein_coding | tolerated(0.19) | benign(0.003) | TCGA-AA-3862-01 | Colorectum | colon adenocarcinoma | Male | >=65 | I/II | Unknown | Unknown | SD |
| NOV | SNV | Missense_Mutation | c.481G>C | p.Val161Leu | p.V161L | P48745 | protein_coding | deleterious(0) | possibly_damaging(0.55) | TCGA-DM-A28C-01 | Colorectum | colon adenocarcinoma | Male | >=65 | I/II | Unknown | Unknown | PD | |
| NOV | SNV | Missense_Mutation | c.274A>T | p.Ser92Cys | p.S92C | P48745 | protein_coding | deleterious(0.02) | benign(0.43) | TCGA-F4-6854-01 | Colorectum | colon adenocarcinoma | Female | >=65 | I/II | Unknown | Unknown | SD | |
| NOV | SNV | Missense_Mutation | c.277G>A | p.Ala93Thr | p.A93T | P48745 | protein_coding | tolerated(0.1) | benign(0.067) | TCGA-G4-6628-01 | Colorectum | colon adenocarcinoma | Male | >=65 | I/II | Unknown | Unknown | SD |
| Page: 1 2 3 4 5 |
Top |
Related drugs of malignant transformation related genes |
| Identification of chemicals and drugs interact with genes involved in malignant transfromation |
| (DGIdb 4.0) |
| Entrez ID | Symbol | Category | Interaction Types | Drug Claim Name | Drug Name | PMIDs |
| Page: 1 |

Copyright 2023-Present -The University of Texas Health Science Center at Houston |