
|
|||||
|
 | |
| |
| |
| |
| |
| |
|
Gene: NOTUM |
Gene summary for NOTUM |
| Gene information | Species | Human | Gene symbol | NOTUM | Gene ID | 147111 |
| Gene name | notum, palmitoleoyl-protein carboxylesterase | |
| Gene Alias | hNOTUM | |
| Cytomap | 17q25.3 | |
| Gene Type | protein-coding | GO ID | GO:0001501 | UniProtAcc | Q6P988 |
Top |
Malignant transformation analysis |
| Identification of the aberrant gene expression in precancerous and cancerous lesions by comparing the gene expression of stem-like cells in diseased tissues with normal stem cells |
| Entrez ID | Symbol | Replicates | Species | Organ | Tissue | Adj P-value | Log2FC | Malignancy |
| 147111 | NOTUM | HTA11_696_2000001011 | Human | Colorectum | AD | 3.61e-02 | 1.31e-01 | -0.1464 |
| 147111 | NOTUM | HTA11_99999971662_82457 | Human | Colorectum | MSS | 9.32e-10 | 3.68e-01 | 0.3859 |
| 147111 | NOTUM | HTA11_99999974143_84620 | Human | Colorectum | MSS | 3.87e-145 | 3.29e+00 | 0.3005 |
| 147111 | NOTUM | F007 | Human | Colorectum | FAP | 3.60e-03 | 2.55e-01 | 0.1176 |
| 147111 | NOTUM | A002-C-021 | Human | Colorectum | FAP | 7.82e-13 | 3.65e-01 | 0.1171 |
| 147111 | NOTUM | A001-C-007 | Human | Colorectum | CRC | 2.02e-14 | 7.12e-01 | 0.1899 |
| 147111 | NOTUM | F072B | Human | Colorectum | FAP | 1.96e-10 | 4.89e-01 | 0.257 |
| 147111 | NOTUM | CRC-1-8810 | Human | Colorectum | CRC | 2.14e-33 | 8.12e-01 | 0.6257 |
| 147111 | NOTUM | HCC1 | Human | Liver | HCC | 5.52e-27 | 5.26e+00 | 0.5336 |
| 147111 | NOTUM | S014 | Human | Liver | HCC | 5.59e-90 | 4.88e+00 | 0.2254 |
| 147111 | NOTUM | S015 | Human | Liver | HCC | 1.72e-74 | 4.93e+00 | 0.2375 |
| 147111 | NOTUM | S016 | Human | Liver | HCC | 5.81e-105 | 4.63e+00 | 0.2243 |
| Page: 1 |
| Tissue | Expression Dynamics | Abbreviation |
| Colorectum (GSE201348) | 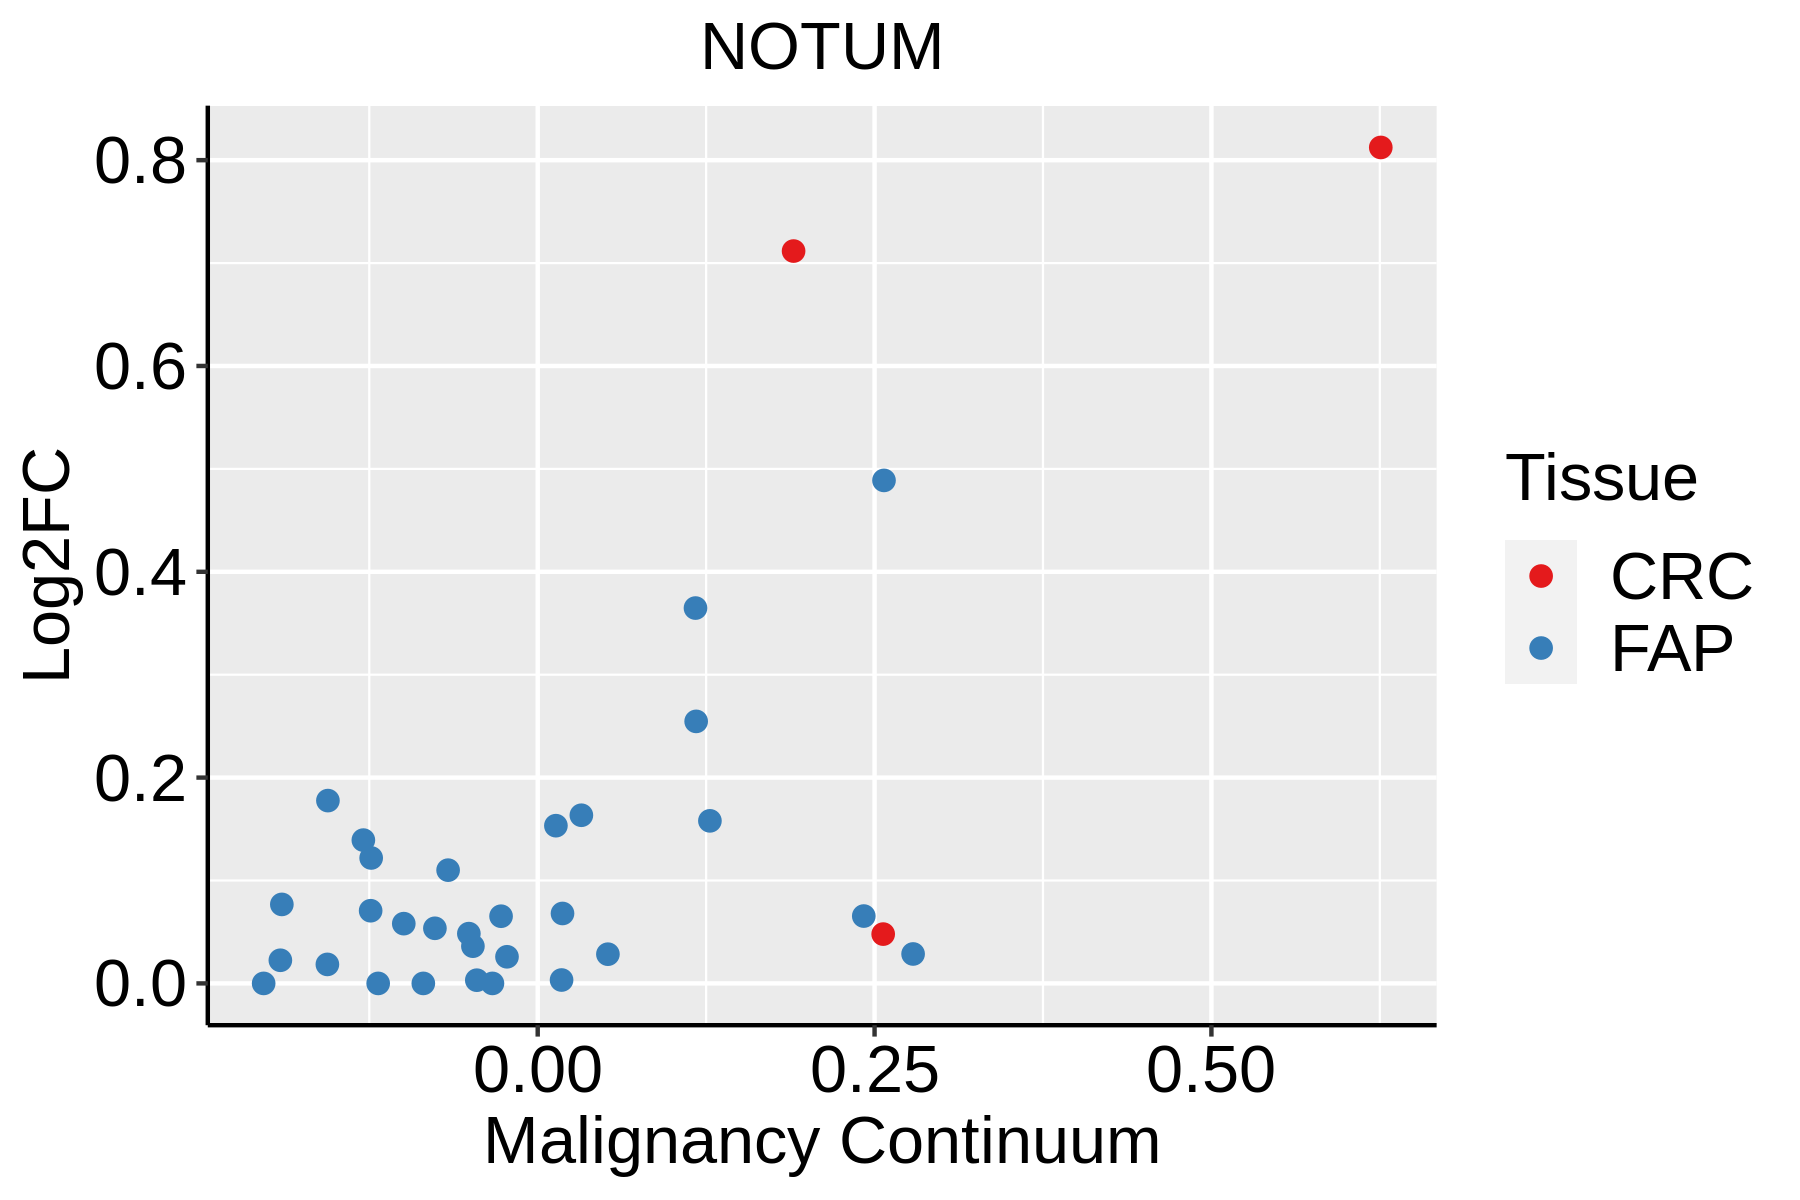 | FAP: Familial adenomatous polyposis |
| CRC: Colorectal cancer | ||
| Colorectum (HTA11) |  | AD: Adenomas |
| SER: Sessile serrated lesions | ||
| MSI-H: Microsatellite-high colorectal cancer | ||
| MSS: Microsatellite stable colorectal cancer | ||
| Liver | 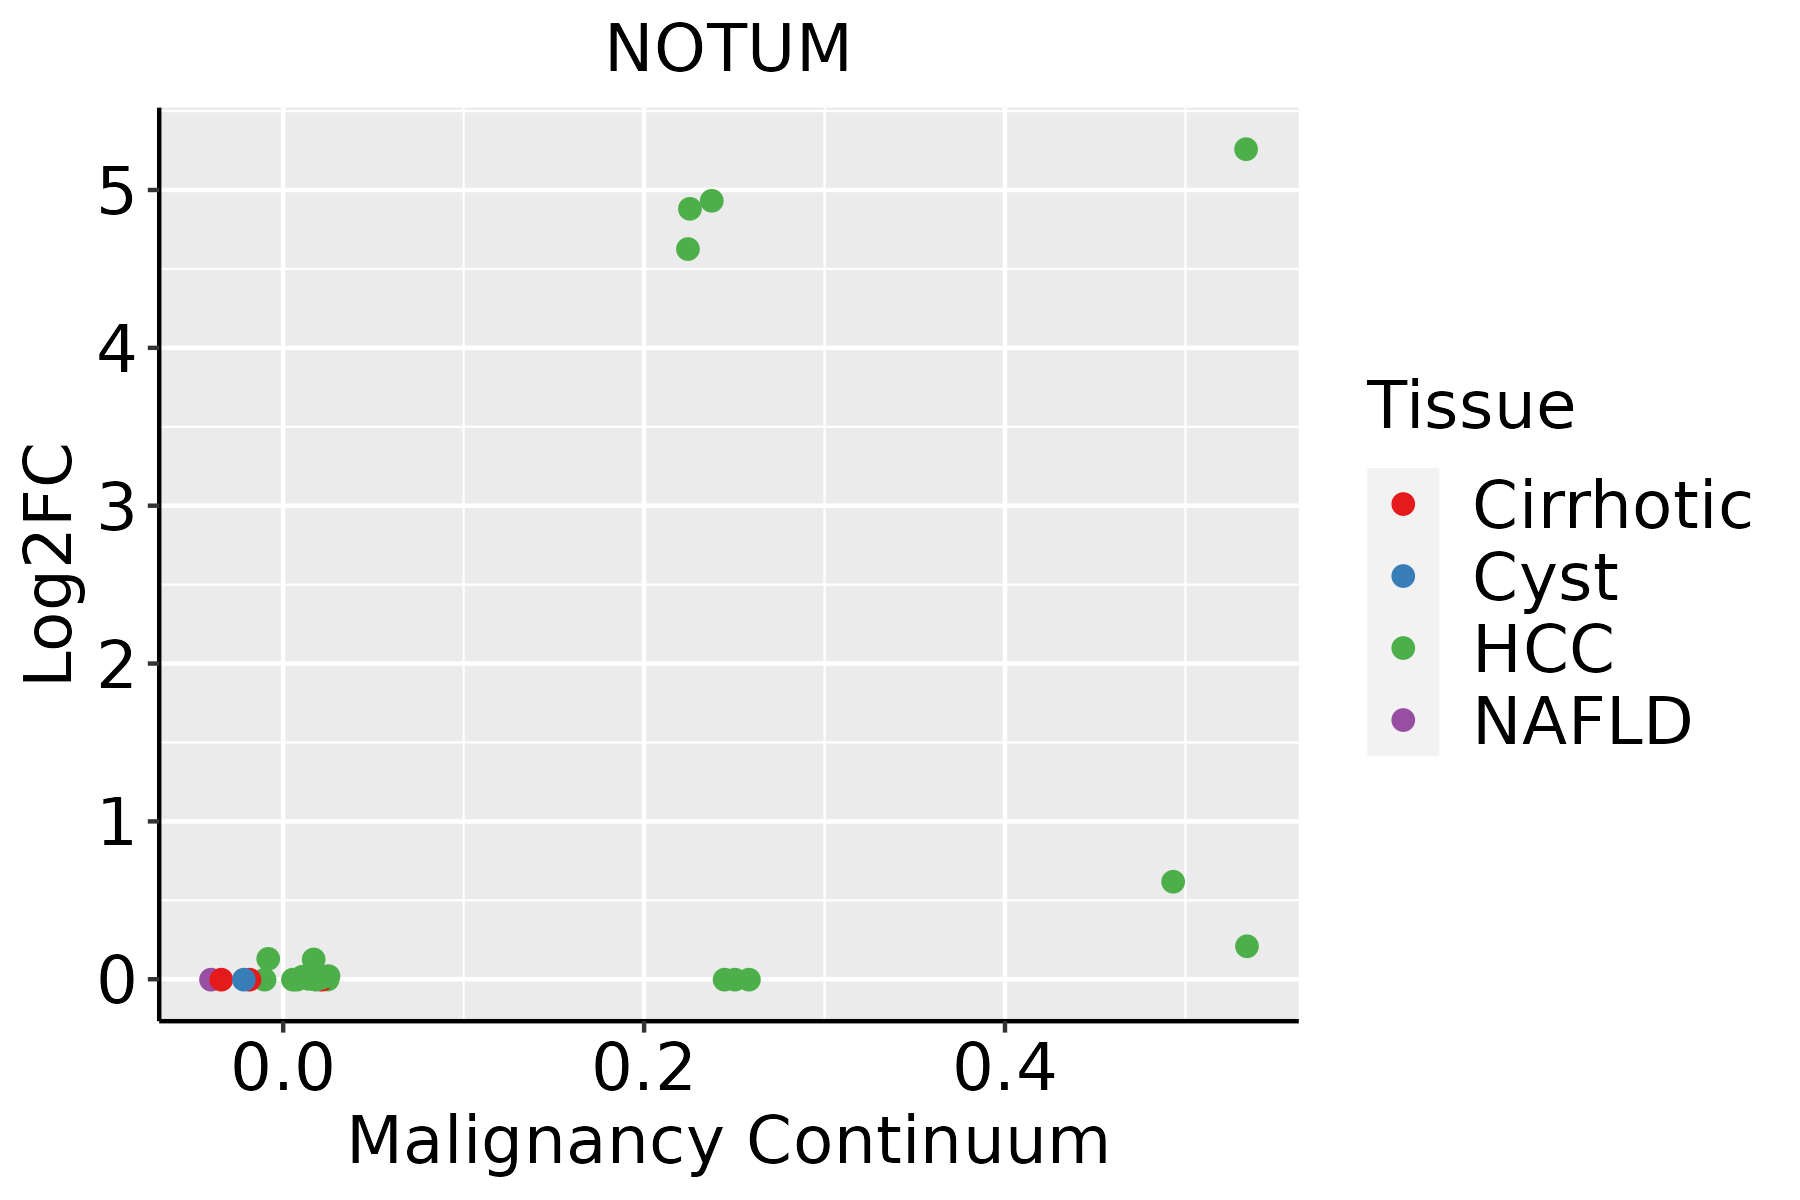 | HCC: Hepatocellular carcinoma |
| NAFLD: Non-alcoholic fatty liver disease |
| ∗log2FC in expression of this searched gene in stem-like cells from each diseased tissue sample relative to stem-like cells in normal samples in each tissue plotted against the malignancy continuum. Samples are colored based on if they are from different disease stage. |
Top |
Malignant transformation related pathway analysis |
| Find out the enriched GO biological processes and KEGG pathways involved in transition from healthy to precancer to cancer |
| Tissue | Disease Stage | Enriched GO biological Processes |
| Colorectum | AD |  |
| Colorectum | SER |  |
| Colorectum | MSS |  |
| Colorectum | MSI-H |  |
| Colorectum | FAP |  |
| ∗Top 15 enriched GO BP terms are showed in the bar plot of each disease state in each tissue. Each row represents a significant GO biological process which is colored according to the -log10(p.adjust). |
| Page: 1 2 3 4 5 6 7 8 9 |
| GO ID | Tissue | Disease Stage | Description | Gene Ratio | Bg Ratio | pvalue | p.adjust | Count |
| GO:0030111 | Colorectum | AD | regulation of Wnt signaling pathway | 102/3918 | 328/18723 | 8.51e-06 | 2.03e-04 | 102 |
| GO:0016055 | Colorectum | AD | Wnt signaling pathway | 130/3918 | 444/18723 | 1.60e-05 | 3.37e-04 | 130 |
| GO:0198738 | Colorectum | AD | cell-cell signaling by wnt | 130/3918 | 446/18723 | 2.02e-05 | 4.10e-04 | 130 |
| GO:0060070 | Colorectum | AD | canonical Wnt signaling pathway | 90/3918 | 303/18723 | 1.76e-04 | 2.38e-03 | 90 |
| GO:0060828 | Colorectum | AD | regulation of canonical Wnt signaling pathway | 77/3918 | 253/18723 | 2.19e-04 | 2.87e-03 | 77 |
| GO:0001503 | Colorectum | AD | ossification | 106/3918 | 408/18723 | 7.68e-03 | 4.64e-02 | 106 |
| GO:00301112 | Colorectum | MSS | regulation of Wnt signaling pathway | 98/3467 | 328/18723 | 3.37e-07 | 1.36e-05 | 98 |
| GO:00160552 | Colorectum | MSS | Wnt signaling pathway | 124/3467 | 444/18723 | 6.06e-07 | 2.26e-05 | 124 |
| GO:01987382 | Colorectum | MSS | cell-cell signaling by wnt | 124/3467 | 446/18723 | 7.83e-07 | 2.77e-05 | 124 |
| GO:00600702 | Colorectum | MSS | canonical Wnt signaling pathway | 86/3467 | 303/18723 | 1.58e-05 | 3.56e-04 | 86 |
| GO:00608282 | Colorectum | MSS | regulation of canonical Wnt signaling pathway | 74/3467 | 253/18723 | 1.99e-05 | 4.26e-04 | 74 |
| GO:0030178 | Colorectum | MSS | negative regulation of Wnt signaling pathway | 48/3467 | 170/18723 | 1.23e-03 | 1.18e-02 | 48 |
| GO:00015032 | Colorectum | MSS | ossification | 96/3467 | 408/18723 | 6.09e-03 | 4.07e-02 | 96 |
| GO:00160553 | Colorectum | FAP | Wnt signaling pathway | 104/2622 | 444/18723 | 4.92e-08 | 3.92e-06 | 104 |
| GO:01987383 | Colorectum | FAP | cell-cell signaling by wnt | 104/2622 | 446/18723 | 6.26e-08 | 4.54e-06 | 104 |
| GO:00301113 | Colorectum | FAP | regulation of Wnt signaling pathway | 81/2622 | 328/18723 | 1.44e-07 | 9.03e-06 | 81 |
| GO:00608283 | Colorectum | FAP | regulation of canonical Wnt signaling pathway | 62/2622 | 253/18723 | 5.26e-06 | 1.69e-04 | 62 |
| GO:00600703 | Colorectum | FAP | canonical Wnt signaling pathway | 71/2622 | 303/18723 | 6.23e-06 | 1.96e-04 | 71 |
| GO:00015033 | Colorectum | FAP | ossification | 79/2622 | 408/18723 | 1.53e-03 | 1.37e-02 | 79 |
| GO:00301781 | Colorectum | FAP | negative regulation of Wnt signaling pathway | 38/2622 | 170/18723 | 2.06e-03 | 1.70e-02 | 38 |
| Page: 1 2 |
| Pathway ID | Tissue | Disease Stage | Description | Gene Ratio | Bg Ratio | pvalue | p.adjust | qvalue | Count |
| hsa04310 | Colorectum | AD | Wnt signaling pathway | 56/2092 | 171/8465 | 1.03e-02 | 3.93e-02 | 2.51e-02 | 56 |
| hsa043101 | Colorectum | AD | Wnt signaling pathway | 56/2092 | 171/8465 | 1.03e-02 | 3.93e-02 | 2.51e-02 | 56 |
| hsa043102 | Colorectum | MSS | Wnt signaling pathway | 53/1875 | 171/8465 | 4.24e-03 | 1.86e-02 | 1.14e-02 | 53 |
| hsa043103 | Colorectum | MSS | Wnt signaling pathway | 53/1875 | 171/8465 | 4.24e-03 | 1.86e-02 | 1.14e-02 | 53 |
| hsa043104 | Colorectum | FAP | Wnt signaling pathway | 46/1404 | 171/8465 | 3.94e-04 | 3.06e-03 | 1.86e-03 | 46 |
| hsa043105 | Colorectum | FAP | Wnt signaling pathway | 46/1404 | 171/8465 | 3.94e-04 | 3.06e-03 | 1.86e-03 | 46 |
| hsa043106 | Colorectum | CRC | Wnt signaling pathway | 40/1091 | 171/8465 | 1.01e-04 | 1.57e-03 | 1.07e-03 | 40 |
| hsa043107 | Colorectum | CRC | Wnt signaling pathway | 40/1091 | 171/8465 | 1.01e-04 | 1.57e-03 | 1.07e-03 | 40 |
| Page: 1 |
Top |
Cell-cell communication analysis |
| Identification of potential cell-cell interactions between two cell types and their ligand-receptor pairs for different disease states |
| Ligand | Receptor | LRpair | Pathway | Tissue | Disease Stage |
| Page: 1 |
Top |
Single-cell gene regulatory network inference analysis |
| Find out the significant the regulons (TFs) and the target genes of each regulon across cell types for different disease states |
| TF | Cell Type | Tissue | Disease Stage | Target Gene | RSS | Regulon Activity |
| ∗The dot plots of a searched regulon are shown for all cell subpopulations in each disease state of each tissue based on the regulon specific score inferred using pySCENIC and by calculating the average expression. |
| Page: 1 |
Top |
Somatic mutation of malignant transformation related genes |
| Annotation of somatic variants for genes involved in malignant transformation |
| Hugo Symbol | Variant Class | Variant Classification | dbSNP RS | HGVSc | HGVSp | HGVSp Short | SWISSPROT | BIOTYPE | SIFT | PolyPhen | Tumor Sample Barcode | Tissue | Histology | Sex | Age | Stage | Therapy Types | Drugs | Outcome |
| NOTUM | SNV | Missense_Mutation | c.697N>A | p.Ala233Thr | p.A233T | Q6P988 | protein_coding | deleterious(0) | probably_damaging(1) | TCGA-A1-A0SJ-01 | Breast | breast invasive carcinoma | Female | <65 | III/IV | Unknown | Unknown | SD | |
| NOTUM | SNV | Missense_Mutation | c.913N>T | p.Arg305Cys | p.R305C | Q6P988 | protein_coding | deleterious(0.02) | probably_damaging(0.91) | TCGA-BH-A18G-01 | Breast | breast invasive carcinoma | Female | >=65 | I/II | Unknown | Unknown | SD | |
| NOTUM | deletion | Frame_Shift_Del | c.1285delN | p.Leu429SerfsTer33 | p.L429Sfs*33 | Q6P988 | protein_coding | TCGA-A8-A09Z-01 | Breast | breast invasive carcinoma | Female | >=65 | I/II | Unknown | Unknown | SD | |||
| NOTUM | insertion | In_Frame_Ins | novel | c.684_685insCTG | p.Leu228dup | p.L228dup | Q6P988 | protein_coding | TCGA-E9-A244-01 | Breast | breast invasive carcinoma | Female | <65 | I/II | Chemotherapy | cyclophosphamide | SD | ||
| NOTUM | SNV | Missense_Mutation | novel | c.259G>A | p.Glu87Lys | p.E87K | Q6P988 | protein_coding | tolerated(0.34) | benign(0.143) | TCGA-C5-A902-01 | Cervix | cervical & endocervical cancer | Female | <65 | I/II | Chemotherapy | cisplatin | SD |
| NOTUM | SNV | Missense_Mutation | novel | c.268N>T | p.Arg90Cys | p.R90C | Q6P988 | protein_coding | deleterious(0) | possibly_damaging(0.877) | TCGA-MY-A5BE-01 | Cervix | cervical & endocervical cancer | Female | <65 | I/II | Unknown | Unknown | SD |
| NOTUM | SNV | Missense_Mutation | novel | c.943N>C | p.Glu315Gln | p.E315Q | Q6P988 | protein_coding | tolerated(0.15) | possibly_damaging(0.479) | TCGA-VS-A8EJ-01 | Cervix | cervical & endocervical cancer | Female | <65 | I/II | Chemotherapy | cisplatin | PD |
| NOTUM | SNV | Missense_Mutation | c.913N>T | p.Arg305Cys | p.R305C | Q6P988 | protein_coding | deleterious(0.02) | probably_damaging(0.91) | TCGA-A6-5665-01 | Colorectum | colon adenocarcinoma | Female | >=65 | I/II | Unknown | Unknown | PD | |
| NOTUM | SNV | Missense_Mutation | c.1409T>C | p.Met470Thr | p.M470T | Q6P988 | protein_coding | deleterious(0) | benign(0.276) | TCGA-A6-6780-01 | Colorectum | colon adenocarcinoma | Male | >=65 | I/II | Unknown | Unknown | SD | |
| NOTUM | SNV | Missense_Mutation | rs772006556 | c.1180N>T | p.Arg394Trp | p.R394W | Q6P988 | protein_coding | deleterious(0) | probably_damaging(0.957) | TCGA-AZ-6601-01 | Colorectum | colon adenocarcinoma | Male | >=65 | I/II | Unknown | Unknown | PD |
| Page: 1 2 3 4 5 |
Top |
Related drugs of malignant transformation related genes |
| Identification of chemicals and drugs interact with genes involved in malignant transfromation |
| (DGIdb 4.0) |
| Entrez ID | Symbol | Category | Interaction Types | Drug Claim Name | Drug Name | PMIDs |
| Page: 1 |

Copyright 2023-Present -The University of Texas Health Science Center at Houston |