
|
|||||
|
 | |
| |
| |
| |
| |
| |
|
Gene: NOTCH3 |
Gene summary for NOTCH3 |
| Gene information | Species | Human | Gene symbol | NOTCH3 | Gene ID | 4854 |
| Gene name | notch receptor 3 | |
| Gene Alias | CADASIL | |
| Cytomap | 19p13.12 | |
| Gene Type | protein-coding | GO ID | GO:0000902 | UniProtAcc | Q9UM47 |
Top |
Malignant transformation analysis |
| Identification of the aberrant gene expression in precancerous and cancerous lesions by comparing the gene expression of stem-like cells in diseased tissues with normal stem cells |
| Entrez ID | Symbol | Replicates | Species | Organ | Tissue | Adj P-value | Log2FC | Malignancy |
| 4854 | NOTCH3 | CCI_1 | Human | Cervix | CC | 4.42e-13 | 7.18e-01 | 0.528 |
| 4854 | NOTCH3 | CCI_3 | Human | Cervix | CC | 6.08e-06 | 5.85e-01 | 0.516 |
| 4854 | NOTCH3 | Tumor | Human | Cervix | CC | 1.56e-20 | 4.26e-01 | 0.1241 |
| 4854 | NOTCH3 | sample3 | Human | Cervix | CC | 4.03e-21 | 4.11e-01 | 0.1387 |
| 4854 | NOTCH3 | T1 | Human | Cervix | CC | 8.72e-08 | 2.99e-01 | 0.0918 |
| 4854 | NOTCH3 | T3 | Human | Cervix | CC | 8.69e-23 | 3.87e-01 | 0.1389 |
| 4854 | NOTCH3 | LZE7T | Human | Esophagus | ESCC | 2.03e-03 | 2.59e-01 | 0.0667 |
| 4854 | NOTCH3 | LZE20T | Human | Esophagus | ESCC | 4.83e-02 | 1.17e-01 | 0.0662 |
| 4854 | NOTCH3 | LZE21T | Human | Esophagus | ESCC | 1.38e-07 | 4.50e-01 | 0.0655 |
| 4854 | NOTCH3 | LZE6T | Human | Esophagus | ESCC | 2.81e-02 | 1.45e-01 | 0.0845 |
| 4854 | NOTCH3 | P1T-E | Human | Esophagus | ESCC | 1.69e-06 | 6.38e-01 | 0.0875 |
| 4854 | NOTCH3 | P4T-E | Human | Esophagus | ESCC | 1.85e-05 | 2.81e-01 | 0.1323 |
| 4854 | NOTCH3 | P5T-E | Human | Esophagus | ESCC | 7.89e-11 | 2.64e-01 | 0.1327 |
| 4854 | NOTCH3 | P8T-E | Human | Esophagus | ESCC | 3.90e-26 | 6.72e-01 | 0.0889 |
| 4854 | NOTCH3 | P9T-E | Human | Esophagus | ESCC | 3.61e-16 | 5.39e-01 | 0.1131 |
| 4854 | NOTCH3 | P12T-E | Human | Esophagus | ESCC | 8.03e-09 | 2.61e-01 | 0.1122 |
| 4854 | NOTCH3 | P15T-E | Human | Esophagus | ESCC | 8.63e-10 | 3.12e-01 | 0.1149 |
| 4854 | NOTCH3 | P17T-E | Human | Esophagus | ESCC | 1.38e-06 | 4.11e-01 | 0.1278 |
| 4854 | NOTCH3 | P22T-E | Human | Esophagus | ESCC | 5.58e-11 | 2.47e-01 | 0.1236 |
| 4854 | NOTCH3 | P23T-E | Human | Esophagus | ESCC | 1.44e-12 | 4.50e-01 | 0.108 |
| Page: 1 2 3 4 |
| Tissue | Expression Dynamics | Abbreviation |
| Cervix | 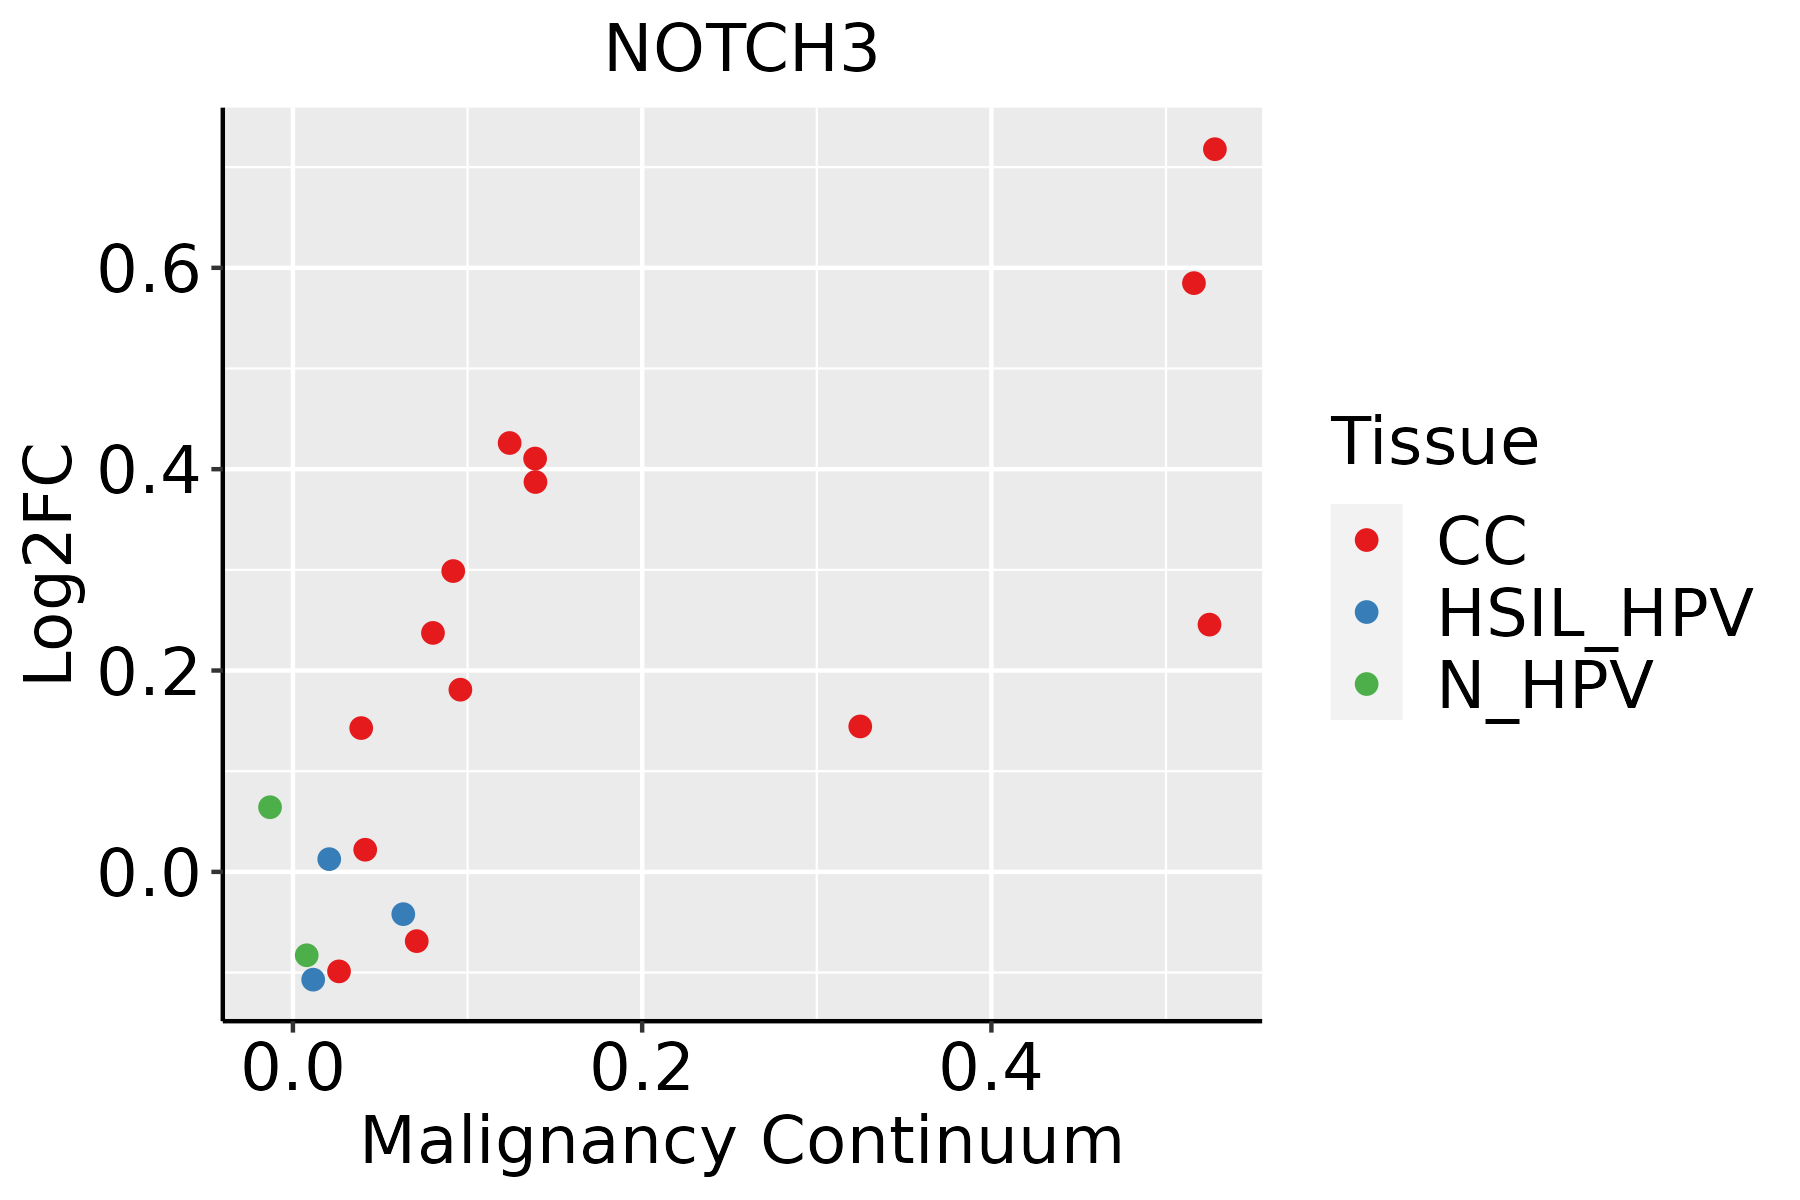 | CC: Cervix cancer |
| HSIL_HPV: HPV-infected high-grade squamous intraepithelial lesions | ||
| N_HPV: HPV-infected normal cervix | ||
| Esophagus |  | ESCC: Esophageal squamous cell carcinoma |
| HGIN: High-grade intraepithelial neoplasias | ||
| LGIN: Low-grade intraepithelial neoplasias | ||
| Oral Cavity | 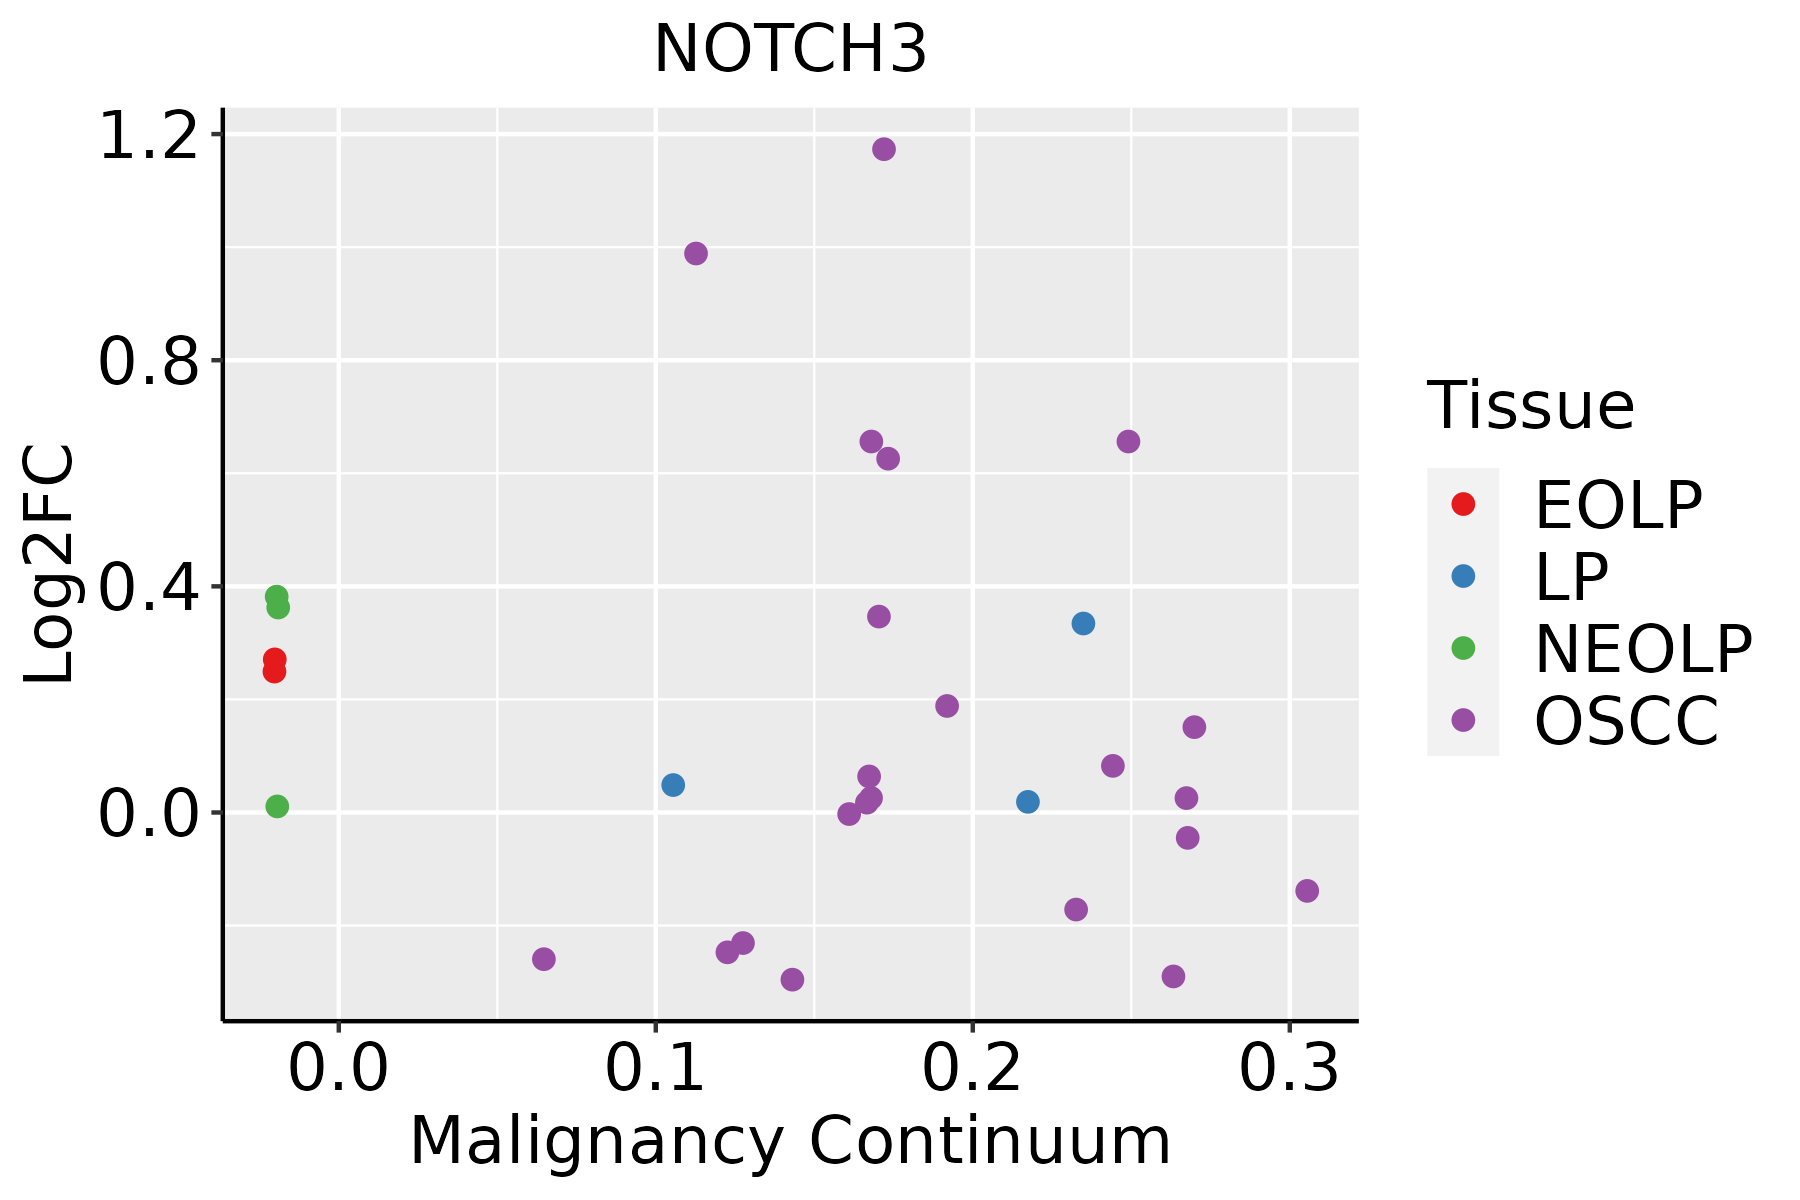 | EOLP: Erosive Oral lichen planus |
| LP: leukoplakia | ||
| NEOLP: Non-erosive oral lichen planus | ||
| OSCC: Oral squamous cell carcinoma | ||
| Thyroid | 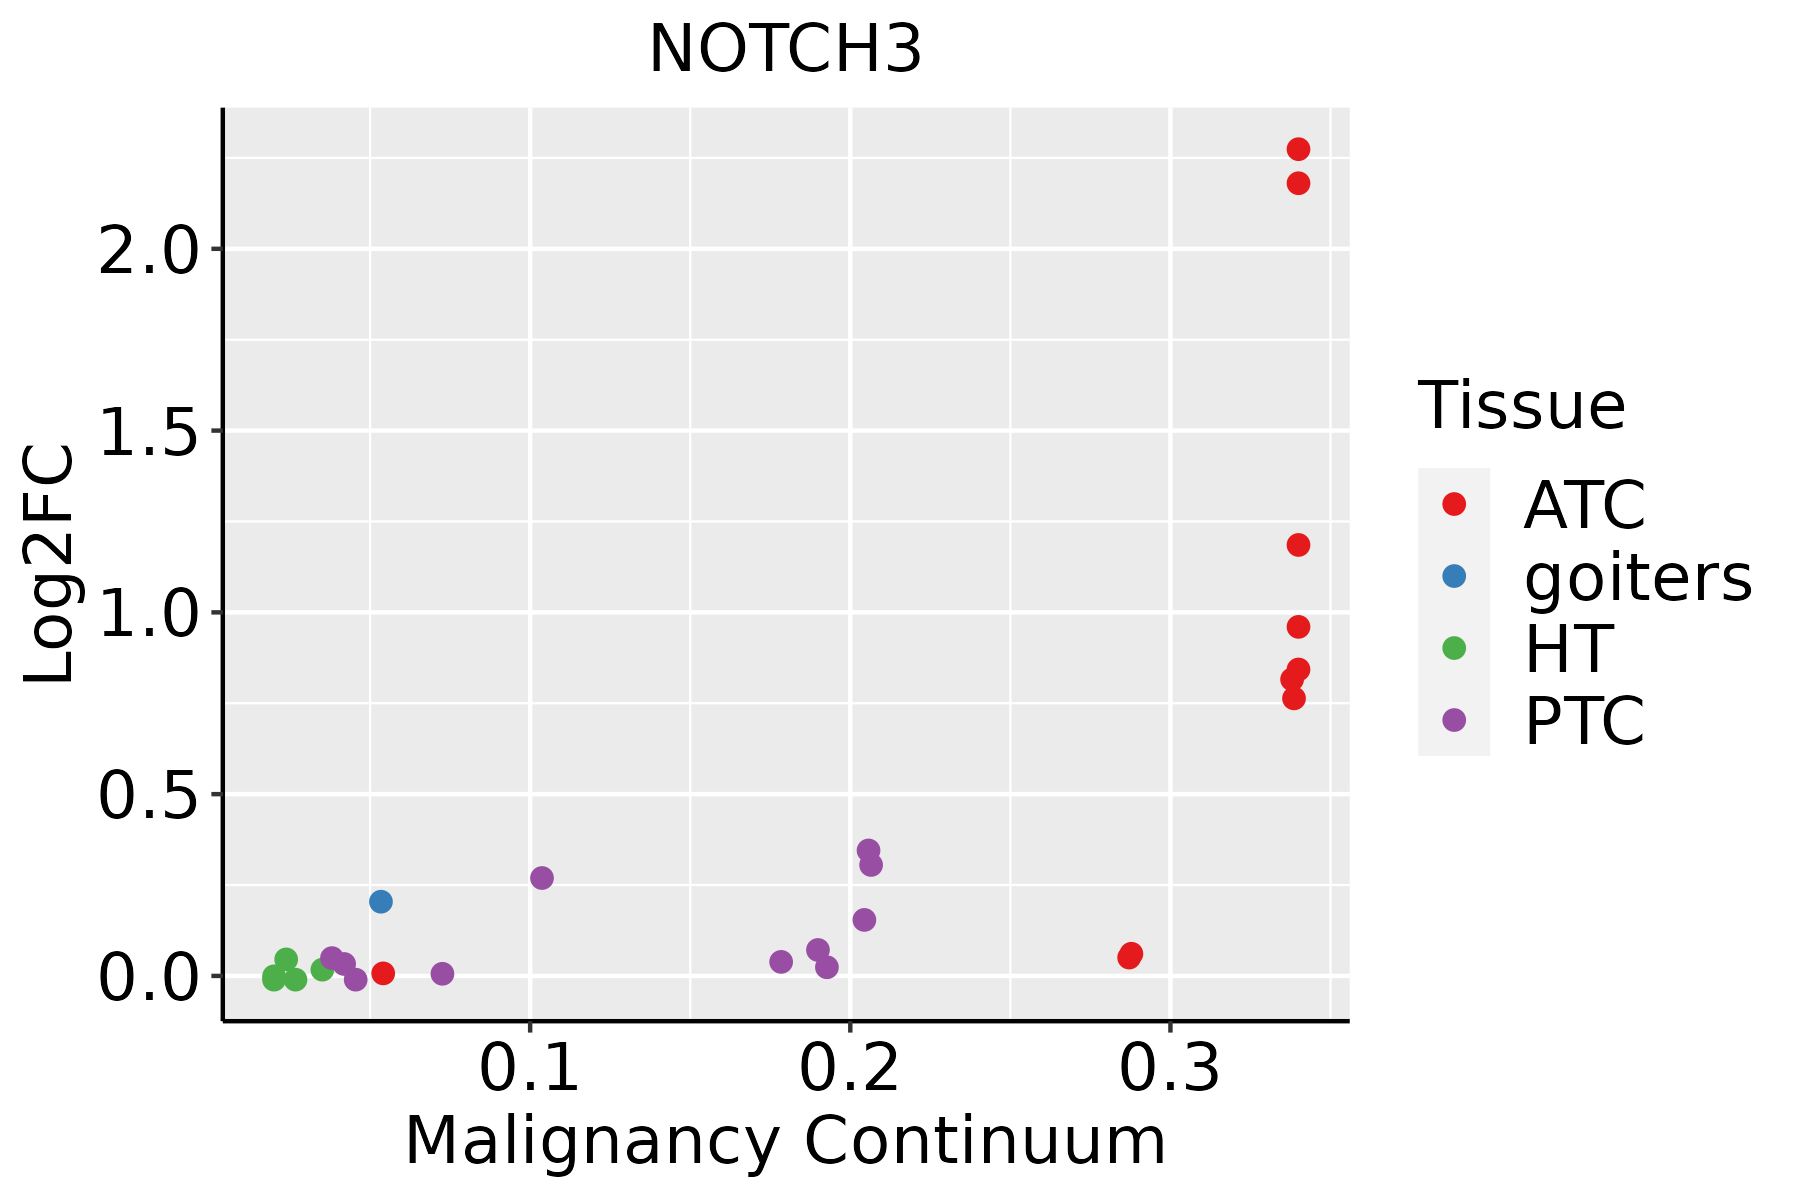 | ATC: Anaplastic thyroid cancer |
| HT: Hashimoto's thyroiditis | ||
| PTC: Papillary thyroid cancer |
| ∗log2FC in expression of this searched gene in stem-like cells from each diseased tissue sample relative to stem-like cells in normal samples in each tissue plotted against the malignancy continuum. Samples are colored based on if they are from different disease stage. |
Top |
Malignant transformation related pathway analysis |
| Find out the enriched GO biological processes and KEGG pathways involved in transition from healthy to precancer to cancer |
| Tissue | Disease Stage | Enriched GO biological Processes |
| Colorectum | AD |  |
| Colorectum | SER |  |
| Colorectum | MSS |  |
| Colorectum | MSI-H |  |
| Colorectum | FAP |  |
| ∗Top 15 enriched GO BP terms are showed in the bar plot of each disease state in each tissue. Each row represents a significant GO biological process which is colored according to the -log10(p.adjust). |
| Page: 1 2 3 4 5 6 7 8 9 |
| GO ID | Tissue | Disease Stage | Description | Gene Ratio | Bg Ratio | pvalue | p.adjust | Count |
| GO:00615647 | Cervix | CC | axon development | 89/2311 | 467/18723 | 1.71e-05 | 3.27e-04 | 89 |
| GO:00072194 | Cervix | CC | Notch signaling pathway | 39/2311 | 172/18723 | 1.08e-04 | 1.38e-03 | 39 |
| GO:00074097 | Cervix | CC | axonogenesis | 78/2311 | 418/18723 | 1.14e-04 | 1.43e-03 | 78 |
| GO:00072197 | Esophagus | ESCC | Notch signaling pathway | 106/8552 | 172/18723 | 1.74e-05 | 1.55e-04 | 106 |
| GO:006156415 | Esophagus | ESCC | axon development | 251/8552 | 467/18723 | 2.41e-04 | 1.49e-03 | 251 |
| GO:000740915 | Esophagus | ESCC | axonogenesis | 219/8552 | 418/18723 | 3.14e-03 | 1.31e-02 | 219 |
| GO:00072196 | Oral cavity | OSCC | Notch signaling pathway | 92/7305 | 172/18723 | 7.84e-05 | 6.08e-04 | 92 |
| GO:006156410 | Oral cavity | OSCC | axon development | 207/7305 | 467/18723 | 1.01e-02 | 3.51e-02 | 207 |
| GO:006156421 | Oral cavity | NEOLP | axon development | 78/2005 | 467/18723 | 4.49e-05 | 6.26e-04 | 78 |
| GO:000740914 | Oral cavity | NEOLP | axonogenesis | 71/2005 | 418/18723 | 5.64e-05 | 7.62e-04 | 71 |
| GO:000721921 | Oral cavity | NEOLP | Notch signaling pathway | 32/2005 | 172/18723 | 1.31e-03 | 9.48e-03 | 32 |
| GO:006156419 | Thyroid | PTC | axon development | 199/5968 | 467/18723 | 5.27e-07 | 8.53e-06 | 199 |
| GO:000740918 | Thyroid | PTC | axonogenesis | 178/5968 | 418/18723 | 2.17e-06 | 2.91e-05 | 178 |
| GO:00072199 | Thyroid | PTC | Notch signaling pathway | 70/5968 | 172/18723 | 8.82e-03 | 3.67e-02 | 70 |
| GO:006156423 | Thyroid | ATC | axon development | 220/6293 | 467/18723 | 6.85e-10 | 1.80e-08 | 220 |
| GO:000740919 | Thyroid | ATC | axonogenesis | 197/6293 | 418/18723 | 5.09e-09 | 1.13e-07 | 197 |
| GO:000721915 | Thyroid | ATC | Notch signaling pathway | 79/6293 | 172/18723 | 5.08e-04 | 2.96e-03 | 79 |
| GO:00074113 | Thyroid | ATC | axon guidance | 96/6293 | 227/18723 | 3.74e-03 | 1.63e-02 | 96 |
| GO:00974853 | Thyroid | ATC | neuron projection guidance | 96/6293 | 228/18723 | 4.36e-03 | 1.81e-02 | 96 |
| Page: 1 |
| Pathway ID | Tissue | Disease Stage | Description | Gene Ratio | Bg Ratio | pvalue | p.adjust | qvalue | Count |
| hsa051657 | Cervix | CC | Human papillomavirus infection | 74/1267 | 331/8465 | 1.70e-04 | 1.02e-03 | 6.03e-04 | 74 |
| hsa0491918 | Cervix | CC | Thyroid hormone signaling pathway | 33/1267 | 121/8465 | 3.11e-04 | 1.65e-03 | 9.78e-04 | 33 |
| hsa015223 | Cervix | CC | Endocrine resistance | 28/1267 | 98/8465 | 3.82e-04 | 1.87e-03 | 1.11e-03 | 28 |
| hsa04330 | Cervix | CC | Notch signaling pathway | 17/1267 | 62/8465 | 7.99e-03 | 2.56e-02 | 1.51e-02 | 17 |
| hsa05224 | Cervix | CC | Breast cancer | 32/1267 | 147/8465 | 1.66e-02 | 4.88e-02 | 2.88e-02 | 32 |
| hsa0516512 | Cervix | CC | Human papillomavirus infection | 74/1267 | 331/8465 | 1.70e-04 | 1.02e-03 | 6.03e-04 | 74 |
| hsa0491919 | Cervix | CC | Thyroid hormone signaling pathway | 33/1267 | 121/8465 | 3.11e-04 | 1.65e-03 | 9.78e-04 | 33 |
| hsa0152212 | Cervix | CC | Endocrine resistance | 28/1267 | 98/8465 | 3.82e-04 | 1.87e-03 | 1.11e-03 | 28 |
| hsa043301 | Cervix | CC | Notch signaling pathway | 17/1267 | 62/8465 | 7.99e-03 | 2.56e-02 | 1.51e-02 | 17 |
| hsa052241 | Cervix | CC | Breast cancer | 32/1267 | 147/8465 | 1.66e-02 | 4.88e-02 | 2.88e-02 | 32 |
| hsa0516510 | Esophagus | ESCC | Human papillomavirus infection | 215/4205 | 331/8465 | 7.86e-09 | 7.12e-08 | 3.65e-08 | 215 |
| hsa0491928 | Esophagus | ESCC | Thyroid hormone signaling pathway | 78/4205 | 121/8465 | 6.79e-04 | 2.23e-03 | 1.14e-03 | 78 |
| hsa015227 | Esophagus | ESCC | Endocrine resistance | 63/4205 | 98/8465 | 2.38e-03 | 6.58e-03 | 3.37e-03 | 63 |
| hsa043306 | Esophagus | ESCC | Notch signaling pathway | 42/4205 | 62/8465 | 2.97e-03 | 7.97e-03 | 4.08e-03 | 42 |
| hsa046585 | Esophagus | ESCC | Th1 and Th2 cell differentiation | 58/4205 | 92/8465 | 6.49e-03 | 1.60e-02 | 8.19e-03 | 58 |
| hsa0516515 | Esophagus | ESCC | Human papillomavirus infection | 215/4205 | 331/8465 | 7.86e-09 | 7.12e-08 | 3.65e-08 | 215 |
| hsa04919113 | Esophagus | ESCC | Thyroid hormone signaling pathway | 78/4205 | 121/8465 | 6.79e-04 | 2.23e-03 | 1.14e-03 | 78 |
| hsa0152215 | Esophagus | ESCC | Endocrine resistance | 63/4205 | 98/8465 | 2.38e-03 | 6.58e-03 | 3.37e-03 | 63 |
| hsa0433013 | Esophagus | ESCC | Notch signaling pathway | 42/4205 | 62/8465 | 2.97e-03 | 7.97e-03 | 4.08e-03 | 42 |
| hsa0465812 | Esophagus | ESCC | Th1 and Th2 cell differentiation | 58/4205 | 92/8465 | 6.49e-03 | 1.60e-02 | 8.19e-03 | 58 |
| Page: 1 2 |
Top |
Cell-cell communication analysis |
| Identification of potential cell-cell interactions between two cell types and their ligand-receptor pairs for different disease states |
| Ligand | Receptor | LRpair | Pathway | Tissue | Disease Stage |
| JAG1 | NOTCH3 | JAG1_NOTCH3 | NOTCH | Breast | DCIS |
| DLK1 | NOTCH3 | DLK1_NOTCH3 | NOTCH | Breast | Healthy |
| JAG1 | NOTCH3 | JAG1_NOTCH3 | NOTCH | Breast | Healthy |
| JAG1 | NOTCH3 | JAG1_NOTCH3 | NOTCH | Breast | IDC |
| DLL4 | NOTCH3 | DLL4_NOTCH3 | NOTCH | Cervix | ADJ |
| JAG1 | NOTCH3 | JAG1_NOTCH3 | NOTCH | Cervix | CC |
| JAG2 | NOTCH3 | JAG2_NOTCH3 | NOTCH | Cervix | CC |
| JAG1 | NOTCH3 | JAG1_NOTCH3 | NOTCH | Cervix | Precancer |
| DLL1 | NOTCH3 | DLL1_NOTCH3 | NOTCH | CRC | CRC |
| JAG1 | NOTCH3 | JAG1_NOTCH3 | NOTCH | CRC | CRC |
| JAG1 | NOTCH3 | JAG1_NOTCH3 | NOTCH | CRC | FAP |
| DLL4 | NOTCH3 | DLL4_NOTCH3 | NOTCH | CRC | MSI-H |
| JAG1 | NOTCH3 | JAG1_NOTCH3 | NOTCH | CRC | MSI-H |
| JAG2 | NOTCH3 | JAG2_NOTCH3 | NOTCH | CRC | MSI-H |
| DLL1 | NOTCH3 | DLL1_NOTCH3 | NOTCH | CRC | MSS |
| JAG1 | NOTCH3 | JAG1_NOTCH3 | NOTCH | CRC | MSS |
| JAG1 | NOTCH3 | JAG1_NOTCH3 | NOTCH | Endometrium | ADJ |
| DLL4 | NOTCH3 | DLL4_NOTCH3 | NOTCH | Endometrium | AEH |
| JAG1 | NOTCH3 | JAG1_NOTCH3 | NOTCH | Endometrium | AEH |
| DLL4 | NOTCH3 | DLL4_NOTCH3 | NOTCH | Endometrium | EEC |
| Page: 1 |
Top |
Single-cell gene regulatory network inference analysis |
| Find out the significant the regulons (TFs) and the target genes of each regulon across cell types for different disease states |
| TF | Cell Type | Tissue | Disease Stage | Target Gene | RSS | Regulon Activity |
| ∗The dot plots of a searched regulon are shown for all cell subpopulations in each disease state of each tissue based on the regulon specific score inferred using pySCENIC and by calculating the average expression. |
| Page: 1 |
Top |
Somatic mutation of malignant transformation related genes |
| Annotation of somatic variants for genes involved in malignant transformation |
| Hugo Symbol | Variant Class | Variant Classification | dbSNP RS | HGVSc | HGVSp | HGVSp Short | SWISSPROT | BIOTYPE | SIFT | PolyPhen | Tumor Sample Barcode | Tissue | Histology | Sex | Age | Stage | Therapy Types | Drugs | Outcome |
| NOTCH3 | SNV | Missense_Mutation | rs761407832 | c.715N>A | p.Asp239Asn | p.D239N | Q9UM47 | protein_coding | deleterious(0.02) | probably_damaging(0.974) | TCGA-3C-AALI-01 | Breast | breast invasive carcinoma | Female | <65 | I/II | Unspecific | Poly E | Complete Response |
| NOTCH3 | SNV | Missense_Mutation | c.2088N>A | p.Ser696Arg | p.S696R | Q9UM47 | protein_coding | tolerated(0.07) | benign(0) | TCGA-A2-A0D0-01 | Breast | breast invasive carcinoma | Female | <65 | I/II | Chemotherapy | cytoxan | SD | |
| NOTCH3 | SNV | Missense_Mutation | c.4822G>A | p.Ala1608Thr | p.A1608T | Q9UM47 | protein_coding | deleterious(0) | probably_damaging(1) | TCGA-A2-A0SX-01 | Breast | breast invasive carcinoma | Female | <65 | I/II | Chemotherapy | adriamycin | PD | |
| NOTCH3 | SNV | Missense_Mutation | novel | c.6022C>G | p.Pro2008Ala | p.P2008A | Q9UM47 | protein_coding | deleterious(0) | probably_damaging(1) | TCGA-AN-A0G0-01 | Breast | breast invasive carcinoma | Female | <65 | I/II | Unknown | Unknown | SD |
| NOTCH3 | SNV | Missense_Mutation | rs764558842 | c.5713N>C | p.Asp1905His | p.D1905H | Q9UM47 | protein_coding | deleterious(0) | probably_damaging(1) | TCGA-B6-A0IJ-01 | Breast | breast invasive carcinoma | Female | <65 | I/II | Unknown | Unknown | SD |
| NOTCH3 | SNV | Missense_Mutation | novel | c.4327N>A | p.Asp1443Asn | p.D1443N | Q9UM47 | protein_coding | tolerated(0.05) | possibly_damaging(0.73) | TCGA-S3-AA15-01 | Breast | breast invasive carcinoma | Female | <65 | I/II | Chemotherapy | adriamycin | CR |
| NOTCH3 | insertion | Nonsense_Mutation | novel | c.1923_1924insTAAAAATACAAAAATTAGTCGGGTGT | p.Asp642Ter | p.D642* | Q9UM47 | protein_coding | TCGA-A8-A06P-01 | Breast | breast invasive carcinoma | Female | <65 | III/IV | Unspecific | SD | |||
| NOTCH3 | insertion | Frame_Shift_Ins | novel | c.2008_2009insTCGACTTTGCTTACCACAAGTTACAAATGACTGAATT | p.Gly670ValfsTer45 | p.G670Vfs*45 | Q9UM47 | protein_coding | TCGA-AC-A3W5-01 | Breast | breast invasive carcinoma | Female | >=65 | I/II | Chemotherapy | docetaxel | CR | ||
| NOTCH3 | insertion | Frame_Shift_Ins | rs771517374 | c.6102_6103insC | p.Gly2035ArgfsTer60 | p.G2035Rfs*60 | Q9UM47 | protein_coding | TCGA-BH-A18G-01 | Breast | breast invasive carcinoma | Female | >=65 | I/II | Unknown | Unknown | SD | ||
| NOTCH3 | SNV | Missense_Mutation | rs752437137 | c.5000N>A | p.Arg1667His | p.R1667H | Q9UM47 | protein_coding | deleterious(0) | probably_damaging(0.991) | TCGA-2W-A8YY-01 | Cervix | cervical & endocervical cancer | Female | <65 | I/II | Chemotherapy | cisplatin | CR |
| Page: 1 2 3 4 5 6 7 8 9 10 11 12 13 14 15 16 17 18 19 20 21 22 23 24 |
Top |
Related drugs of malignant transformation related genes |
| Identification of chemicals and drugs interact with genes involved in malignant transfromation |
| (DGIdb 4.0) |
| Entrez ID | Symbol | Category | Interaction Types | Drug Claim Name | Drug Name | PMIDs |
| 4854 | NOTCH3 | CELL SURFACE, CLINICALLY ACTIONABLE, DRUGGABLE GENOME | TAREXTUMAB | TAREXTUMAB | 25934888,24525742 | |
| 4854 | NOTCH3 | CELL SURFACE, CLINICALLY ACTIONABLE, DRUGGABLE GENOME | inhibitor | RO4929097 | RG-4733 | |
| 4854 | NOTCH3 | CELL SURFACE, CLINICALLY ACTIONABLE, DRUGGABLE GENOME | antibody | REGN421 | ||
| 4854 | NOTCH3 | CELL SURFACE, CLINICALLY ACTIONABLE, DRUGGABLE GENOME | inhibitor | PF-03084014 | NIROGACESTAT | |
| 4854 | NOTCH3 | CELL SURFACE, CLINICALLY ACTIONABLE, DRUGGABLE GENOME | Tarextumab | TAREXTUMAB | ||
| 4854 | NOTCH3 | CELL SURFACE, CLINICALLY ACTIONABLE, DRUGGABLE GENOME | antibody | 252166663 | TAREXTUMAB | |
| 4854 | NOTCH3 | CELL SURFACE, CLINICALLY ACTIONABLE, DRUGGABLE GENOME | inhibitor | MK0752 | ||
| 4854 | NOTCH3 | CELL SURFACE, CLINICALLY ACTIONABLE, DRUGGABLE GENOME | OMP-59R5 | TAREXTUMAB |
| Page: 1 |

Copyright 2023-Present -The University of Texas Health Science Center at Houston |