| Tissue | Expression Dynamics | Abbreviation |
| Colorectum (GSE201348) |  | FAP: Familial adenomatous polyposis |
| CRC: Colorectal cancer |
| Colorectum (HTA11) |  | AD: Adenomas |
| SER: Sessile serrated lesions |
| MSI-H: Microsatellite-high colorectal cancer |
| MSS: Microsatellite stable colorectal cancer |
| Esophagus |  | ESCC: Esophageal squamous cell carcinoma |
| HGIN: High-grade intraepithelial neoplasias |
| LGIN: Low-grade intraepithelial neoplasias |
| Liver | 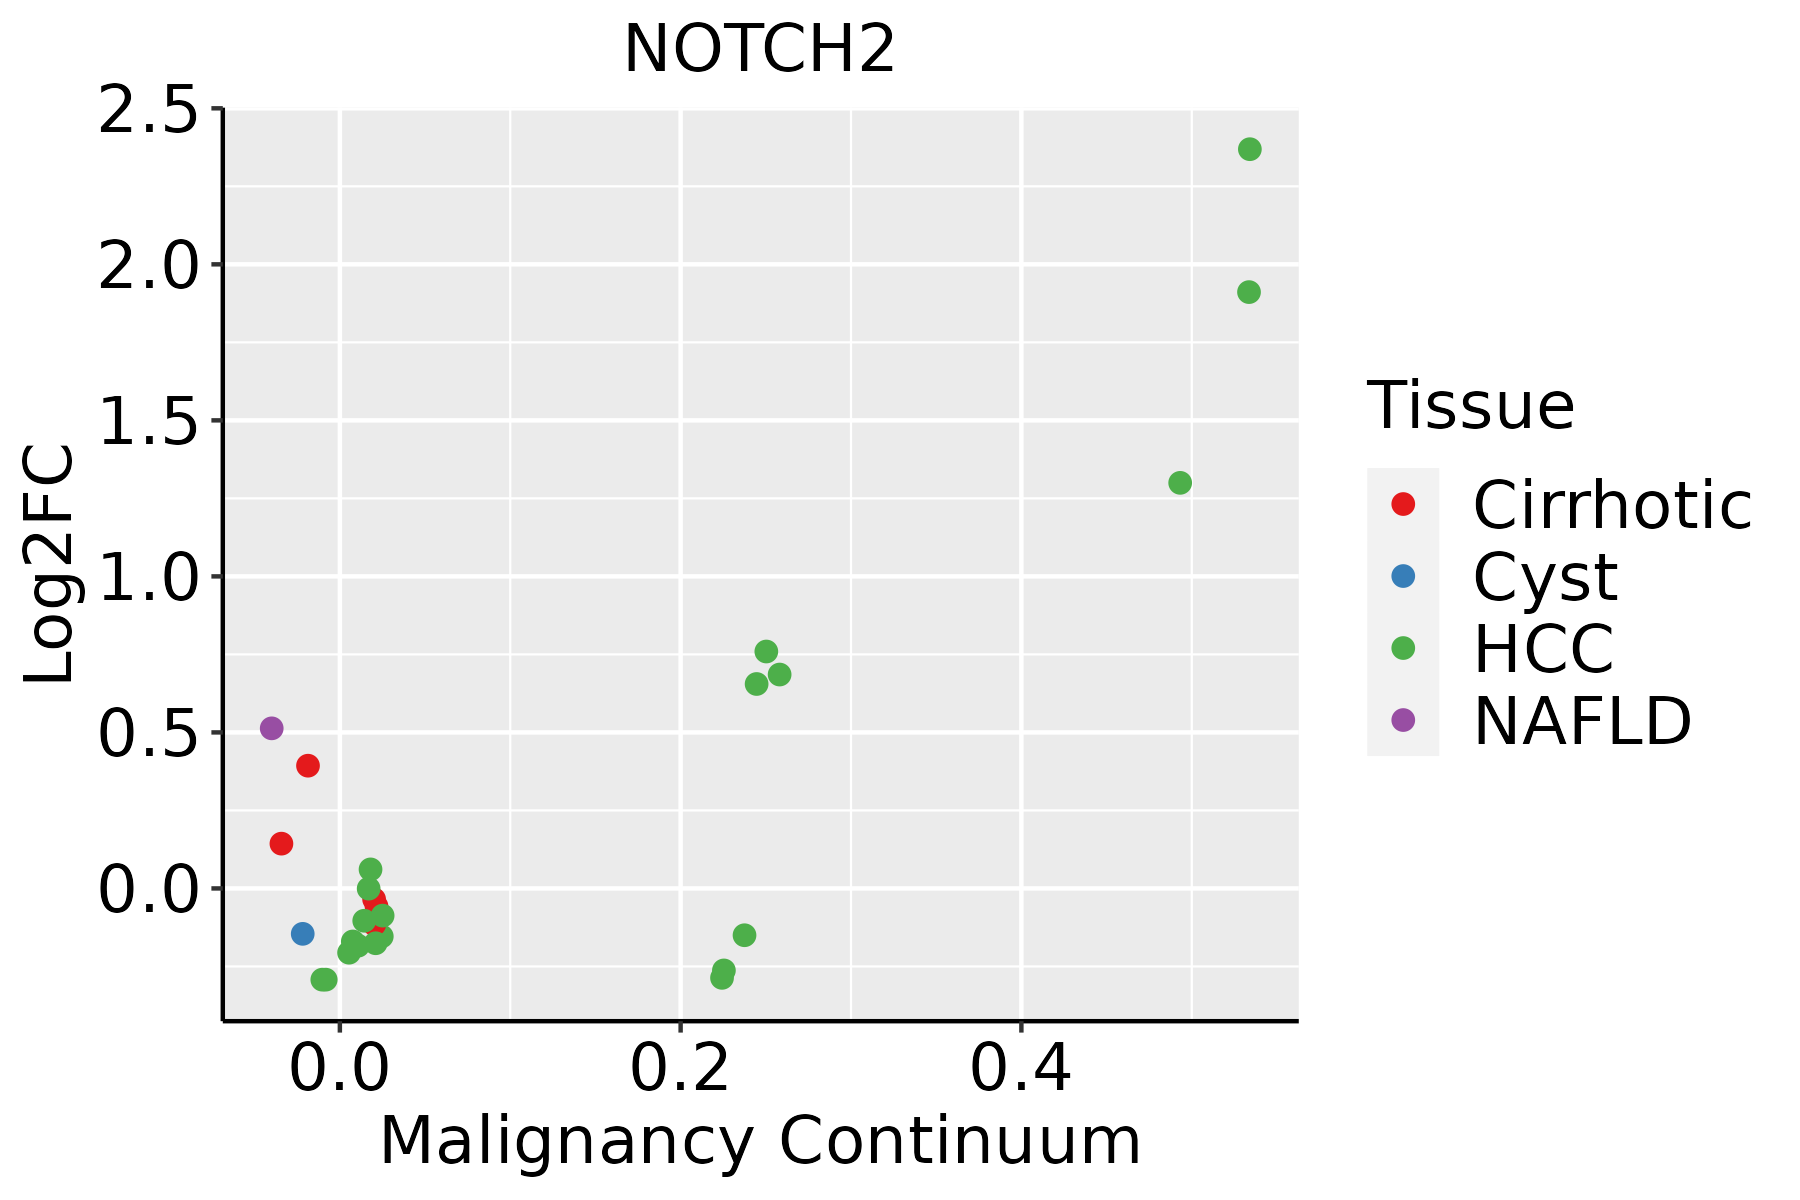 | HCC: Hepatocellular carcinoma |
| NAFLD: Non-alcoholic fatty liver disease |
| Prostate |  | BPH: Benign Prostatic Hyperplasia |
| Thyroid | 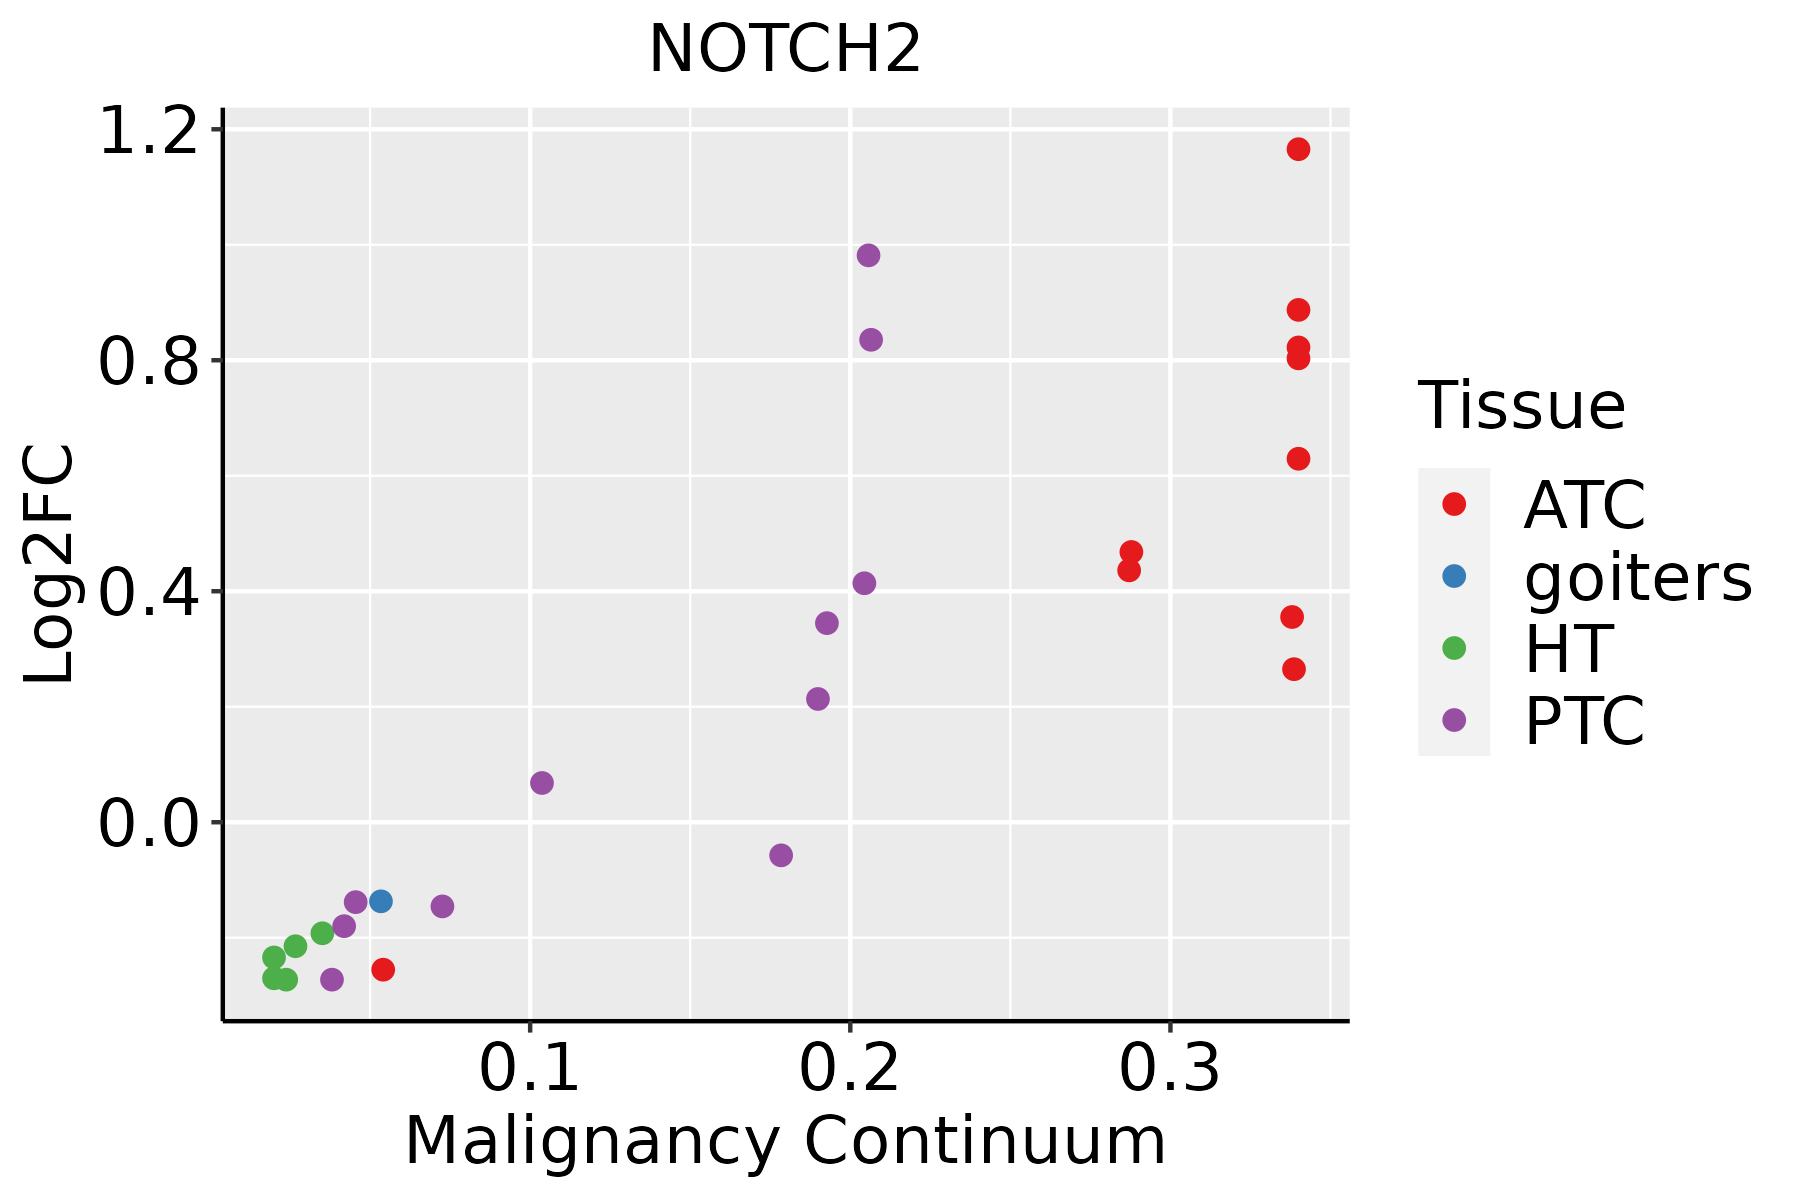 | ATC: Anaplastic thyroid cancer |
| HT: Hashimoto's thyroiditis |
| PTC: Papillary thyroid cancer |
| GO ID | Tissue | Disease Stage | Description | Gene Ratio | Bg Ratio | pvalue | p.adjust | Count |
| GO:0032970 | Colorectum | AD | regulation of actin filament-based process | 142/3918 | 397/18723 | 4.05e-12 | 5.90e-10 | 142 |
| GO:0002064 | Colorectum | AD | epithelial cell development | 89/3918 | 220/18723 | 2.98e-11 | 3.52e-09 | 89 |
| GO:0048732 | Colorectum | AD | gland development | 149/3918 | 436/18723 | 6.07e-11 | 6.33e-09 | 149 |
| GO:0032956 | Colorectum | AD | regulation of actin cytoskeleton organization | 127/3918 | 358/18723 | 1.03e-10 | 1.04e-08 | 127 |
| GO:0030099 | Colorectum | AD | myeloid cell differentiation | 119/3918 | 381/18723 | 1.24e-06 | 4.01e-05 | 119 |
| GO:0042060 | Colorectum | AD | wound healing | 128/3918 | 422/18723 | 2.73e-06 | 7.89e-05 | 128 |
| GO:0061008 | Colorectum | AD | hepaticobiliary system development | 55/3918 | 150/18723 | 6.34e-06 | 1.59e-04 | 55 |
| GO:0001889 | Colorectum | AD | liver development | 54/3918 | 147/18723 | 7.20e-06 | 1.77e-04 | 54 |
| GO:0007265 | Colorectum | AD | Ras protein signal transduction | 104/3918 | 337/18723 | 1.01e-05 | 2.35e-04 | 104 |
| GO:0051056 | Colorectum | AD | regulation of small GTPase mediated signal transduction | 94/3918 | 302/18723 | 1.81e-05 | 3.76e-04 | 94 |
| GO:0001701 | Colorectum | AD | in utero embryonic development | 110/3918 | 367/18723 | 2.36e-05 | 4.62e-04 | 110 |
| GO:0031532 | Colorectum | AD | actin cytoskeleton reorganization | 41/3918 | 107/18723 | 2.81e-05 | 5.28e-04 | 41 |
| GO:0007409 | Colorectum | AD | axonogenesis | 122/3918 | 418/18723 | 3.36e-05 | 6.15e-04 | 122 |
| GO:0001890 | Colorectum | AD | placenta development | 51/3918 | 144/18723 | 3.99e-05 | 7.16e-04 | 51 |
| GO:0061564 | Colorectum | AD | axon development | 132/3918 | 467/18723 | 8.40e-05 | 1.31e-03 | 132 |
| GO:0022612 | Colorectum | AD | gland morphogenesis | 42/3918 | 118/18723 | 1.62e-04 | 2.23e-03 | 42 |
| GO:0060562 | Colorectum | AD | epithelial tube morphogenesis | 93/3918 | 325/18723 | 5.65e-04 | 6.00e-03 | 93 |
| GO:0050673 | Colorectum | AD | epithelial cell proliferation | 119/3918 | 437/18723 | 8.75e-04 | 8.51e-03 | 119 |
| GO:0007178 | Colorectum | AD | transmembrane receptor protein serine/threonine kinase signaling pathway | 99/3918 | 355/18723 | 9.92e-04 | 9.28e-03 | 99 |
| GO:0061458 | Colorectum | AD | reproductive system development | 116/3918 | 427/18723 | 1.11e-03 | 1.01e-02 | 116 |
| Pathway ID | Tissue | Disease Stage | Description | Gene Ratio | Bg Ratio | pvalue | p.adjust | qvalue | Count |
| hsa04919 | Colorectum | AD | Thyroid hormone signaling pathway | 51/2092 | 121/8465 | 1.71e-05 | 1.73e-04 | 1.10e-04 | 51 |
| hsa049191 | Colorectum | AD | Thyroid hormone signaling pathway | 51/2092 | 121/8465 | 1.71e-05 | 1.73e-04 | 1.10e-04 | 51 |
| hsa049194 | Colorectum | MSS | Thyroid hormone signaling pathway | 46/1875 | 121/8465 | 5.04e-05 | 4.97e-04 | 3.05e-04 | 46 |
| hsa049195 | Colorectum | MSS | Thyroid hormone signaling pathway | 46/1875 | 121/8465 | 5.04e-05 | 4.97e-04 | 3.05e-04 | 46 |
| hsa049198 | Colorectum | FAP | Thyroid hormone signaling pathway | 41/1404 | 121/8465 | 2.28e-06 | 4.28e-05 | 2.60e-05 | 41 |
| hsa049199 | Colorectum | FAP | Thyroid hormone signaling pathway | 41/1404 | 121/8465 | 2.28e-06 | 4.28e-05 | 2.60e-05 | 41 |
| hsa0491910 | Colorectum | CRC | Thyroid hormone signaling pathway | 35/1091 | 121/8465 | 2.05e-06 | 6.85e-05 | 4.64e-05 | 35 |
| hsa05207 | Colorectum | CRC | Chemical carcinogenesis - receptor activation | 42/1091 | 212/8465 | 2.62e-03 | 1.75e-02 | 1.19e-02 | 42 |
| hsa0491911 | Colorectum | CRC | Thyroid hormone signaling pathway | 35/1091 | 121/8465 | 2.05e-06 | 6.85e-05 | 4.64e-05 | 35 |
| hsa052071 | Colorectum | CRC | Chemical carcinogenesis - receptor activation | 42/1091 | 212/8465 | 2.62e-03 | 1.75e-02 | 1.19e-02 | 42 |
| hsa0516510 | Esophagus | ESCC | Human papillomavirus infection | 215/4205 | 331/8465 | 7.86e-09 | 7.12e-08 | 3.65e-08 | 215 |
| hsa0491928 | Esophagus | ESCC | Thyroid hormone signaling pathway | 78/4205 | 121/8465 | 6.79e-04 | 2.23e-03 | 1.14e-03 | 78 |
| hsa015227 | Esophagus | ESCC | Endocrine resistance | 63/4205 | 98/8465 | 2.38e-03 | 6.58e-03 | 3.37e-03 | 63 |
| hsa043306 | Esophagus | ESCC | Notch signaling pathway | 42/4205 | 62/8465 | 2.97e-03 | 7.97e-03 | 4.08e-03 | 42 |
| hsa046585 | Esophagus | ESCC | Th1 and Th2 cell differentiation | 58/4205 | 92/8465 | 6.49e-03 | 1.60e-02 | 8.19e-03 | 58 |
| hsa0516515 | Esophagus | ESCC | Human papillomavirus infection | 215/4205 | 331/8465 | 7.86e-09 | 7.12e-08 | 3.65e-08 | 215 |
| hsa04919113 | Esophagus | ESCC | Thyroid hormone signaling pathway | 78/4205 | 121/8465 | 6.79e-04 | 2.23e-03 | 1.14e-03 | 78 |
| hsa0152215 | Esophagus | ESCC | Endocrine resistance | 63/4205 | 98/8465 | 2.38e-03 | 6.58e-03 | 3.37e-03 | 63 |
| hsa0433013 | Esophagus | ESCC | Notch signaling pathway | 42/4205 | 62/8465 | 2.97e-03 | 7.97e-03 | 4.08e-03 | 42 |
| hsa0465812 | Esophagus | ESCC | Th1 and Th2 cell differentiation | 58/4205 | 92/8465 | 6.49e-03 | 1.60e-02 | 8.19e-03 | 58 |
| Hugo Symbol | Variant Class | Variant Classification | dbSNP RS | HGVSc | HGVSp | HGVSp Short | SWISSPROT | BIOTYPE | SIFT | PolyPhen | Tumor Sample Barcode | Tissue | Histology | Sex | Age | Stage | Therapy Types | Drugs | Outcome |
| NOTCH2 | SNV | Missense_Mutation | | c.4888C>G | p.Arg1630Gly | p.R1630G | Q04721 | protein_coding | deleterious(0.03) | probably_damaging(0.95) | TCGA-A7-A4SC-01 | Breast | breast invasive carcinoma | Female | <65 | I/II | Hormone Therapy | tamoxiphen | SD |
| NOTCH2 | SNV | Missense_Mutation | novel | c.4163N>C | p.Ser1388Thr | p.S1388T | Q04721 | protein_coding | tolerated(1) | benign(0) | TCGA-A7-A6VY-01 | Breast | breast invasive carcinoma | Female | <65 | I/II | Chemotherapy | cyclophosphamide | CR |
| NOTCH2 | SNV | Missense_Mutation | | c.6991G>T | p.Ala2331Ser | p.A2331S | Q04721 | protein_coding | tolerated(0.78) | benign(0.003) | TCGA-AC-A23H-01 | Breast | breast invasive carcinoma | Female | >=65 | I/II | Unknown | Unknown | PD |
| NOTCH2 | SNV | Missense_Mutation | | c.3044N>C | p.Val1015Ala | p.V1015A | Q04721 | protein_coding | tolerated(0.27) | benign(0.015) | TCGA-AN-A0AK-01 | Breast | breast invasive carcinoma | Female | >=65 | I/II | Unknown | Unknown | SD |
| NOTCH2 | SNV | Missense_Mutation | | c.804N>T | p.Arg268Ser | p.R268S | Q04721 | protein_coding | tolerated(0.65) | benign(0.037) | TCGA-AO-A03T-01 | Breast | breast invasive carcinoma | Female | <65 | I/II | Chemotherapy | cyclophosphamide | SD |
| NOTCH2 | SNV | Missense_Mutation | novel | c.290N>G | p.Thr97Arg | p.T97R | Q04721 | protein_coding | tolerated(0.1) | probably_damaging(0.979) | TCGA-AO-A0J9-01 | Breast | breast invasive carcinoma | Female | <65 | III/IV | Chemotherapy | cyclophosphamide | PD |
| NOTCH2 | SNV | Missense_Mutation | rs376783592 | c.1698G>T | p.Leu566Phe | p.L566F | Q04721 | protein_coding | tolerated(0.7) | possibly_damaging(0.77) | TCGA-AR-A24Q-01 | Breast | breast invasive carcinoma | Female | <65 | I/II | Chemotherapy | doxorubicin | SD |
| NOTCH2 | SNV | Missense_Mutation | | c.4996N>T | p.Val1666Phe | p.V1666F | Q04721 | protein_coding | deleterious(0.01) | probably_damaging(0.969) | TCGA-B6-A0X0-01 | Breast | breast invasive carcinoma | Female | <65 | I/II | Unknown | Unknown | SD |
| NOTCH2 | SNV | Missense_Mutation | | c.4812N>T | p.Arg1604Ser | p.R1604S | Q04721 | protein_coding | tolerated(0.57) | benign(0.007) | TCGA-BH-A0AW-01 | Breast | breast invasive carcinoma | Female | <65 | I/II | Chemotherapy | carboplatin | SD |
| NOTCH2 | SNV | Missense_Mutation | novel | c.2864G>A | p.Ser955Asn | p.S955N | Q04721 | protein_coding | deleterious(0) | probably_damaging(0.998) | TCGA-BH-A0B8-01 | Breast | breast invasive carcinoma | Female | <65 | I/II | Hormone Therapy | arimidex | SD |
| Entrez ID | Symbol | Category | Interaction Types | Drug Claim Name | Drug Name | PMIDs |
| 4853 | NOTCH2 | DRUGGABLE GENOME, CELL SURFACE, CLINICALLY ACTIONABLE | inhibitor | MK0752 | | |
| 4853 | NOTCH2 | DRUGGABLE GENOME, CELL SURFACE, CLINICALLY ACTIONABLE | antibody | 252166663 | TAREXTUMAB | |
| 4853 | NOTCH2 | DRUGGABLE GENOME, CELL SURFACE, CLINICALLY ACTIONABLE | inhibitor | RO4929097 | RG-4733 | |
| 4853 | NOTCH2 | DRUGGABLE GENOME, CELL SURFACE, CLINICALLY ACTIONABLE | inhibitor | PF-03084014 | NIROGACESTAT | |
| 4853 | NOTCH2 | DRUGGABLE GENOME, CELL SURFACE, CLINICALLY ACTIONABLE | antibody | REGN421 | | |
| 4853 | NOTCH2 | DRUGGABLE GENOME, CELL SURFACE, CLINICALLY ACTIONABLE | | Tarextumab | TAREXTUMAB | |
| 4853 | NOTCH2 | DRUGGABLE GENOME, CELL SURFACE, CLINICALLY ACTIONABLE | | OMP-59R5 | TAREXTUMAB | |


