
|
|||||
|
 | |
| |
| |
| |
| |
| |
|
Gene: NOTCH1 |
Gene summary for NOTCH1 |
| Gene information | Species | Human | Gene symbol | NOTCH1 | Gene ID | 4851 |
| Gene name | notch receptor 1 | |
| Gene Alias | AOS5 | |
| Cytomap | 9q34.3 | |
| Gene Type | protein-coding | GO ID | GO:0000003 | UniProtAcc | P46531 |
Top |
Malignant transformation analysis |
| Identification of the aberrant gene expression in precancerous and cancerous lesions by comparing the gene expression of stem-like cells in diseased tissues with normal stem cells |
| Entrez ID | Symbol | Replicates | Species | Organ | Tissue | Adj P-value | Log2FC | Malignancy |
| 4851 | NOTCH1 | CCI_1 | Human | Cervix | CC | 1.12e-03 | 5.45e-01 | 0.528 |
| 4851 | NOTCH1 | CCI_3 | Human | Cervix | CC | 6.47e-07 | 6.47e-01 | 0.516 |
| 4851 | NOTCH1 | H2 | Human | Cervix | HSIL_HPV | 1.46e-04 | -1.74e-01 | 0.0632 |
| 4851 | NOTCH1 | LZE8T | Human | Esophagus | ESCC | 2.93e-02 | 3.17e-01 | 0.067 |
| 4851 | NOTCH1 | LZE20T | Human | Esophagus | ESCC | 1.28e-03 | 6.60e-02 | 0.0662 |
| 4851 | NOTCH1 | LZE21T | Human | Esophagus | ESCC | 1.77e-03 | 2.67e-01 | 0.0655 |
| 4851 | NOTCH1 | P1T-E | Human | Esophagus | ESCC | 8.04e-06 | 2.15e-01 | 0.0875 |
| 4851 | NOTCH1 | P2T-E | Human | Esophagus | ESCC | 1.84e-30 | 5.71e-01 | 0.1177 |
| 4851 | NOTCH1 | P4T-E | Human | Esophagus | ESCC | 1.56e-14 | 1.43e-01 | 0.1323 |
| 4851 | NOTCH1 | P5T-E | Human | Esophagus | ESCC | 1.55e-09 | 4.14e-02 | 0.1327 |
| 4851 | NOTCH1 | P8T-E | Human | Esophagus | ESCC | 1.96e-18 | 2.59e-01 | 0.0889 |
| 4851 | NOTCH1 | P9T-E | Human | Esophagus | ESCC | 1.38e-04 | 7.73e-02 | 0.1131 |
| 4851 | NOTCH1 | P10T-E | Human | Esophagus | ESCC | 2.09e-05 | 1.84e-01 | 0.116 |
| 4851 | NOTCH1 | P11T-E | Human | Esophagus | ESCC | 5.84e-06 | 1.39e-01 | 0.1426 |
| 4851 | NOTCH1 | P12T-E | Human | Esophagus | ESCC | 1.24e-13 | 1.61e-01 | 0.1122 |
| 4851 | NOTCH1 | P15T-E | Human | Esophagus | ESCC | 1.53e-09 | 3.12e-01 | 0.1149 |
| 4851 | NOTCH1 | P16T-E | Human | Esophagus | ESCC | 1.19e-15 | 8.58e-02 | 0.1153 |
| 4851 | NOTCH1 | P20T-E | Human | Esophagus | ESCC | 4.85e-06 | 2.89e-02 | 0.1124 |
| 4851 | NOTCH1 | P21T-E | Human | Esophagus | ESCC | 1.18e-18 | 1.94e-01 | 0.1617 |
| 4851 | NOTCH1 | P22T-E | Human | Esophagus | ESCC | 2.31e-12 | 1.11e-01 | 0.1236 |
| Page: 1 2 3 4 |
| Tissue | Expression Dynamics | Abbreviation |
| Cervix |  | CC: Cervix cancer |
| HSIL_HPV: HPV-infected high-grade squamous intraepithelial lesions | ||
| N_HPV: HPV-infected normal cervix | ||
| Esophagus | 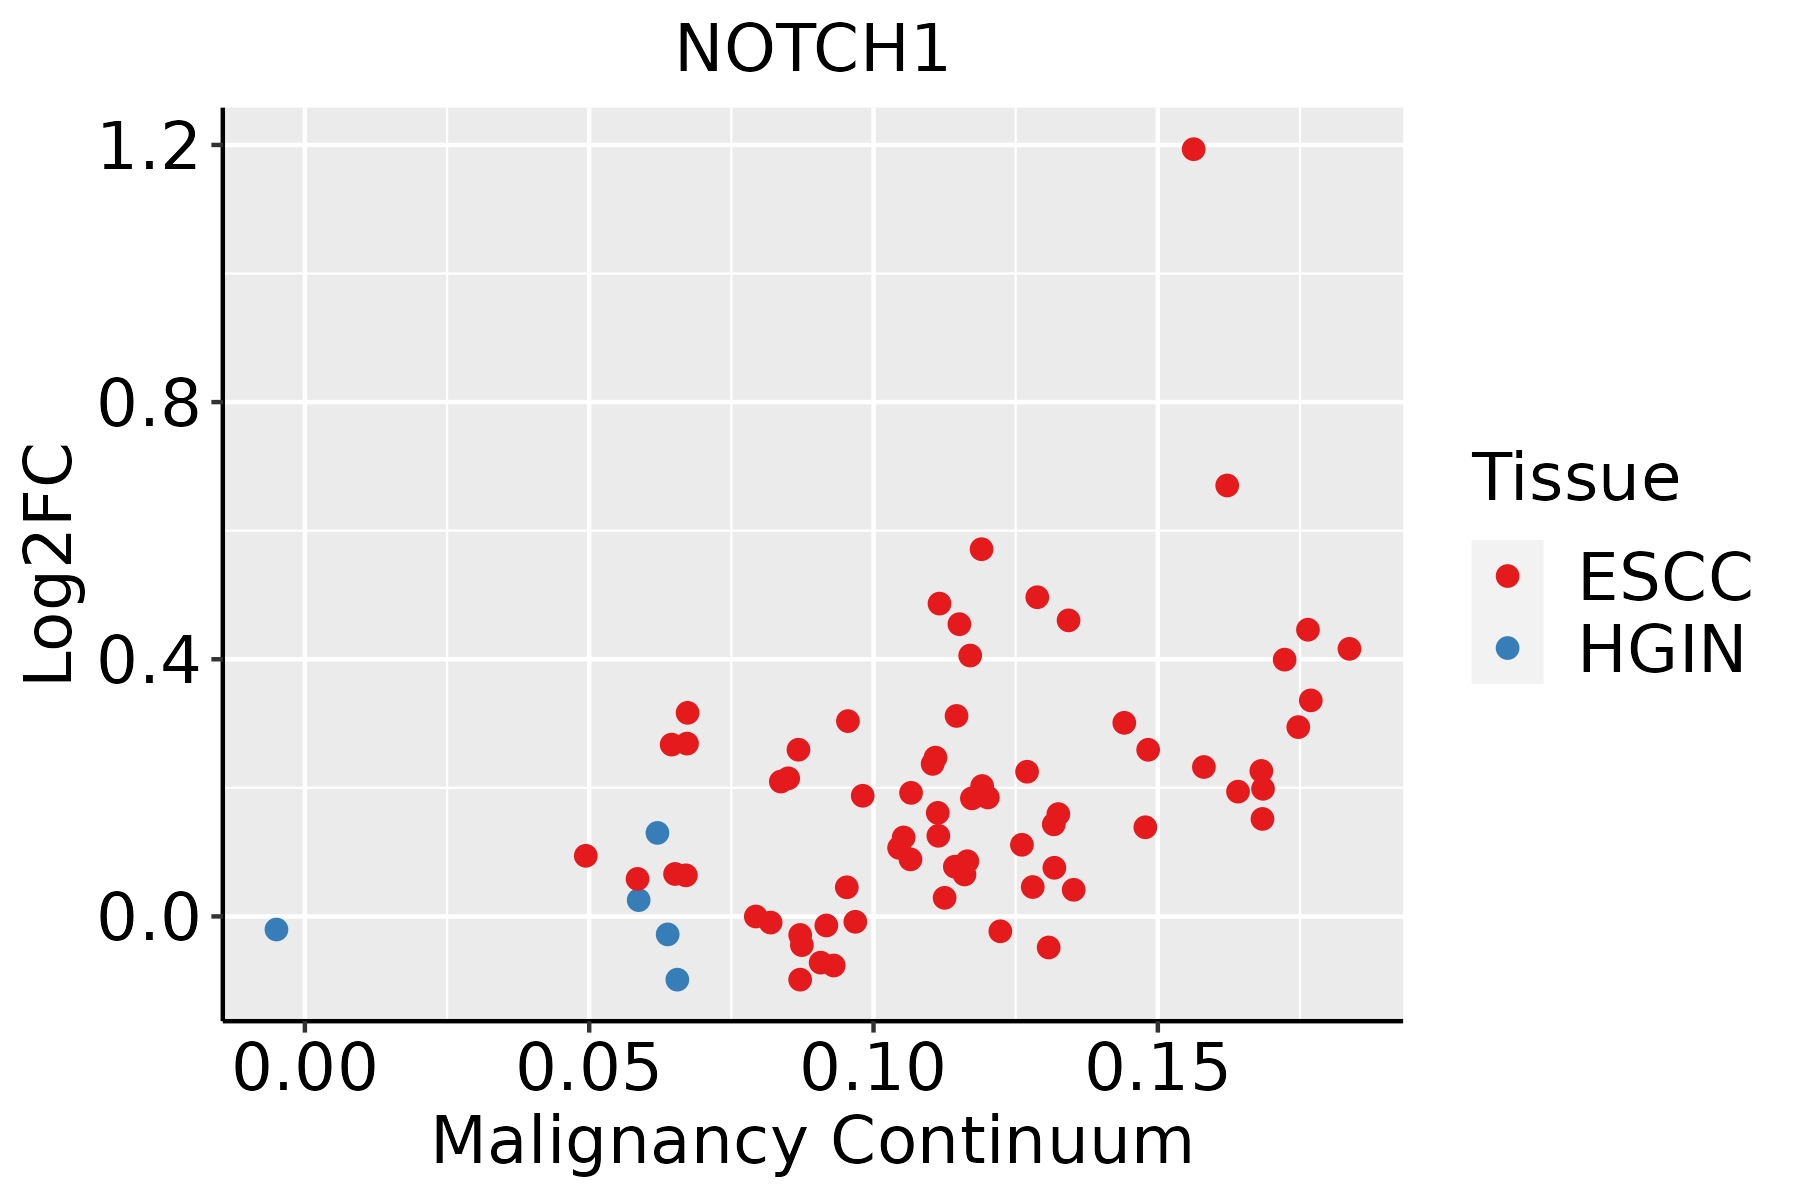 | ESCC: Esophageal squamous cell carcinoma |
| HGIN: High-grade intraepithelial neoplasias | ||
| LGIN: Low-grade intraepithelial neoplasias | ||
| Oral Cavity |  | EOLP: Erosive Oral lichen planus |
| LP: leukoplakia | ||
| NEOLP: Non-erosive oral lichen planus | ||
| OSCC: Oral squamous cell carcinoma | ||
| Skin |  | AK: Actinic keratosis |
| cSCC: Cutaneous squamous cell carcinoma | ||
| SCCIS:squamous cell carcinoma in situ |
| ∗log2FC in expression of this searched gene in stem-like cells from each diseased tissue sample relative to stem-like cells in normal samples in each tissue plotted against the malignancy continuum. Samples are colored based on if they are from different disease stage. |
Top |
Malignant transformation related pathway analysis |
| Find out the enriched GO biological processes and KEGG pathways involved in transition from healthy to precancer to cancer |
| Tissue | Disease Stage | Enriched GO biological Processes |
| Colorectum | AD |  |
| Colorectum | SER |  |
| Colorectum | MSS |  |
| Colorectum | MSI-H |  |
| Colorectum | FAP |  |
| ∗Top 15 enriched GO BP terms are showed in the bar plot of each disease state in each tissue. Each row represents a significant GO biological process which is colored according to the -log10(p.adjust). |
| Page: 1 2 3 4 5 6 7 8 9 |
| GO ID | Tissue | Disease Stage | Description | Gene Ratio | Bg Ratio | pvalue | p.adjust | Count |
| GO:001603210 | Cervix | CC | viral process | 109/2311 | 415/18723 | 5.40e-15 | 6.46e-12 | 109 |
| GO:001081010 | Cervix | CC | regulation of cell-substrate adhesion | 69/2311 | 221/18723 | 8.57e-14 | 5.69e-11 | 69 |
| GO:00315898 | Cervix | CC | cell-substrate adhesion | 96/2311 | 363/18723 | 1.48e-13 | 8.85e-11 | 96 |
| GO:001905810 | Cervix | CC | viral life cycle | 87/2311 | 317/18723 | 2.20e-13 | 1.20e-10 | 87 |
| GO:009013210 | Cervix | CC | epithelium migration | 90/2311 | 360/18723 | 2.45e-11 | 6.11e-09 | 90 |
| GO:00016679 | Cervix | CC | ameboidal-type cell migration | 110/2311 | 475/18723 | 2.66e-11 | 6.36e-09 | 110 |
| GO:001063110 | Cervix | CC | epithelial cell migration | 89/2311 | 357/18723 | 3.72e-11 | 8.54e-09 | 89 |
| GO:00085446 | Cervix | CC | epidermis development | 83/2311 | 324/18723 | 3.91e-11 | 8.54e-09 | 83 |
| GO:009013010 | Cervix | CC | tissue migration | 90/2311 | 365/18723 | 5.42e-11 | 1.05e-08 | 90 |
| GO:00435884 | Cervix | CC | skin development | 71/2311 | 263/18723 | 8.04e-11 | 1.46e-08 | 71 |
| GO:00725949 | Cervix | CC | establishment of protein localization to organelle | 99/2311 | 422/18723 | 1.23e-10 | 2.11e-08 | 99 |
| GO:002240710 | Cervix | CC | regulation of cell-cell adhesion | 103/2311 | 448/18723 | 1.78e-10 | 2.87e-08 | 103 |
| GO:00510566 | Cervix | CC | regulation of small GTPase mediated signal transduction | 75/2311 | 302/18723 | 1.54e-09 | 1.74e-07 | 75 |
| GO:00506737 | Cervix | CC | epithelial cell proliferation | 98/2311 | 437/18723 | 2.01e-09 | 2.15e-07 | 98 |
| GO:001063210 | Cervix | CC | regulation of epithelial cell migration | 72/2311 | 292/18723 | 4.52e-09 | 4.43e-07 | 72 |
| GO:00160557 | Cervix | CC | Wnt signaling pathway | 98/2311 | 444/18723 | 4.82e-09 | 4.65e-07 | 98 |
| GO:01987387 | Cervix | CC | cell-cell signaling by wnt | 98/2311 | 446/18723 | 6.16e-09 | 5.58e-07 | 98 |
| GO:00072656 | Cervix | CC | Ras protein signal transduction | 79/2311 | 337/18723 | 9.49e-09 | 7.77e-07 | 79 |
| GO:00302164 | Cervix | CC | keratinocyte differentiation | 42/2311 | 139/18723 | 1.74e-08 | 1.28e-06 | 42 |
| GO:00071626 | Cervix | CC | negative regulation of cell adhesion | 72/2311 | 303/18723 | 2.36e-08 | 1.70e-06 | 72 |
| Page: 1 2 3 4 5 6 7 8 9 10 11 12 13 14 15 16 17 18 19 20 21 22 23 24 25 26 27 28 29 30 31 32 33 34 35 36 37 38 39 40 |
| Pathway ID | Tissue | Disease Stage | Description | Gene Ratio | Bg Ratio | pvalue | p.adjust | qvalue | Count |
| hsa0502018 | Cervix | CC | Prion disease | 98/1267 | 273/8465 | 2.64e-18 | 1.42e-16 | 8.42e-17 | 98 |
| hsa051657 | Cervix | CC | Human papillomavirus infection | 74/1267 | 331/8465 | 1.70e-04 | 1.02e-03 | 6.03e-04 | 74 |
| hsa0491918 | Cervix | CC | Thyroid hormone signaling pathway | 33/1267 | 121/8465 | 3.11e-04 | 1.65e-03 | 9.78e-04 | 33 |
| hsa015223 | Cervix | CC | Endocrine resistance | 28/1267 | 98/8465 | 3.82e-04 | 1.87e-03 | 1.11e-03 | 28 |
| hsa04658 | Cervix | CC | Th1 and Th2 cell differentiation | 24/1267 | 92/8465 | 3.71e-03 | 1.34e-02 | 7.91e-03 | 24 |
| hsa04330 | Cervix | CC | Notch signaling pathway | 17/1267 | 62/8465 | 7.99e-03 | 2.56e-02 | 1.51e-02 | 17 |
| hsa05224 | Cervix | CC | Breast cancer | 32/1267 | 147/8465 | 1.66e-02 | 4.88e-02 | 2.88e-02 | 32 |
| hsa0502019 | Cervix | CC | Prion disease | 98/1267 | 273/8465 | 2.64e-18 | 1.42e-16 | 8.42e-17 | 98 |
| hsa0516512 | Cervix | CC | Human papillomavirus infection | 74/1267 | 331/8465 | 1.70e-04 | 1.02e-03 | 6.03e-04 | 74 |
| hsa0491919 | Cervix | CC | Thyroid hormone signaling pathway | 33/1267 | 121/8465 | 3.11e-04 | 1.65e-03 | 9.78e-04 | 33 |
| hsa0152212 | Cervix | CC | Endocrine resistance | 28/1267 | 98/8465 | 3.82e-04 | 1.87e-03 | 1.11e-03 | 28 |
| hsa046581 | Cervix | CC | Th1 and Th2 cell differentiation | 24/1267 | 92/8465 | 3.71e-03 | 1.34e-02 | 7.91e-03 | 24 |
| hsa043301 | Cervix | CC | Notch signaling pathway | 17/1267 | 62/8465 | 7.99e-03 | 2.56e-02 | 1.51e-02 | 17 |
| hsa052241 | Cervix | CC | Breast cancer | 32/1267 | 147/8465 | 1.66e-02 | 4.88e-02 | 2.88e-02 | 32 |
| hsa0502024 | Cervix | HSIL_HPV | Prion disease | 40/459 | 273/8465 | 6.26e-09 | 3.67e-07 | 2.97e-07 | 40 |
| hsa0502034 | Cervix | HSIL_HPV | Prion disease | 40/459 | 273/8465 | 6.26e-09 | 3.67e-07 | 2.97e-07 | 40 |
| hsa05020210 | Esophagus | ESCC | Prion disease | 193/4205 | 273/8465 | 6.42e-13 | 1.34e-11 | 6.89e-12 | 193 |
| hsa0516510 | Esophagus | ESCC | Human papillomavirus infection | 215/4205 | 331/8465 | 7.86e-09 | 7.12e-08 | 3.65e-08 | 215 |
| hsa0491928 | Esophagus | ESCC | Thyroid hormone signaling pathway | 78/4205 | 121/8465 | 6.79e-04 | 2.23e-03 | 1.14e-03 | 78 |
| hsa015227 | Esophagus | ESCC | Endocrine resistance | 63/4205 | 98/8465 | 2.38e-03 | 6.58e-03 | 3.37e-03 | 63 |
| Page: 1 2 |
Top |
Cell-cell communication analysis |
| Identification of potential cell-cell interactions between two cell types and their ligand-receptor pairs for different disease states |
| Ligand | Receptor | LRpair | Pathway | Tissue | Disease Stage |
| JAG1 | NOTCH1 | JAG1_NOTCH1 | NOTCH | Breast | DCIS |
| DLL4 | NOTCH1 | DLL4_NOTCH1 | NOTCH | Cervix | ADJ |
| JAG1 | NOTCH1 | JAG1_NOTCH1 | NOTCH | Cervix | CC |
| JAG2 | NOTCH1 | JAG2_NOTCH1 | NOTCH | Cervix | CC |
| JAG1 | NOTCH1 | JAG1_NOTCH1 | NOTCH | CRC | AD |
| JAG2 | NOTCH1 | JAG2_NOTCH1 | NOTCH | CRC | AD |
| JAG1 | NOTCH1 | JAG1_NOTCH1 | NOTCH | CRC | ADJ |
| DLL1 | NOTCH1 | DLL1_NOTCH1 | NOTCH | CRC | CRC |
| JAG1 | NOTCH1 | JAG1_NOTCH1 | NOTCH | CRC | CRC |
| DLL4 | NOTCH1 | DLL4_NOTCH1 | NOTCH | CRC | MSI-H |
| JAG1 | NOTCH1 | JAG1_NOTCH1 | NOTCH | CRC | MSI-H |
| JAG2 | NOTCH1 | JAG2_NOTCH1 | NOTCH | CRC | MSI-H |
| DLL1 | NOTCH1 | DLL1_NOTCH1 | NOTCH | CRC | MSS |
| JAG1 | NOTCH1 | JAG1_NOTCH1 | NOTCH | CRC | MSS |
| JAG1 | NOTCH1 | JAG1_NOTCH1 | NOTCH | CRC | SER |
| JAG1 | NOTCH1 | JAG1_NOTCH1 | NOTCH | Endometrium | ADJ |
| DLL4 | NOTCH1 | DLL4_NOTCH1 | NOTCH | Endometrium | AEH |
| JAG1 | NOTCH1 | JAG1_NOTCH1 | NOTCH | Endometrium | AEH |
| DLL4 | NOTCH1 | DLL4_NOTCH1 | NOTCH | Endometrium | EEC |
| JAG1 | NOTCH1 | JAG1_NOTCH1 | NOTCH | Endometrium | EEC |
| Page: 1 |
Top |
Single-cell gene regulatory network inference analysis |
| Find out the significant the regulons (TFs) and the target genes of each regulon across cell types for different disease states |
| TF | Cell Type | Tissue | Disease Stage | Target Gene | RSS | Regulon Activity |
| ∗The dot plots of a searched regulon are shown for all cell subpopulations in each disease state of each tissue based on the regulon specific score inferred using pySCENIC and by calculating the average expression. |
| Page: 1 |
Top |
Somatic mutation of malignant transformation related genes |
| Annotation of somatic variants for genes involved in malignant transformation |
| Hugo Symbol | Variant Class | Variant Classification | dbSNP RS | HGVSc | HGVSp | HGVSp Short | SWISSPROT | BIOTYPE | SIFT | PolyPhen | Tumor Sample Barcode | Tissue | Histology | Sex | Age | Stage | Therapy Types | Drugs | Outcome |
| NOTCH1 | SNV | Missense_Mutation | novel | c.2660N>T | p.Thr887Ile | p.T887I | P46531 | protein_coding | deleterious(0.04) | possibly_damaging(0.597) | TCGA-A2-A3XT-01 | Breast | breast invasive carcinoma | Female | <65 | I/II | Chemotherapy | cyclophosphamide | PR |
| NOTCH1 | SNV | Missense_Mutation | rs200871631 | c.3374C>T | p.Ala1125Val | p.A1125V | P46531 | protein_coding | tolerated(0.46) | benign(0.228) | TCGA-AC-A3W6-01 | Breast | breast invasive carcinoma | Female | >=65 | III/IV | Unknown | Unknown | SD |
| NOTCH1 | SNV | Missense_Mutation | rs747384159 | c.1762A>C | p.Thr588Pro | p.T588P | P46531 | protein_coding | deleterious(0.01) | benign(0.226) | TCGA-AR-A24M-01 | Breast | breast invasive carcinoma | Female | <65 | III/IV | Hormone Therapy | tamoxiphen | SD |
| NOTCH1 | SNV | Missense_Mutation | c.7321N>A | p.Ala2441Thr | p.A2441T | P46531 | protein_coding | tolerated(0.48) | benign(0.003) | TCGA-AR-A254-01 | Breast | breast invasive carcinoma | Female | <65 | III/IV | Chemotherapy | paclitaxel | SD | |
| NOTCH1 | SNV | Missense_Mutation | c.7568C>T | p.Ser2523Leu | p.S2523L | P46531 | protein_coding | deleterious(0) | probably_damaging(0.999) | TCGA-AR-A2LR-01 | Breast | breast invasive carcinoma | Female | <65 | I/II | Chemotherapy | adriamycin | SD | |
| NOTCH1 | SNV | Missense_Mutation | novel | c.7195N>T | p.Pro2399Ser | p.P2399S | P46531 | protein_coding | tolerated(0.63) | benign(0.041) | TCGA-B6-A0IA-01 | Breast | breast invasive carcinoma | Female | <65 | I/II | Unknown | Unknown | SD |
| NOTCH1 | SNV | Missense_Mutation | c.7460N>T | p.Gln2487Leu | p.Q2487L | P46531 | protein_coding | deleterious(0.03) | probably_damaging(0.996) | TCGA-BH-A18V-01 | Breast | breast invasive carcinoma | Female | <65 | I/II | Unknown | Unknown | SD | |
| NOTCH1 | SNV | Missense_Mutation | c.6107C>T | p.Ala2036Val | p.A2036V | P46531 | protein_coding | deleterious(0) | possibly_damaging(0.869) | TCGA-E2-A10C-01 | Breast | breast invasive carcinoma | Female | <65 | I/II | Chemotherapy | cytoxan | SD | |
| NOTCH1 | SNV | Missense_Mutation | rs762886963 | c.1195A>C | p.Thr399Pro | p.T399P | P46531 | protein_coding | deleterious(0.02) | benign(0.053) | TCGA-E2-A1IG-01 | Breast | breast invasive carcinoma | Female | <65 | I/II | Chemotherapy | cyclophosphamide | SD |
| NOTCH1 | SNV | Missense_Mutation | novel | c.4126N>A | p.Gly1376Ser | p.G1376S | P46531 | protein_coding | tolerated(0.93) | benign(0.006) | TCGA-E9-A5UO-01 | Breast | breast invasive carcinoma | Female | <65 | I/II | Unknown | Unknown | SD |
| Page: 1 2 3 4 5 6 7 8 9 10 11 12 13 14 15 16 17 18 19 20 21 22 23 24 25 26 27 28 29 30 31 |
Top |
Related drugs of malignant transformation related genes |
| Identification of chemicals and drugs interact with genes involved in malignant transfromation |
| (DGIdb 4.0) |
| Entrez ID | Symbol | Category | Interaction Types | Drug Claim Name | Drug Name | PMIDs |
| 4851 | NOTCH1 | CLINICALLY ACTIONABLE, DRUGGABLE GENOME, TRANSPORTER, CELL SURFACE | LY3039478 | CRENIGACESTAT | ||
| 4851 | NOTCH1 | CLINICALLY ACTIONABLE, DRUGGABLE GENOME, TRANSPORTER, CELL SURFACE | antibody | REGN421 | ||
| 4851 | NOTCH1 | CLINICALLY ACTIONABLE, DRUGGABLE GENOME, TRANSPORTER, CELL SURFACE | OMP-52M51 | BRONTICTUZUMAB | ||
| 4851 | NOTCH1 | CLINICALLY ACTIONABLE, DRUGGABLE GENOME, TRANSPORTER, CELL SURFACE | LY3039478 | CRENIGACESTAT | ||
| 4851 | NOTCH1 | CLINICALLY ACTIONABLE, DRUGGABLE GENOME, TRANSPORTER, CELL SURFACE | Bortezomib | BORTEZOMIB | 28151717 | |
| 4851 | NOTCH1 | CLINICALLY ACTIONABLE, DRUGGABLE GENOME, TRANSPORTER, CELL SURFACE | RO4929097 | RG-4733 | 27154916 | |
| 4851 | NOTCH1 | CLINICALLY ACTIONABLE, DRUGGABLE GENOME, TRANSPORTER, CELL SURFACE | MRK-003 | 25104330 | ||
| 4851 | NOTCH1 | CLINICALLY ACTIONABLE, DRUGGABLE GENOME, TRANSPORTER, CELL SURFACE | PF-03084014 | NIROGACESTAT | 26202948,25564152,23868008 | |
| 4851 | NOTCH1 | CLINICALLY ACTIONABLE, DRUGGABLE GENOME, TRANSPORTER, CELL SURFACE | Everolimus | EVEROLIMUS | 28151717 | |
| 4851 | NOTCH1 | CLINICALLY ACTIONABLE, DRUGGABLE GENOME, TRANSPORTER, CELL SURFACE | Methotrexate | METHOTREXATE | 28151717 |
| Page: 1 2 3 |

Copyright 2023-Present -The University of Texas Health Science Center at Houston |