
|
|||||
|
 | |
| |
| |
| |
| |
| |
|
Gene: NOS1AP |
Gene summary for NOS1AP |
| Gene information | Species | Human | Gene symbol | NOS1AP | Gene ID | 9722 |
| Gene name | nitric oxide synthase 1 adaptor protein | |
| Gene Alias | 6330408P19Rik | |
| Cytomap | 1q23.3 | |
| Gene Type | protein-coding | GO ID | GO:0001508 | UniProtAcc | O75052 |
Top |
Malignant transformation analysis |
| Identification of the aberrant gene expression in precancerous and cancerous lesions by comparing the gene expression of stem-like cells in diseased tissues with normal stem cells |
| Entrez ID | Symbol | Replicates | Species | Organ | Tissue | Adj P-value | Log2FC | Malignancy |
| 9722 | NOS1AP | HTA11_3410_2000001011 | Human | Colorectum | AD | 1.04e-07 | -4.20e-01 | 0.0155 |
| 9722 | NOS1AP | HTA11_2487_2000001011 | Human | Colorectum | SER | 5.22e-03 | -2.97e-01 | -0.1808 |
| 9722 | NOS1AP | HTA11_3361_2000001011 | Human | Colorectum | AD | 2.26e-02 | -4.24e-01 | -0.1207 |
| 9722 | NOS1AP | HTA11_866_3004761011 | Human | Colorectum | AD | 6.80e-08 | -4.43e-01 | 0.096 |
| 9722 | NOS1AP | HTA11_10711_2000001011 | Human | Colorectum | AD | 7.52e-05 | -5.13e-01 | 0.0338 |
| 9722 | NOS1AP | HTA11_7696_3000711011 | Human | Colorectum | AD | 1.29e-02 | -3.02e-01 | 0.0674 |
| 9722 | NOS1AP | HTA11_99999970781_79442 | Human | Colorectum | MSS | 3.25e-13 | -4.48e-01 | 0.294 |
| 9722 | NOS1AP | HTA11_99999974143_84620 | Human | Colorectum | MSS | 2.19e-14 | -4.79e-01 | 0.3005 |
| 9722 | NOS1AP | A002-C-010 | Human | Colorectum | FAP | 1.90e-02 | -1.24e-01 | 0.242 |
| 9722 | NOS1AP | A015-C-203 | Human | Colorectum | FAP | 3.43e-26 | -5.28e-01 | -0.1294 |
| 9722 | NOS1AP | A015-C-204 | Human | Colorectum | FAP | 3.96e-08 | -4.45e-01 | -0.0228 |
| 9722 | NOS1AP | A014-C-040 | Human | Colorectum | FAP | 1.45e-02 | -4.00e-01 | -0.1184 |
| 9722 | NOS1AP | A002-C-201 | Human | Colorectum | FAP | 1.91e-07 | -2.44e-01 | 0.0324 |
| 9722 | NOS1AP | A001-C-119 | Human | Colorectum | FAP | 7.67e-10 | -5.57e-01 | -0.1557 |
| 9722 | NOS1AP | A001-C-108 | Human | Colorectum | FAP | 8.60e-16 | -4.05e-01 | -0.0272 |
| 9722 | NOS1AP | A002-C-205 | Human | Colorectum | FAP | 1.06e-17 | -5.12e-01 | -0.1236 |
| 9722 | NOS1AP | A001-C-104 | Human | Colorectum | FAP | 5.78e-09 | -3.80e-01 | 0.0184 |
| 9722 | NOS1AP | A015-C-005 | Human | Colorectum | FAP | 7.27e-03 | -3.12e-01 | -0.0336 |
| 9722 | NOS1AP | A015-C-006 | Human | Colorectum | FAP | 1.26e-11 | -4.53e-01 | -0.0994 |
| 9722 | NOS1AP | A015-C-106 | Human | Colorectum | FAP | 5.06e-14 | -3.92e-01 | -0.0511 |
| Page: 1 2 3 4 5 6 |
| Tissue | Expression Dynamics | Abbreviation |
| Colorectum (GSE201348) |  | FAP: Familial adenomatous polyposis |
| CRC: Colorectal cancer | ||
| Colorectum (HTA11) |  | AD: Adenomas |
| SER: Sessile serrated lesions | ||
| MSI-H: Microsatellite-high colorectal cancer | ||
| MSS: Microsatellite stable colorectal cancer | ||
| Esophagus | 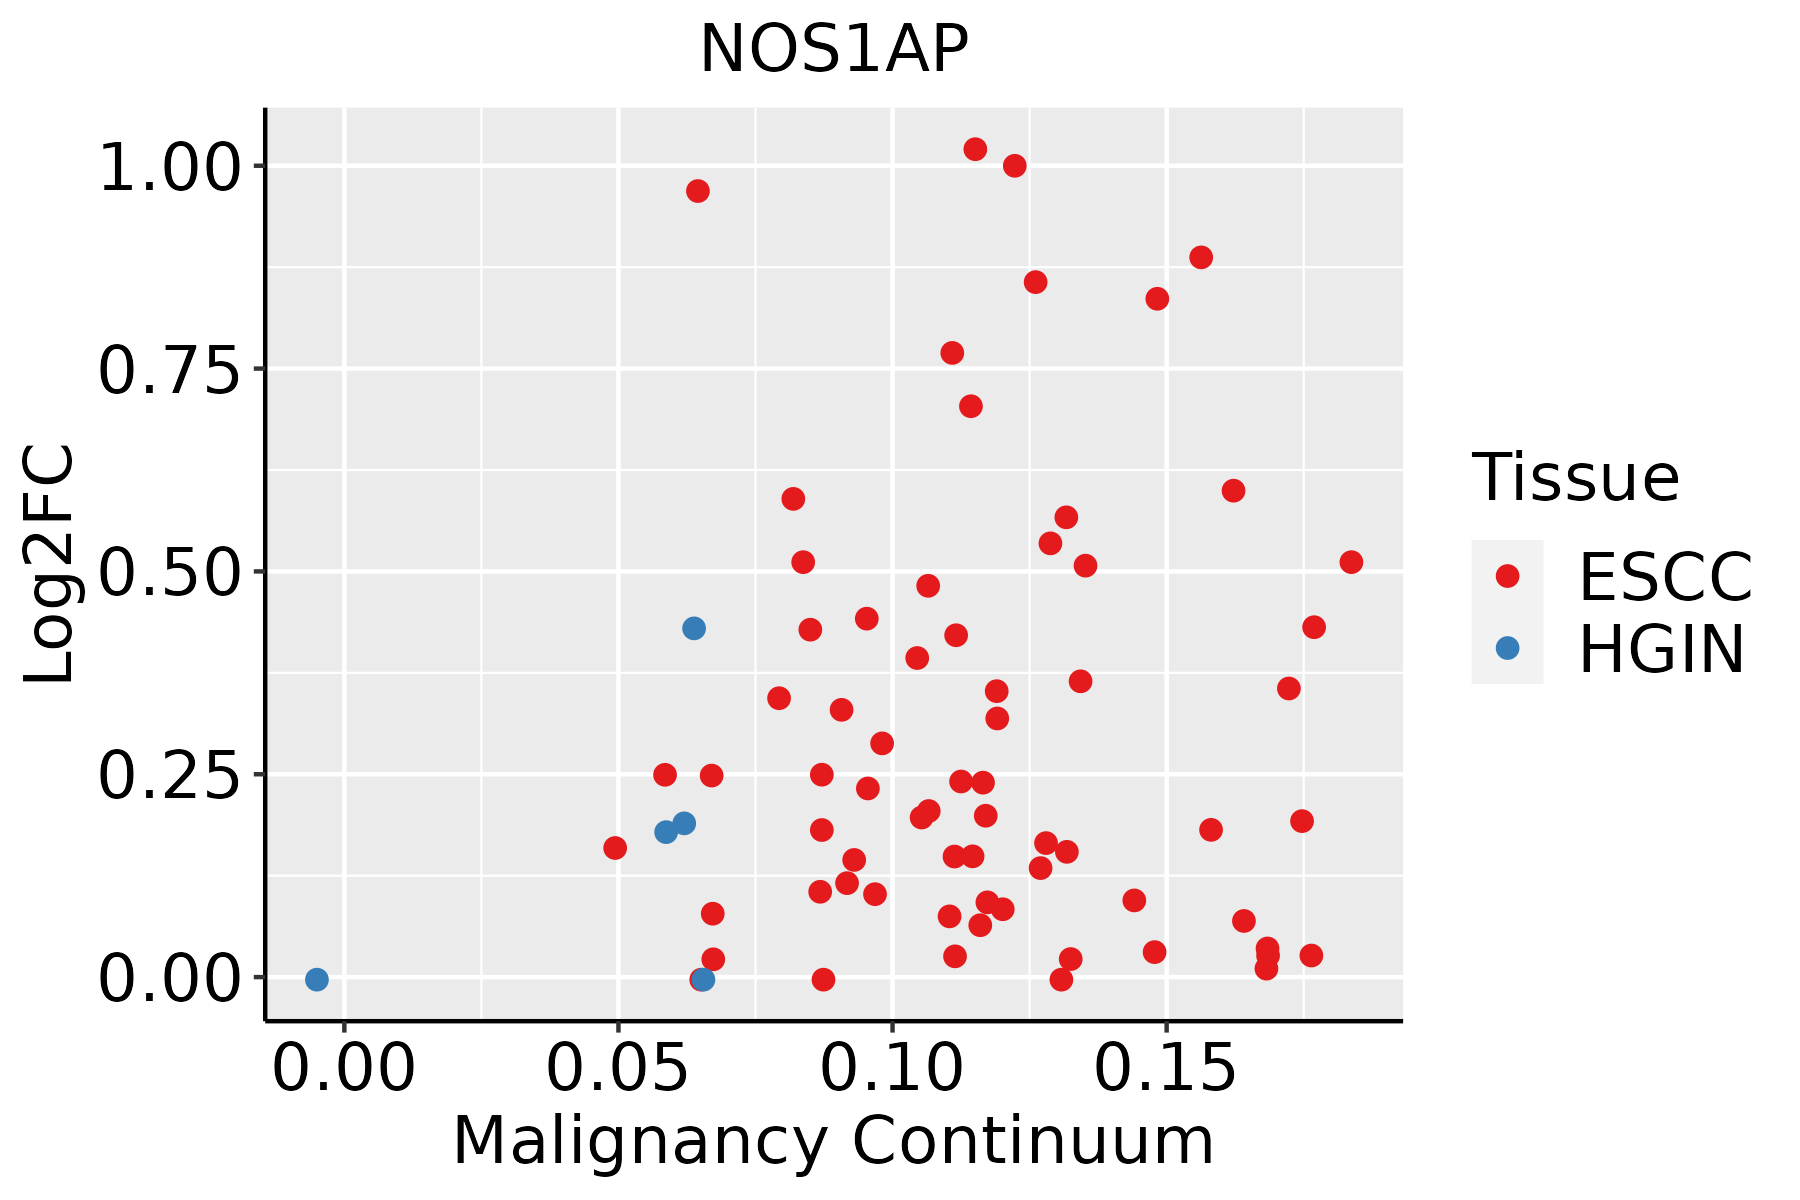 | ESCC: Esophageal squamous cell carcinoma |
| HGIN: High-grade intraepithelial neoplasias | ||
| LGIN: Low-grade intraepithelial neoplasias | ||
| Liver |  | HCC: Hepatocellular carcinoma |
| NAFLD: Non-alcoholic fatty liver disease | ||
| Lung |  | AAH: Atypical adenomatous hyperplasia |
| AIS: Adenocarcinoma in situ | ||
| IAC: Invasive lung adenocarcinoma | ||
| MIA: Minimally invasive adenocarcinoma | ||
| Oral Cavity | 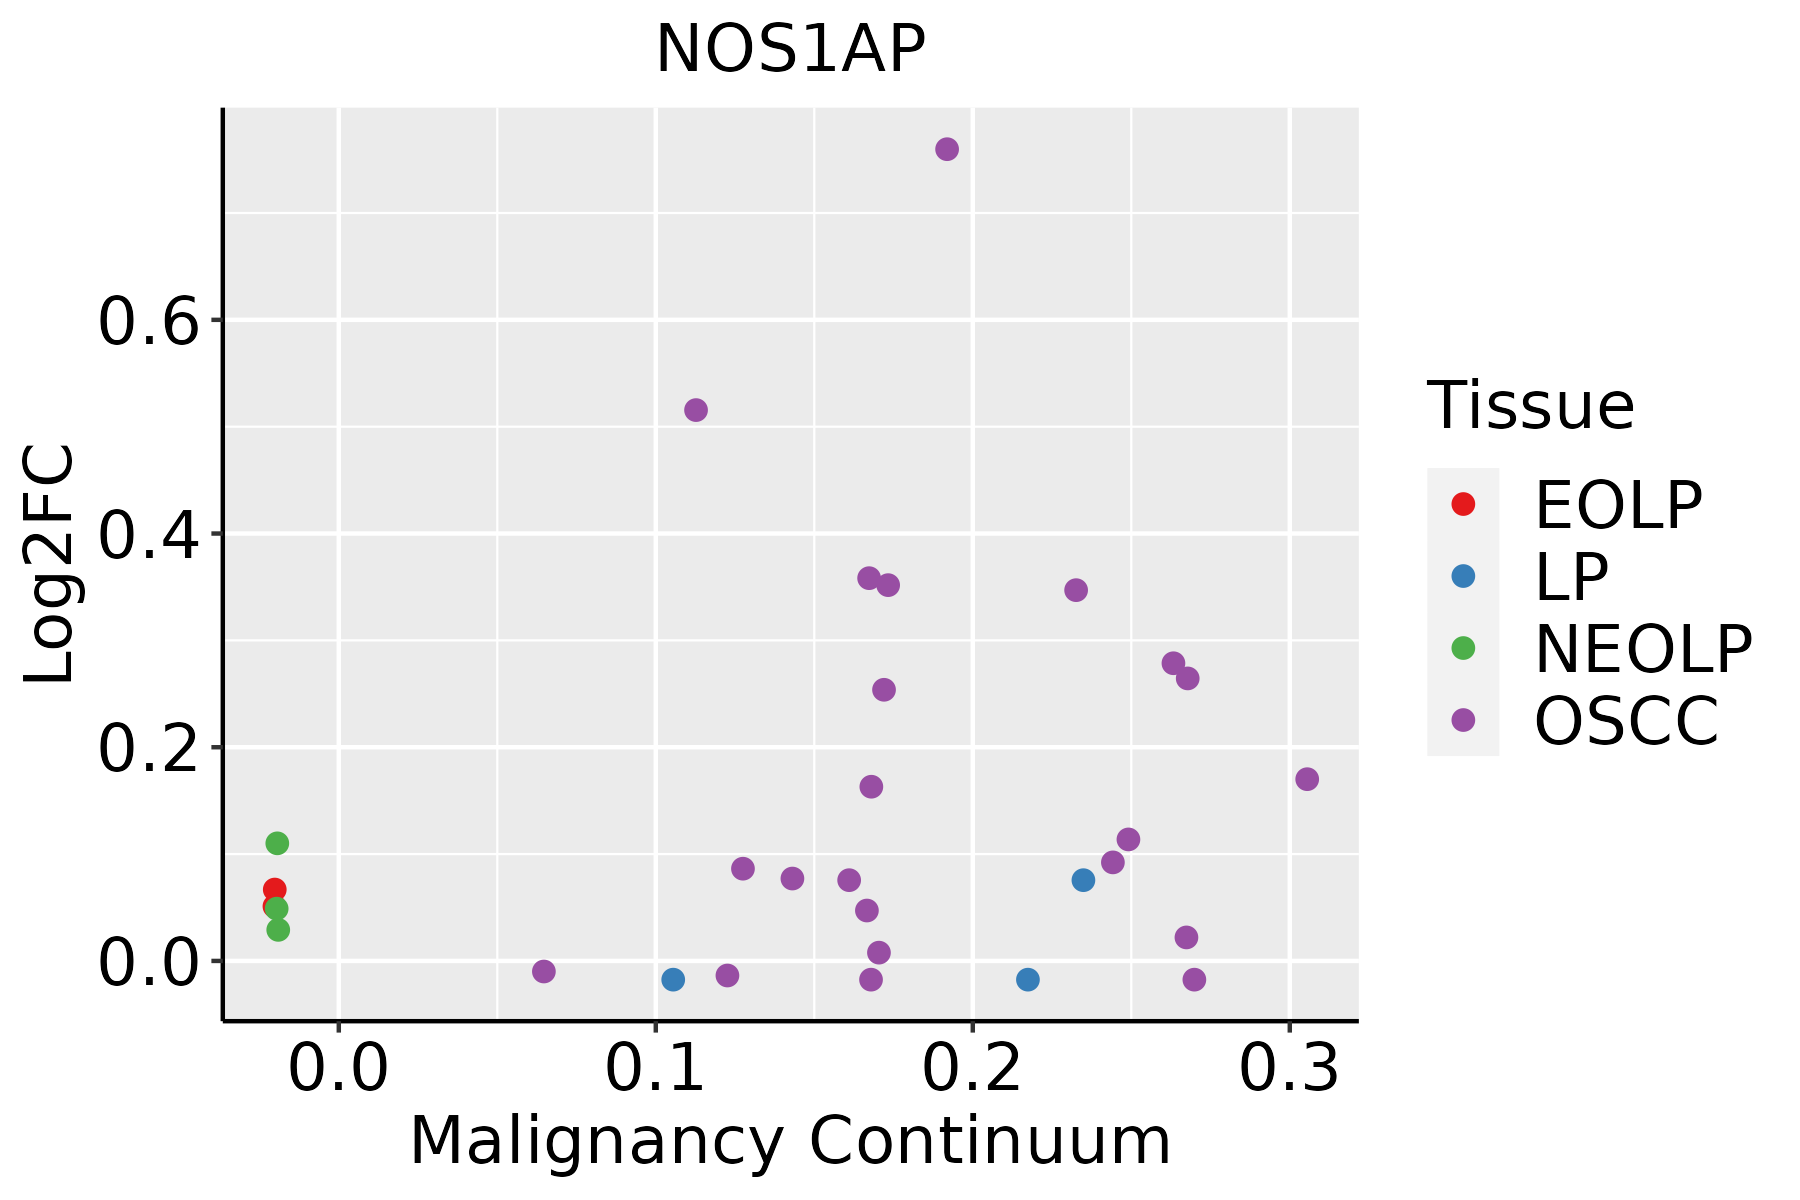 | EOLP: Erosive Oral lichen planus |
| LP: leukoplakia | ||
| NEOLP: Non-erosive oral lichen planus | ||
| OSCC: Oral squamous cell carcinoma |
| ∗log2FC in expression of this searched gene in stem-like cells from each diseased tissue sample relative to stem-like cells in normal samples in each tissue plotted against the malignancy continuum. Samples are colored based on if they are from different disease stage. |
Top |
Malignant transformation related pathway analysis |
| Find out the enriched GO biological processes and KEGG pathways involved in transition from healthy to precancer to cancer |
| Tissue | Disease Stage | Enriched GO biological Processes |
| Colorectum | AD |  |
| Colorectum | SER |  |
| Colorectum | MSS |  |
| Colorectum | MSI-H |  |
| Colorectum | FAP |  |
| ∗Top 15 enriched GO BP terms are showed in the bar plot of each disease state in each tissue. Each row represents a significant GO biological process which is colored according to the -log10(p.adjust). |
| Page: 1 2 3 4 5 6 7 8 9 |
| GO ID | Tissue | Disease Stage | Description | Gene Ratio | Bg Ratio | pvalue | p.adjust | Count |
| GO:0098901 | Colorectum | AD | regulation of cardiac muscle cell action potential | 15/3918 | 27/18723 | 8.20e-05 | 1.29e-03 | 15 |
| GO:0006809 | Colorectum | AD | nitric oxide biosynthetic process | 30/3918 | 76/18723 | 1.72e-04 | 2.33e-03 | 30 |
| GO:0030048 | Colorectum | AD | actin filament-based movement | 44/3918 | 127/18723 | 2.31e-04 | 2.99e-03 | 44 |
| GO:0046209 | Colorectum | AD | nitric oxide metabolic process | 31/3918 | 81/18723 | 2.61e-04 | 3.25e-03 | 31 |
| GO:2001057 | Colorectum | AD | reactive nitrogen species metabolic process | 31/3918 | 82/18723 | 3.37e-04 | 3.94e-03 | 31 |
| GO:0045429 | Colorectum | AD | positive regulation of nitric oxide biosynthetic process | 17/3918 | 40/18723 | 1.66e-03 | 1.38e-02 | 17 |
| GO:1904407 | Colorectum | AD | positive regulation of nitric oxide metabolic process | 17/3918 | 41/18723 | 2.29e-03 | 1.79e-02 | 17 |
| GO:0099173 | Colorectum | AD | postsynapse organization | 51/3918 | 168/18723 | 2.47e-03 | 1.90e-02 | 51 |
| GO:0080164 | Colorectum | AD | regulation of nitric oxide metabolic process | 23/3918 | 64/18723 | 3.99e-03 | 2.80e-02 | 23 |
| GO:0050808 | Colorectum | AD | synapse organization | 112/3918 | 426/18723 | 4.25e-03 | 2.92e-02 | 112 |
| GO:0098974 | Colorectum | AD | postsynaptic actin cytoskeleton organization | 7/3918 | 12/18723 | 5.09e-03 | 3.38e-02 | 7 |
| GO:0045428 | Colorectum | AD | regulation of nitric oxide biosynthetic process | 22/3918 | 62/18723 | 5.72e-03 | 3.64e-02 | 22 |
| GO:0051353 | Colorectum | AD | positive regulation of oxidoreductase activity | 21/3918 | 59/18723 | 6.58e-03 | 4.08e-02 | 21 |
| GO:0032411 | Colorectum | AD | positive regulation of transporter activity | 37/3918 | 120/18723 | 6.82e-03 | 4.22e-02 | 37 |
| GO:00068091 | Colorectum | SER | nitric oxide biosynthetic process | 27/2897 | 76/18723 | 1.38e-05 | 4.28e-04 | 27 |
| GO:00462091 | Colorectum | SER | nitric oxide metabolic process | 28/2897 | 81/18723 | 1.73e-05 | 5.15e-04 | 28 |
| GO:20010571 | Colorectum | SER | reactive nitrogen species metabolic process | 28/2897 | 82/18723 | 2.24e-05 | 6.43e-04 | 28 |
| GO:00300481 | Colorectum | SER | actin filament-based movement | 38/2897 | 127/18723 | 2.80e-05 | 7.56e-04 | 38 |
| GO:00991731 | Colorectum | SER | postsynapse organization | 46/2897 | 168/18723 | 5.20e-05 | 1.25e-03 | 46 |
| GO:00989011 | Colorectum | SER | regulation of cardiac muscle cell action potential | 12/2897 | 27/18723 | 3.27e-04 | 5.22e-03 | 12 |
| Page: 1 2 3 4 5 6 7 8 9 10 |
| Pathway ID | Tissue | Disease Stage | Description | Gene Ratio | Bg Ratio | pvalue | p.adjust | qvalue | Count |
| hsa04713 | Colorectum | MSS | Circadian entrainment | 32/1875 | 97/8465 | 8.84e-03 | 3.25e-02 | 1.99e-02 | 32 |
| hsa047131 | Colorectum | MSS | Circadian entrainment | 32/1875 | 97/8465 | 8.84e-03 | 3.25e-02 | 1.99e-02 | 32 |
| hsa047132 | Colorectum | CRC | Circadian entrainment | 22/1091 | 97/8465 | 5.21e-03 | 2.72e-02 | 1.84e-02 | 22 |
| hsa047133 | Colorectum | CRC | Circadian entrainment | 22/1091 | 97/8465 | 5.21e-03 | 2.72e-02 | 1.84e-02 | 22 |
| Page: 1 |
Top |
Cell-cell communication analysis |
| Identification of potential cell-cell interactions between two cell types and their ligand-receptor pairs for different disease states |
| Ligand | Receptor | LRpair | Pathway | Tissue | Disease Stage |
| Page: 1 |
Top |
Single-cell gene regulatory network inference analysis |
| Find out the significant the regulons (TFs) and the target genes of each regulon across cell types for different disease states |
| TF | Cell Type | Tissue | Disease Stage | Target Gene | RSS | Regulon Activity |
| ∗The dot plots of a searched regulon are shown for all cell subpopulations in each disease state of each tissue based on the regulon specific score inferred using pySCENIC and by calculating the average expression. |
| Page: 1 |
Top |
Somatic mutation of malignant transformation related genes |
| Annotation of somatic variants for genes involved in malignant transformation |
| Hugo Symbol | Variant Class | Variant Classification | dbSNP RS | HGVSc | HGVSp | HGVSp Short | SWISSPROT | BIOTYPE | SIFT | PolyPhen | Tumor Sample Barcode | Tissue | Histology | Sex | Age | Stage | Therapy Types | Drugs | Outcome |
| NOS1AP | SNV | Missense_Mutation | c.1423N>A | p.Glu475Lys | p.E475K | O75052 | protein_coding | deleterious_low_confidence(0.01) | benign(0.156) | TCGA-A2-A0EM-01 | Breast | breast invasive carcinoma | Female | >=65 | I/II | Hormone Therapy | tamoxiphen | SD | |
| NOS1AP | SNV | Missense_Mutation | novel | c.811C>T | p.Leu271Phe | p.L271F | O75052 | protein_coding | tolerated(0.05) | probably_damaging(0.96) | TCGA-AN-A046-01 | Breast | breast invasive carcinoma | Female | >=65 | I/II | Unknown | Unknown | SD |
| NOS1AP | SNV | Missense_Mutation | novel | c.826T>C | p.Ser276Pro | p.S276P | O75052 | protein_coding | tolerated(0.28) | benign(0) | TCGA-AN-A04D-01 | Breast | breast invasive carcinoma | Female | <65 | I/II | Unknown | Unknown | SD |
| NOS1AP | SNV | Missense_Mutation | c.364N>T | p.Asp122Tyr | p.D122Y | O75052 | protein_coding | deleterious(0) | probably_damaging(1) | TCGA-D8-A13Z-01 | Breast | breast invasive carcinoma | Female | <65 | I/II | Chemotherapy | doxorubicine | SD | |
| NOS1AP | SNV | Missense_Mutation | c.314A>T | p.Lys105Met | p.K105M | O75052 | protein_coding | deleterious(0) | probably_damaging(0.986) | TCGA-D8-A1JK-01 | Breast | breast invasive carcinoma | Female | >=65 | I/II | Unknown | Unknown | SD | |
| NOS1AP | insertion | Nonsense_Mutation | novel | c.544_545insACATCACTCATTTCTGTCCTTGAAAGAAAGCAAAA | p.Gly182AspfsTer8 | p.G182Dfs*8 | O75052 | protein_coding | TCGA-BH-A0DS-01 | Breast | breast invasive carcinoma | Female | >=65 | III/IV | Chemotherapy | cyclophosphamide | SD | ||
| NOS1AP | insertion | Frame_Shift_Ins | novel | c.852_853insTTAAGCAGTATGCTGTGCCTGTGGTTAAATATTA | p.Thr285LeufsTer51 | p.T285Lfs*51 | O75052 | protein_coding | TCGA-BH-A0DS-01 | Breast | breast invasive carcinoma | Female | >=65 | III/IV | Chemotherapy | cyclophosphamide | SD | ||
| NOS1AP | deletion | Frame_Shift_Del | novel | c.1268delA | p.Asp423AlafsTer4 | p.D423Afs*4 | O75052 | protein_coding | TCGA-D8-A27V-01 | Breast | breast invasive carcinoma | Female | <65 | I/II | Hormone Therapy | tamoxiphen | SD | ||
| NOS1AP | SNV | Missense_Mutation | novel | c.534G>C | p.Gln178His | p.Q178H | O75052 | protein_coding | deleterious(0.01) | probably_damaging(0.922) | TCGA-C5-A902-01 | Cervix | cervical & endocervical cancer | Female | <65 | I/II | Chemotherapy | cisplatin | SD |
| NOS1AP | SNV | Missense_Mutation | novel | c.970N>C | p.Glu324Gln | p.E324Q | O75052 | protein_coding | deleterious(0) | probably_damaging(0.996) | TCGA-HM-A4S6-01 | Cervix | cervical & endocervical cancer | Female | <65 | III/IV | Chemotherapy | cisplatin | CR |
| Page: 1 2 3 4 5 6 7 |
Top |
Related drugs of malignant transformation related genes |
| Identification of chemicals and drugs interact with genes involved in malignant transfromation |
| (DGIdb 4.0) |
| Entrez ID | Symbol | Category | Interaction Types | Drug Claim Name | Drug Name | PMIDs |
| 9722 | NOS1AP | NA | verapamil | VERAPAMIL | 19247217 | |
| 9722 | NOS1AP | NA | Dihydropyridine derivatives | |||
| 9722 | NOS1AP | NA | amiodarone | AMIODARONE | ||
| 9722 | NOS1AP | NA | granisetron | GRANISETRON | 21663814 | |
| 9722 | NOS1AP | NA | dolasetron | DOLASETRON | 21663814 | |
| 9722 | NOS1AP | NA | repaglinide | REPAGLINIDE |
| Page: 1 |

Copyright 2023-Present -The University of Texas Health Science Center at Houston |