
|
|||||
|
 | |
| |
| |
| |
| |
| |
|
Gene: NOP56 |
Gene summary for NOP56 |
| Gene information | Species | Human | Gene symbol | NOP56 | Gene ID | 10528 |
| Gene name | NOP56 ribonucleoprotein | |
| Gene Alias | NOL5A | |
| Cytomap | 20p13 | |
| Gene Type | protein-coding | GO ID | GO:0006139 | UniProtAcc | O00567 |
Top |
Malignant transformation analysis |
| Identification of the aberrant gene expression in precancerous and cancerous lesions by comparing the gene expression of stem-like cells in diseased tissues with normal stem cells |
| Entrez ID | Symbol | Replicates | Species | Organ | Tissue | Adj P-value | Log2FC | Malignancy |
| 10528 | NOP56 | HTA11_1938_2000001011 | Human | Colorectum | AD | 1.68e-03 | 4.04e-01 | -0.0811 |
| 10528 | NOP56 | HTA11_347_2000001011 | Human | Colorectum | AD | 1.04e-03 | 2.70e-01 | -0.1954 |
| 10528 | NOP56 | HTA11_1391_2000001011 | Human | Colorectum | AD | 4.56e-08 | 6.17e-01 | -0.059 |
| 10528 | NOP56 | HTA11_866_3004761011 | Human | Colorectum | AD | 2.23e-08 | 4.85e-01 | 0.096 |
| 10528 | NOP56 | HTA11_6818_2000001021 | Human | Colorectum | AD | 1.32e-02 | 2.29e-01 | 0.0588 |
| 10528 | NOP56 | HTA11_99999970781_79442 | Human | Colorectum | MSS | 1.02e-02 | 2.17e-01 | 0.294 |
| 10528 | NOP56 | HTA11_99999965062_69753 | Human | Colorectum | MSI-H | 1.59e-03 | 1.10e+00 | 0.3487 |
| 10528 | NOP56 | HTA11_99999965104_69814 | Human | Colorectum | MSS | 2.28e-22 | 1.10e+00 | 0.281 |
| 10528 | NOP56 | HTA11_99999971662_82457 | Human | Colorectum | MSS | 1.17e-03 | 3.55e-01 | 0.3859 |
| 10528 | NOP56 | HTA11_99999973899_84307 | Human | Colorectum | MSS | 1.80e-02 | 4.80e-01 | 0.2585 |
| 10528 | NOP56 | HTA11_99999974143_84620 | Human | Colorectum | MSS | 2.43e-13 | 6.05e-01 | 0.3005 |
| 10528 | NOP56 | A001-C-119 | Human | Colorectum | FAP | 4.71e-04 | 5.58e-01 | -0.1557 |
| 10528 | NOP56 | A002-C-205 | Human | Colorectum | FAP | 7.53e-04 | 3.61e-01 | -0.1236 |
| 10528 | NOP56 | A015-C-006 | Human | Colorectum | FAP | 4.47e-07 | 5.88e-01 | -0.0994 |
| 10528 | NOP56 | A015-C-104 | Human | Colorectum | FAP | 4.92e-03 | 2.13e-01 | -0.1899 |
| 10528 | NOP56 | A002-C-116 | Human | Colorectum | FAP | 5.12e-03 | 9.57e-02 | -0.0452 |
| 10528 | NOP56 | F034 | Human | Colorectum | FAP | 4.00e-04 | 3.13e-01 | -0.0665 |
| 10528 | NOP56 | LZE4T | Human | Esophagus | ESCC | 7.31e-20 | 2.76e-01 | 0.0811 |
| 10528 | NOP56 | LZE5T | Human | Esophagus | ESCC | 8.36e-04 | 9.82e-02 | 0.0514 |
| 10528 | NOP56 | LZE7T | Human | Esophagus | ESCC | 4.68e-07 | 6.41e-01 | 0.0667 |
| Page: 1 2 3 4 5 6 7 8 |
| Tissue | Expression Dynamics | Abbreviation |
| Colorectum (GSE201348) |  | FAP: Familial adenomatous polyposis |
| CRC: Colorectal cancer | ||
| Colorectum (HTA11) |  | AD: Adenomas |
| SER: Sessile serrated lesions | ||
| MSI-H: Microsatellite-high colorectal cancer | ||
| MSS: Microsatellite stable colorectal cancer | ||
| Esophagus | 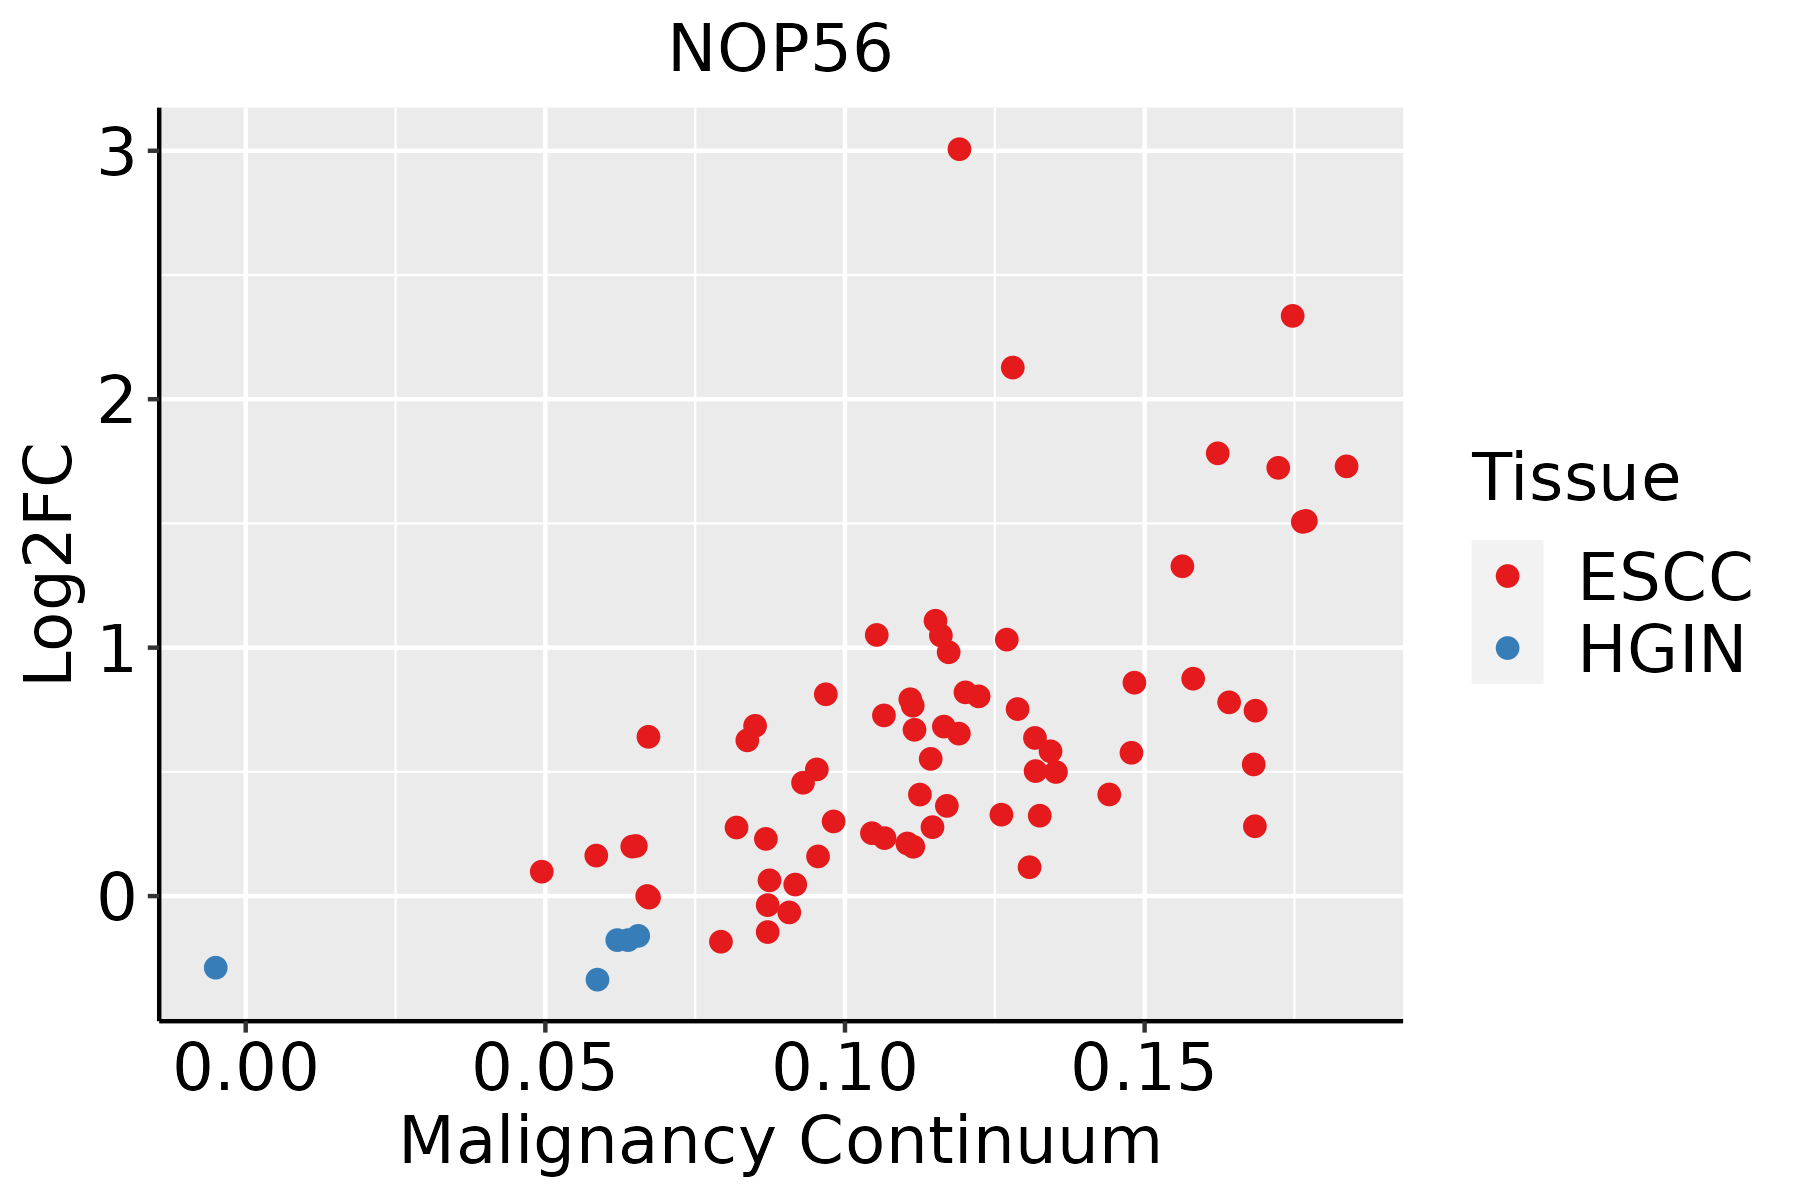 | ESCC: Esophageal squamous cell carcinoma |
| HGIN: High-grade intraepithelial neoplasias | ||
| LGIN: Low-grade intraepithelial neoplasias | ||
| Liver | 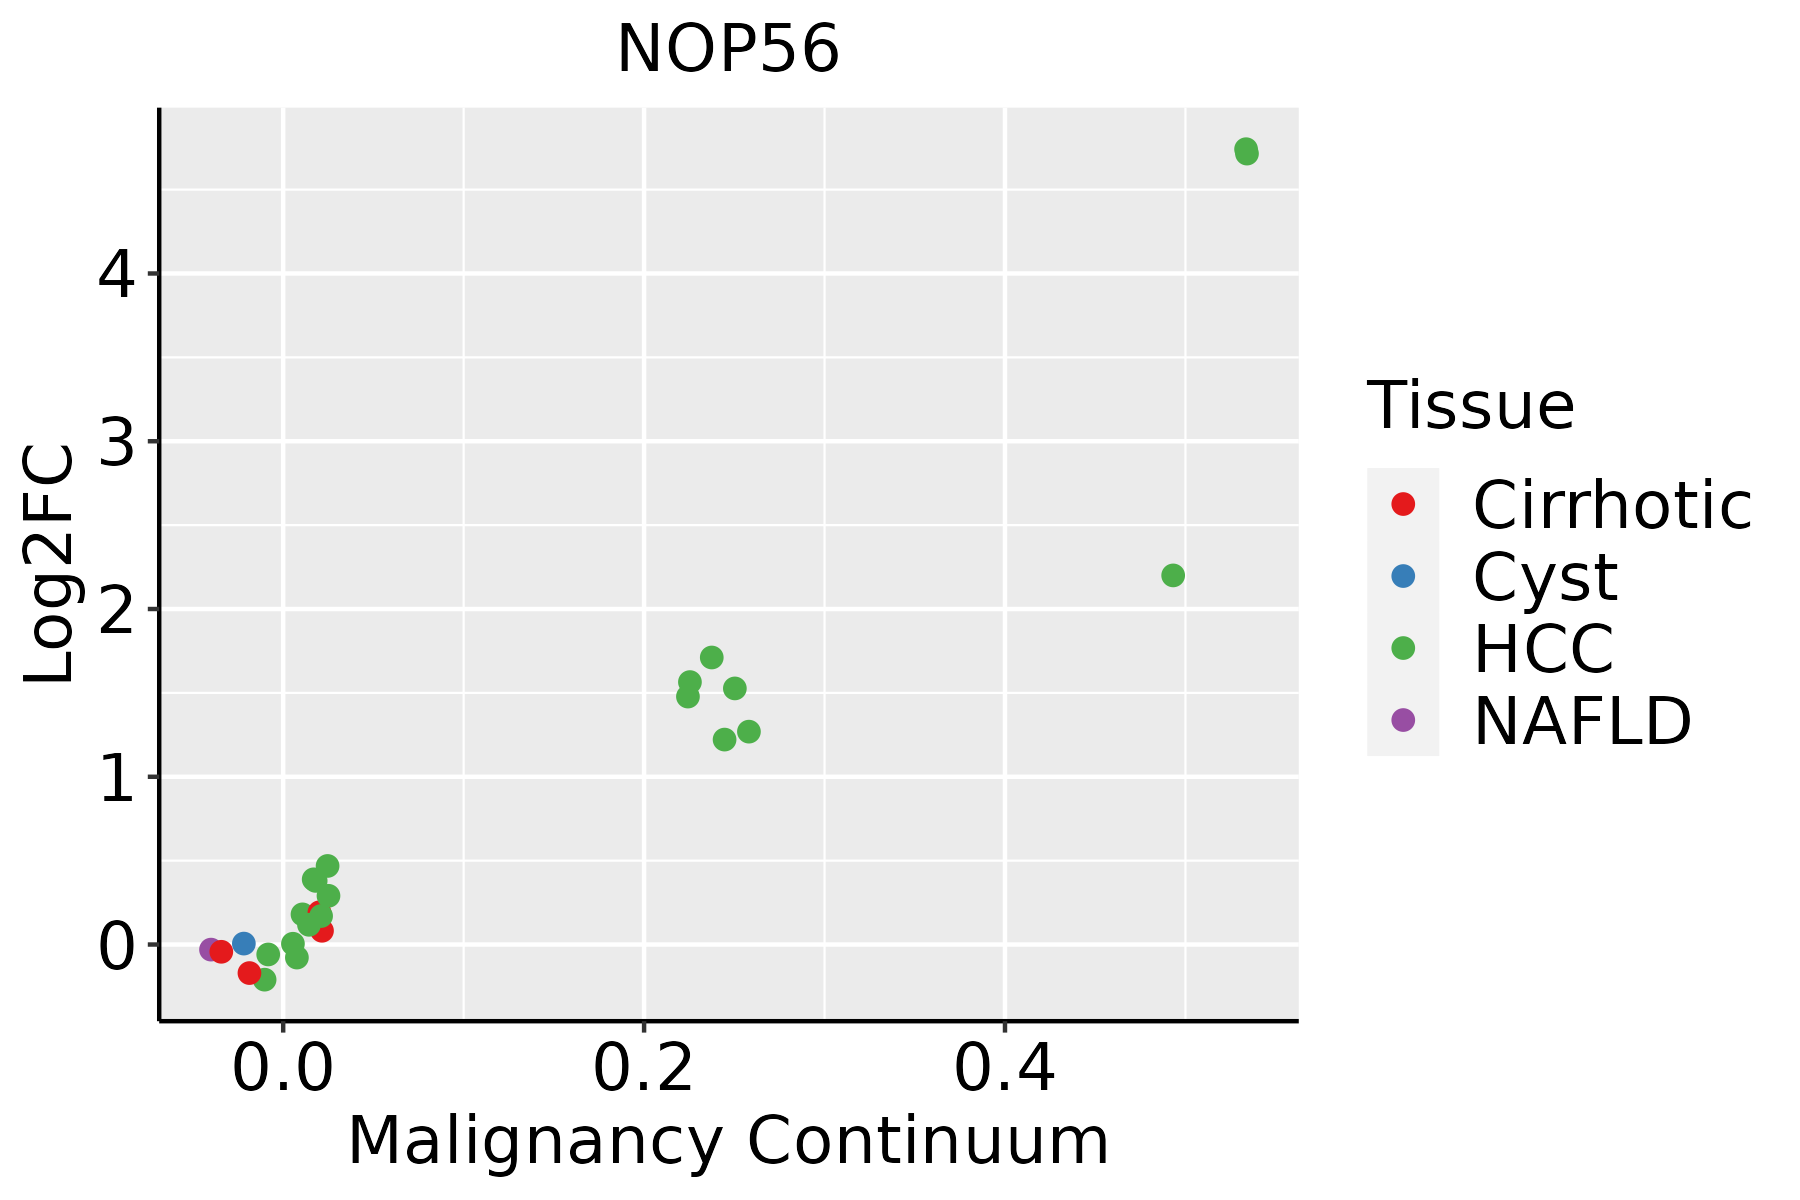 | HCC: Hepatocellular carcinoma |
| NAFLD: Non-alcoholic fatty liver disease | ||
| Oral Cavity | 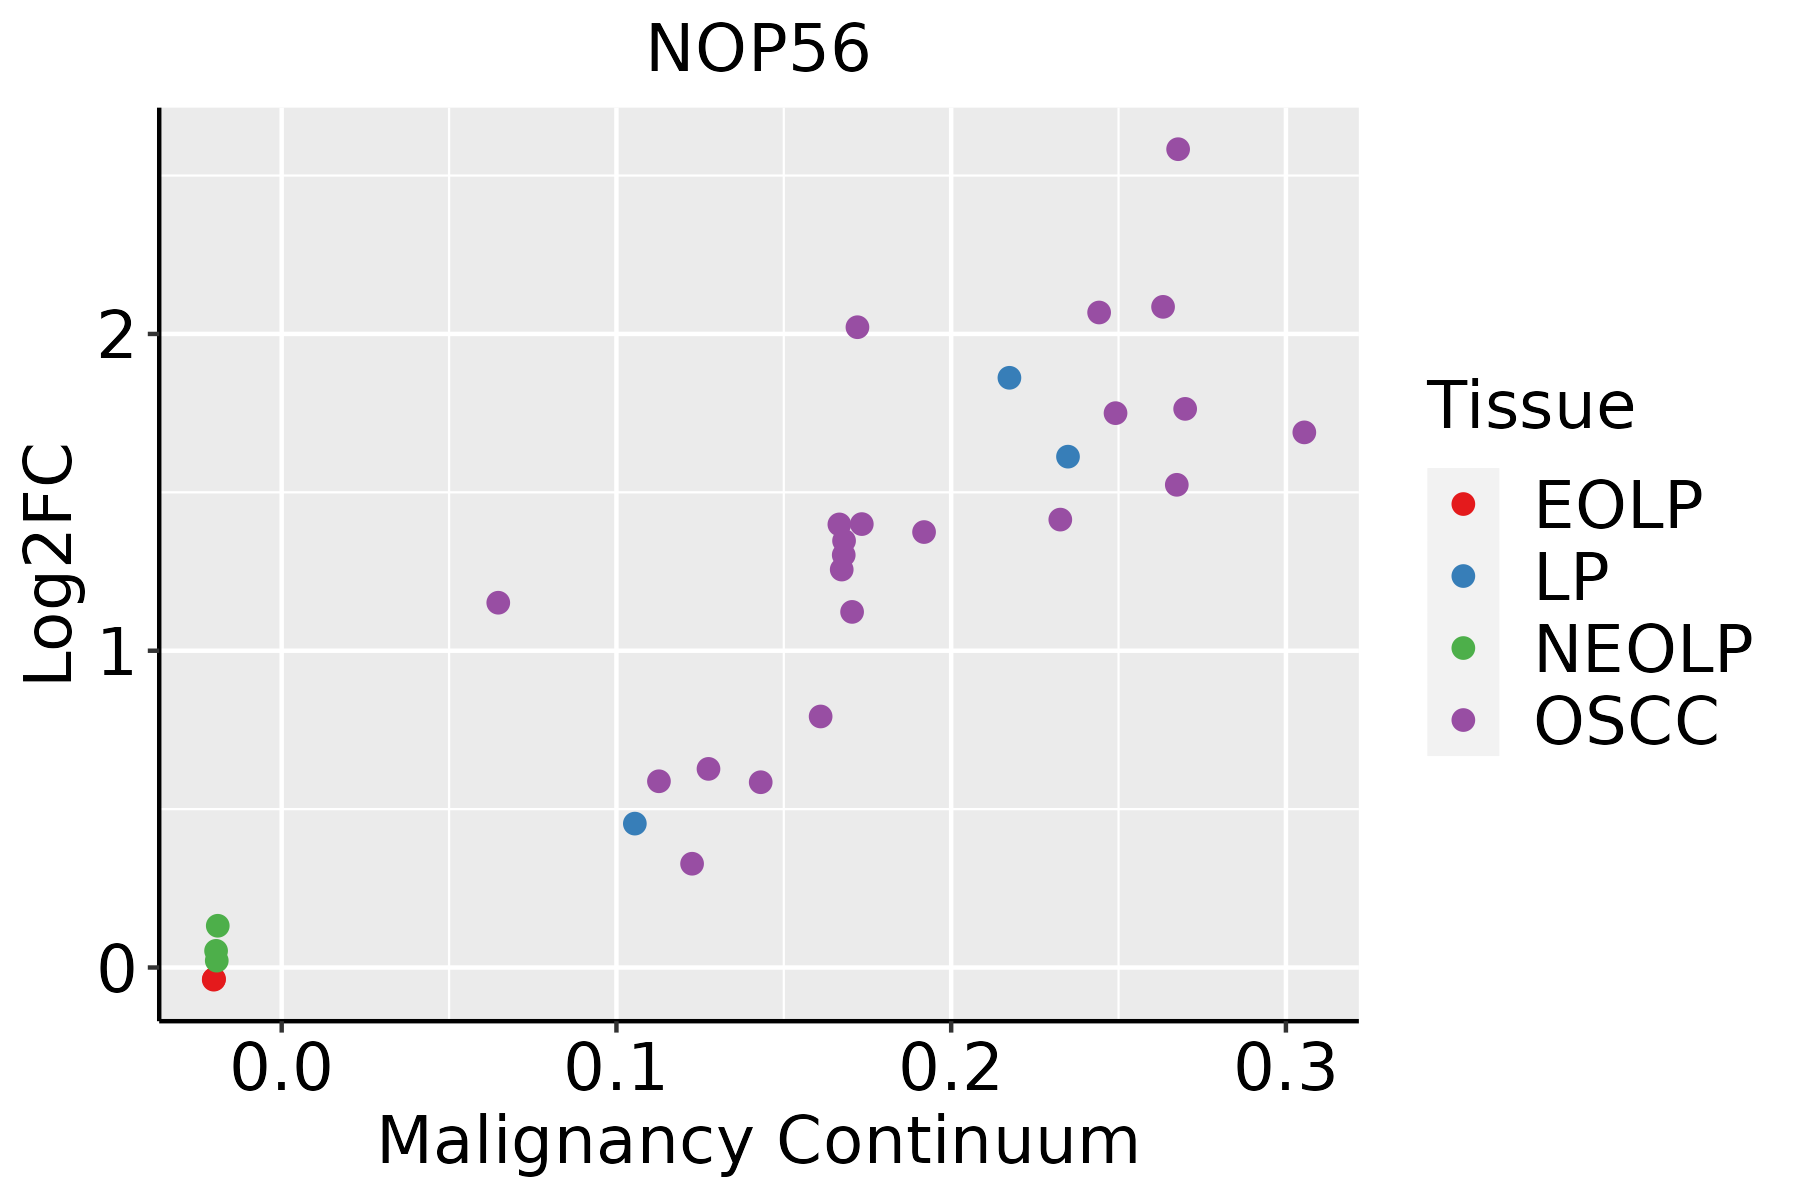 | EOLP: Erosive Oral lichen planus |
| LP: leukoplakia | ||
| NEOLP: Non-erosive oral lichen planus | ||
| OSCC: Oral squamous cell carcinoma | ||
| Prostate | 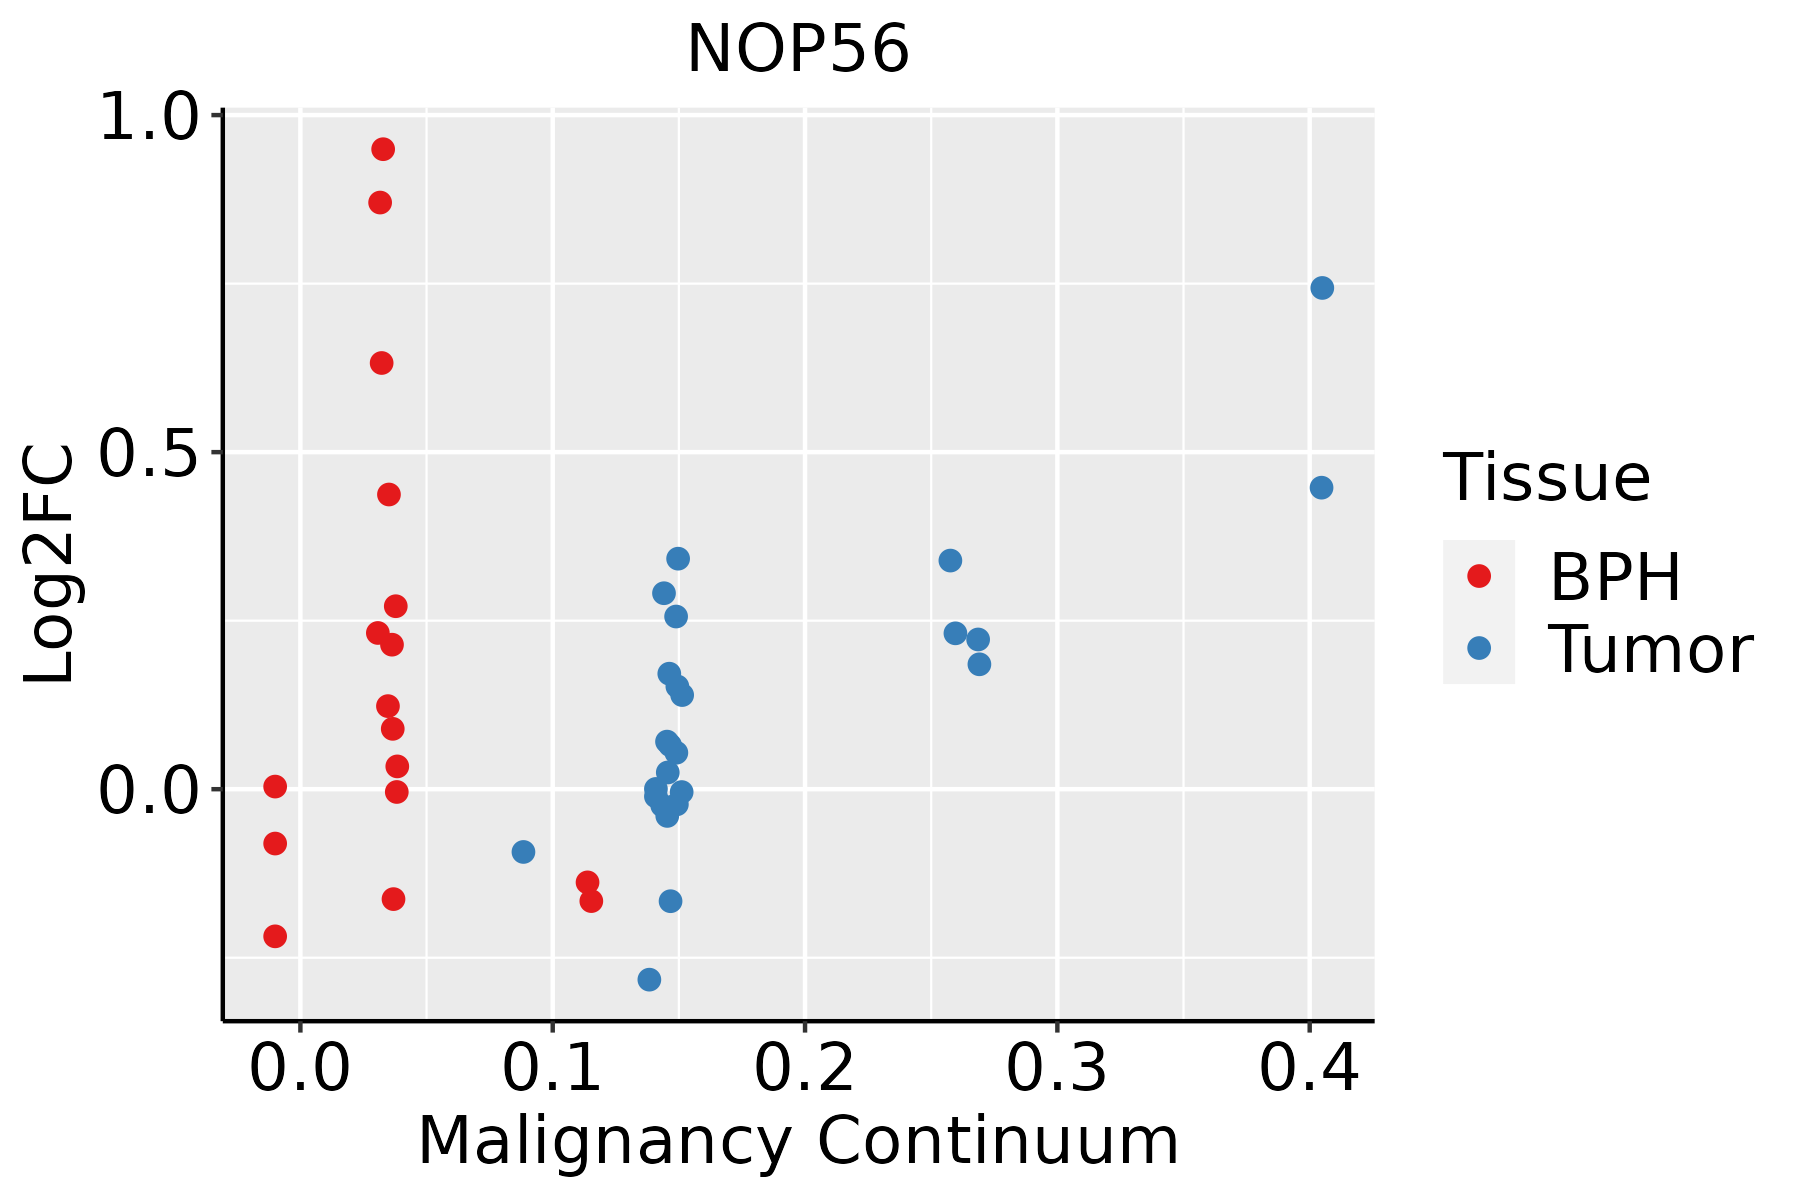 | BPH: Benign Prostatic Hyperplasia |
| Skin | 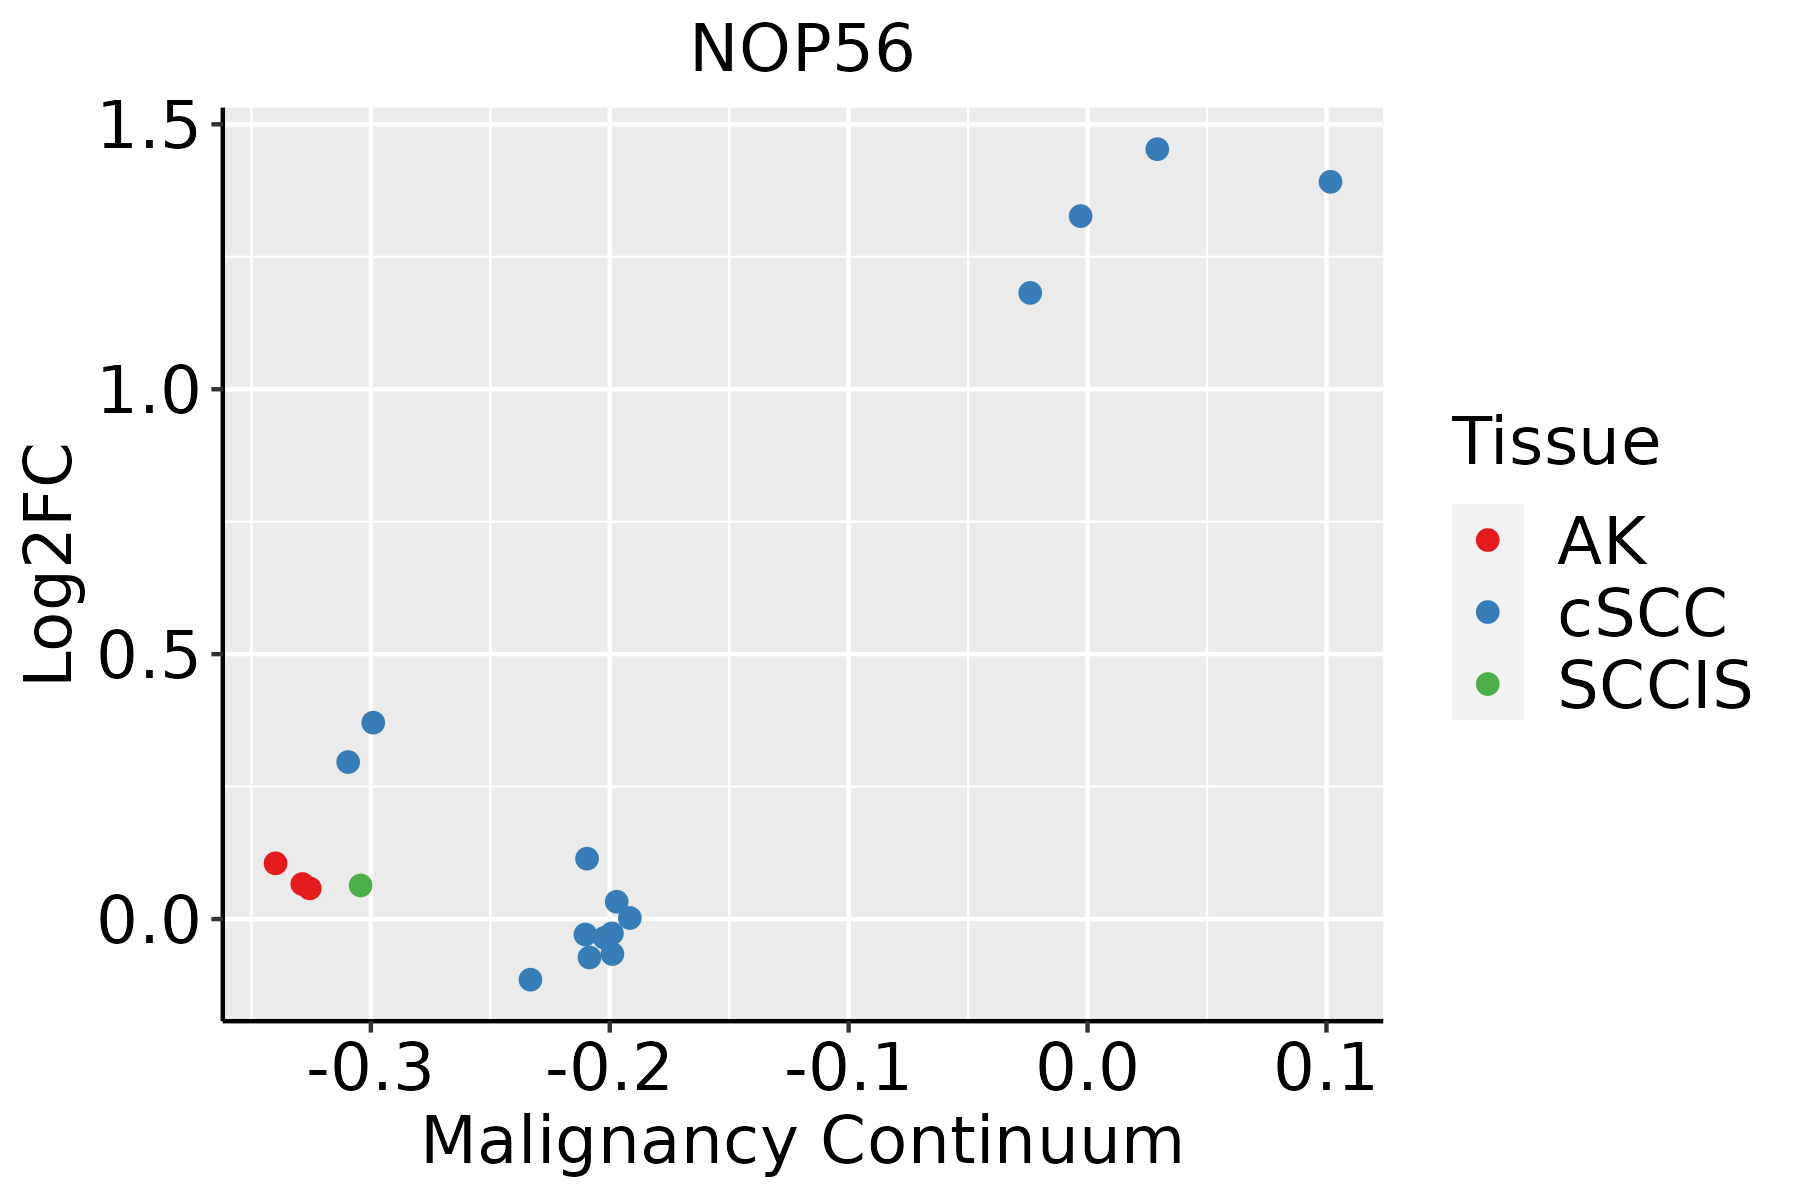 | AK: Actinic keratosis |
| cSCC: Cutaneous squamous cell carcinoma | ||
| SCCIS:squamous cell carcinoma in situ | ||
| Thyroid | 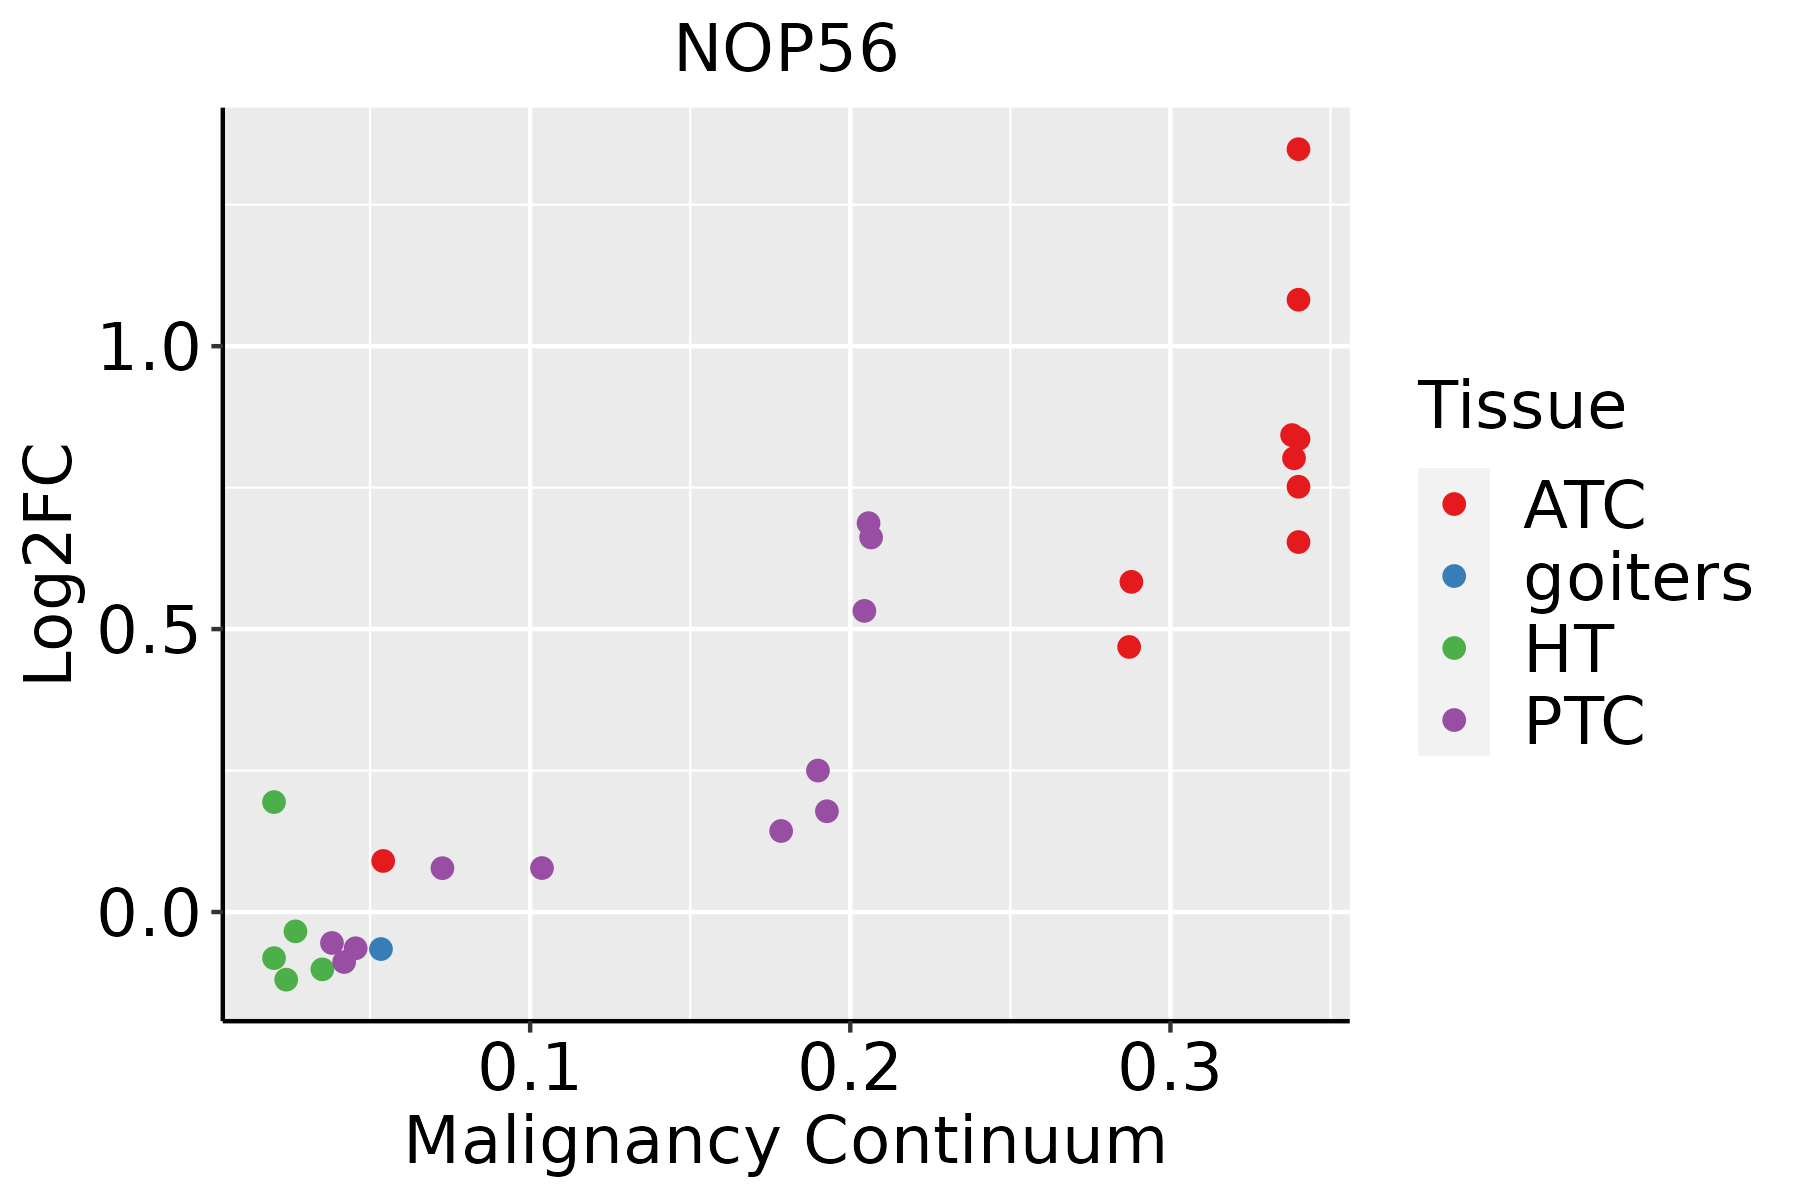 | ATC: Anaplastic thyroid cancer |
| HT: Hashimoto's thyroiditis | ||
| PTC: Papillary thyroid cancer |
| ∗log2FC in expression of this searched gene in stem-like cells from each diseased tissue sample relative to stem-like cells in normal samples in each tissue plotted against the malignancy continuum. Samples are colored based on if they are from different disease stage. |
Top |
Malignant transformation related pathway analysis |
| Find out the enriched GO biological processes and KEGG pathways involved in transition from healthy to precancer to cancer |
| Tissue | Disease Stage | Enriched GO biological Processes |
| Colorectum | AD |  |
| Colorectum | SER |  |
| Colorectum | MSS |  |
| Colorectum | MSI-H |  |
| Colorectum | FAP |  |
| ∗Top 15 enriched GO BP terms are showed in the bar plot of each disease state in each tissue. Each row represents a significant GO biological process which is colored according to the -log10(p.adjust). |
| Page: 1 2 3 4 5 6 7 8 9 |
| GO ID | Tissue | Disease Stage | Description | Gene Ratio | Bg Ratio | pvalue | p.adjust | Count |
| GO:0022613 | Colorectum | AD | ribonucleoprotein complex biogenesis | 151/3918 | 463/18723 | 1.96e-09 | 1.39e-07 | 151 |
| GO:0042254 | Colorectum | AD | ribosome biogenesis | 84/3918 | 299/18723 | 1.82e-03 | 1.50e-02 | 84 |
| GO:00226132 | Colorectum | MSS | ribonucleoprotein complex biogenesis | 144/3467 | 463/18723 | 2.76e-11 | 3.67e-09 | 144 |
| GO:00422542 | Colorectum | MSS | ribosome biogenesis | 79/3467 | 299/18723 | 4.32e-04 | 5.23e-03 | 79 |
| GO:0006364 | Colorectum | MSS | rRNA processing | 58/3467 | 225/18723 | 4.17e-03 | 3.03e-02 | 58 |
| GO:0016072 | Colorectum | MSS | rRNA metabolic process | 60/3467 | 236/18723 | 5.01e-03 | 3.46e-02 | 60 |
| GO:00226133 | Colorectum | MSI-H | ribonucleoprotein complex biogenesis | 95/1319 | 463/18723 | 1.04e-21 | 8.32e-19 | 95 |
| GO:00422543 | Colorectum | MSI-H | ribosome biogenesis | 54/1319 | 299/18723 | 1.27e-10 | 2.07e-08 | 54 |
| GO:00063641 | Colorectum | MSI-H | rRNA processing | 39/1319 | 225/18723 | 1.45e-07 | 1.32e-05 | 39 |
| GO:00160721 | Colorectum | MSI-H | rRNA metabolic process | 39/1319 | 236/18723 | 5.20e-07 | 3.91e-05 | 39 |
| GO:0034470 | Colorectum | MSI-H | ncRNA processing | 48/1319 | 395/18723 | 1.54e-04 | 4.47e-03 | 48 |
| GO:0034660 | Colorectum | MSI-H | ncRNA metabolic process | 53/1319 | 485/18723 | 9.66e-04 | 1.68e-02 | 53 |
| GO:00226134 | Colorectum | FAP | ribonucleoprotein complex biogenesis | 91/2622 | 463/18723 | 4.28e-04 | 5.12e-03 | 91 |
| GO:0022613111 | Esophagus | ESCC | ribonucleoprotein complex biogenesis | 365/8552 | 463/18723 | 1.74e-49 | 1.11e-45 | 365 |
| GO:0042254111 | Esophagus | ESCC | ribosome biogenesis | 252/8552 | 299/18723 | 3.27e-44 | 1.04e-40 | 252 |
| GO:003447015 | Esophagus | ESCC | ncRNA processing | 300/8552 | 395/18723 | 3.09e-35 | 3.26e-32 | 300 |
| GO:0016072110 | Esophagus | ESCC | rRNA metabolic process | 197/8552 | 236/18723 | 1.31e-33 | 1.18e-30 | 197 |
| GO:0006364110 | Esophagus | ESCC | rRNA processing | 189/8552 | 225/18723 | 4.88e-33 | 3.87e-30 | 189 |
| GO:003466012 | Esophagus | ESCC | ncRNA metabolic process | 346/8552 | 485/18723 | 4.35e-31 | 2.51e-28 | 346 |
| GO:002261312 | Liver | Cirrhotic | ribonucleoprotein complex biogenesis | 231/4634 | 463/18723 | 3.28e-32 | 6.86e-29 | 231 |
| Page: 1 2 3 4 |
| Pathway ID | Tissue | Disease Stage | Description | Gene Ratio | Bg Ratio | pvalue | p.adjust | qvalue | Count |
| hsa05017 | Colorectum | AD | Spinocerebellar ataxia | 60/2092 | 143/8465 | 3.78e-06 | 4.35e-05 | 2.78e-05 | 60 |
| hsa050171 | Colorectum | AD | Spinocerebellar ataxia | 60/2092 | 143/8465 | 3.78e-06 | 4.35e-05 | 2.78e-05 | 60 |
| hsa050174 | Colorectum | MSS | Spinocerebellar ataxia | 60/1875 | 143/8465 | 7.14e-08 | 1.26e-06 | 7.71e-07 | 60 |
| hsa050175 | Colorectum | MSS | Spinocerebellar ataxia | 60/1875 | 143/8465 | 7.14e-08 | 1.26e-06 | 7.71e-07 | 60 |
| hsa050176 | Colorectum | MSI-H | Spinocerebellar ataxia | 33/797 | 143/8465 | 8.28e-07 | 1.49e-05 | 1.25e-05 | 33 |
| hsa050177 | Colorectum | MSI-H | Spinocerebellar ataxia | 33/797 | 143/8465 | 8.28e-07 | 1.49e-05 | 1.25e-05 | 33 |
| hsa050178 | Colorectum | FAP | Spinocerebellar ataxia | 37/1404 | 143/8465 | 2.94e-03 | 1.29e-02 | 7.86e-03 | 37 |
| hsa050179 | Colorectum | FAP | Spinocerebellar ataxia | 37/1404 | 143/8465 | 2.94e-03 | 1.29e-02 | 7.86e-03 | 37 |
| hsa0501728 | Esophagus | ESCC | Spinocerebellar ataxia | 94/4205 | 143/8465 | 6.77e-05 | 2.90e-04 | 1.48e-04 | 94 |
| hsa0501736 | Esophagus | ESCC | Spinocerebellar ataxia | 94/4205 | 143/8465 | 6.77e-05 | 2.90e-04 | 1.48e-04 | 94 |
| hsa0501710 | Liver | Cirrhotic | Spinocerebellar ataxia | 66/2530 | 143/8465 | 2.58e-05 | 2.15e-04 | 1.32e-04 | 66 |
| hsa0501711 | Liver | Cirrhotic | Spinocerebellar ataxia | 66/2530 | 143/8465 | 2.58e-05 | 2.15e-04 | 1.32e-04 | 66 |
| hsa0501721 | Liver | HCC | Spinocerebellar ataxia | 92/4020 | 143/8465 | 3.20e-05 | 1.88e-04 | 1.04e-04 | 92 |
| hsa0501731 | Liver | HCC | Spinocerebellar ataxia | 92/4020 | 143/8465 | 3.20e-05 | 1.88e-04 | 1.04e-04 | 92 |
| hsa0501725 | Oral cavity | OSCC | Spinocerebellar ataxia | 86/3704 | 143/8465 | 5.21e-05 | 2.08e-04 | 1.06e-04 | 86 |
| hsa05017111 | Oral cavity | OSCC | Spinocerebellar ataxia | 86/3704 | 143/8465 | 5.21e-05 | 2.08e-04 | 1.06e-04 | 86 |
| hsa0501726 | Oral cavity | LP | Spinocerebellar ataxia | 59/2418 | 143/8465 | 6.97e-04 | 3.46e-03 | 2.23e-03 | 59 |
| hsa0501735 | Oral cavity | LP | Spinocerebellar ataxia | 59/2418 | 143/8465 | 6.97e-04 | 3.46e-03 | 2.23e-03 | 59 |
| hsa0501720 | Prostate | BPH | Spinocerebellar ataxia | 55/1718 | 143/8465 | 3.63e-07 | 3.74e-06 | 2.32e-06 | 55 |
| hsa05017110 | Prostate | BPH | Spinocerebellar ataxia | 55/1718 | 143/8465 | 3.63e-07 | 3.74e-06 | 2.32e-06 | 55 |
| Page: 1 2 |
Top |
Cell-cell communication analysis |
| Identification of potential cell-cell interactions between two cell types and their ligand-receptor pairs for different disease states |
| Ligand | Receptor | LRpair | Pathway | Tissue | Disease Stage |
| Page: 1 |
Top |
Single-cell gene regulatory network inference analysis |
| Find out the significant the regulons (TFs) and the target genes of each regulon across cell types for different disease states |
| TF | Cell Type | Tissue | Disease Stage | Target Gene | RSS | Regulon Activity |
| ∗The dot plots of a searched regulon are shown for all cell subpopulations in each disease state of each tissue based on the regulon specific score inferred using pySCENIC and by calculating the average expression. |
| Page: 1 |
Top |
Somatic mutation of malignant transformation related genes |
| Annotation of somatic variants for genes involved in malignant transformation |
| Hugo Symbol | Variant Class | Variant Classification | dbSNP RS | HGVSc | HGVSp | HGVSp Short | SWISSPROT | BIOTYPE | SIFT | PolyPhen | Tumor Sample Barcode | Tissue | Histology | Sex | Age | Stage | Therapy Types | Drugs | Outcome |
| NOP56 | SNV | Missense_Mutation | c.1405C>G | p.Pro469Ala | p.P469A | O00567 | protein_coding | tolerated(0.52) | benign(0) | TCGA-AC-A23H-01 | Breast | breast invasive carcinoma | Female | >=65 | I/II | Unknown | Unknown | PD | |
| NOP56 | SNV | Missense_Mutation | c.673N>A | p.Glu225Lys | p.E225K | O00567 | protein_coding | deleterious(0) | benign(0.168) | TCGA-BH-A0B0-01 | Breast | breast invasive carcinoma | Female | <65 | I/II | Chemotherapy | adriamycin | CR | |
| NOP56 | insertion | Frame_Shift_Ins | novel | c.1597_1598insTTCTGTTGCGACC | p.Lys533IlefsTer17 | p.K533Ifs*17 | O00567 | protein_coding | TCGA-BH-A0HF-01 | Breast | breast invasive carcinoma | Female | >=65 | I/II | Hormone Therapy | arimidex | SD | ||
| NOP56 | SNV | Missense_Mutation | c.501G>A | p.Met167Ile | p.M167I | O00567 | protein_coding | deleterious(0.01) | possibly_damaging(0.759) | TCGA-JX-A3PZ-01 | Cervix | cervical & endocervical cancer | Female | <65 | I/II | Unknown | Unknown | PD | |
| NOP56 | SNV | Missense_Mutation | c.1418N>G | p.Glu473Gly | p.E473G | O00567 | protein_coding | deleterious(0.01) | benign(0.003) | TCGA-A6-5665-01 | Colorectum | colon adenocarcinoma | Female | >=65 | I/II | Unknown | Unknown | PD | |
| NOP56 | SNV | Missense_Mutation | rs781343694 | c.307N>A | p.Ala103Thr | p.A103T | O00567 | protein_coding | tolerated(0.06) | benign(0.053) | TCGA-AA-3977-01 | Colorectum | colon adenocarcinoma | Male | >=65 | I/II | Unknown | Unknown | SD |
| NOP56 | SNV | Missense_Mutation | c.191N>T | p.Ala64Val | p.A64V | O00567 | protein_coding | tolerated(1) | benign(0.001) | TCGA-AD-6964-01 | Colorectum | colon adenocarcinoma | Male | <65 | III/IV | Chemotherapy | folfox | PD | |
| NOP56 | SNV | Missense_Mutation | rs541896402 | c.1425N>A | p.Met475Ile | p.M475I | O00567 | protein_coding | tolerated(0.22) | benign(0) | TCGA-AZ-4315-01 | Colorectum | colon adenocarcinoma | Male | <65 | I/II | Unknown | Unknown | SD |
| NOP56 | SNV | Missense_Mutation | rs763810400 | c.1373N>T | p.Ala458Val | p.A458V | O00567 | protein_coding | tolerated(0.15) | probably_damaging(0.978) | TCGA-AZ-6598-01 | Colorectum | colon adenocarcinoma | Female | >=65 | I/II | Unknown | Unknown | SD |
| NOP56 | SNV | Missense_Mutation | novel | c.1486N>C | p.Met496Leu | p.M496L | O00567 | protein_coding | tolerated_low_confidence(0.45) | benign(0) | TCGA-CA-6717-01 | Colorectum | colon adenocarcinoma | Male | <65 | I/II | Chemotherapy | oxaliplatin | CR |
| Page: 1 2 3 4 5 6 |
Top |
Related drugs of malignant transformation related genes |
| Identification of chemicals and drugs interact with genes involved in malignant transfromation |
| (DGIdb 4.0) |
| Entrez ID | Symbol | Category | Interaction Types | Drug Claim Name | Drug Name | PMIDs |
| Page: 1 |

Copyright 2023-Present -The University of Texas Health Science Center at Houston |