
|
|||||
|
 | |
| |
| |
| |
| |
| |
|
Gene: NOP53 |
Gene summary for NOP53 |
| Gene information | Species | Human | Gene symbol | NOP53 | Gene ID | 29997 |
| Gene name | NOP53 ribosome biogenesis factor | |
| Gene Alias | GLTSCR2 | |
| Cytomap | 19q13.33 | |
| Gene Type | protein-coding | GO ID | GO:0000027 | UniProtAcc | Q9NZM5 |
Top |
Malignant transformation analysis |
| Identification of the aberrant gene expression in precancerous and cancerous lesions by comparing the gene expression of stem-like cells in diseased tissues with normal stem cells |
| Entrez ID | Symbol | Replicates | Species | Organ | Tissue | Adj P-value | Log2FC | Malignancy |
| 29997 | NOP53 | GSM4909281 | Human | Breast | IDC | 2.59e-17 | -1.95e-01 | 0.21 |
| 29997 | NOP53 | GSM4909282 | Human | Breast | IDC | 1.33e-16 | -4.27e-01 | -0.0288 |
| 29997 | NOP53 | GSM4909285 | Human | Breast | IDC | 1.01e-26 | 9.00e-02 | 0.21 |
| 29997 | NOP53 | GSM4909286 | Human | Breast | IDC | 5.34e-29 | 6.51e-01 | 0.1081 |
| 29997 | NOP53 | GSM4909287 | Human | Breast | IDC | 4.59e-08 | -4.97e-01 | 0.2057 |
| 29997 | NOP53 | GSM4909290 | Human | Breast | IDC | 1.74e-05 | -2.74e-01 | 0.2096 |
| 29997 | NOP53 | GSM4909293 | Human | Breast | IDC | 3.04e-30 | -4.66e-01 | 0.1581 |
| 29997 | NOP53 | GSM4909294 | Human | Breast | IDC | 3.09e-19 | -6.15e-01 | 0.2022 |
| 29997 | NOP53 | GSM4909296 | Human | Breast | IDC | 3.40e-02 | -3.38e-01 | 0.1524 |
| 29997 | NOP53 | GSM4909298 | Human | Breast | IDC | 2.52e-21 | 1.92e-01 | 0.1551 |
| 29997 | NOP53 | GSM4909299 | Human | Breast | IDC | 1.92e-11 | 3.45e-01 | 0.035 |
| 29997 | NOP53 | GSM4909300 | Human | Breast | IDC | 1.58e-03 | 3.79e-01 | 0.0334 |
| 29997 | NOP53 | GSM4909301 | Human | Breast | IDC | 8.87e-12 | -4.52e-01 | 0.1577 |
| 29997 | NOP53 | GSM4909304 | Human | Breast | IDC | 2.19e-27 | -5.62e-01 | 0.1636 |
| 29997 | NOP53 | GSM4909305 | Human | Breast | IDC | 2.57e-20 | 6.04e-01 | 0.0436 |
| 29997 | NOP53 | GSM4909306 | Human | Breast | IDC | 7.83e-08 | 1.64e-01 | 0.1564 |
| 29997 | NOP53 | GSM4909307 | Human | Breast | IDC | 1.20e-03 | -1.48e-02 | 0.1569 |
| 29997 | NOP53 | GSM4909308 | Human | Breast | IDC | 2.35e-24 | 2.05e-01 | 0.158 |
| 29997 | NOP53 | GSM4909311 | Human | Breast | IDC | 2.43e-17 | -2.17e-01 | 0.1534 |
| 29997 | NOP53 | GSM4909313 | Human | Breast | IDC | 8.45e-04 | 3.70e-01 | 0.0391 |
| Page: 1 2 3 4 5 6 7 8 9 10 11 12 |
| Tissue | Expression Dynamics | Abbreviation |
| Breast | 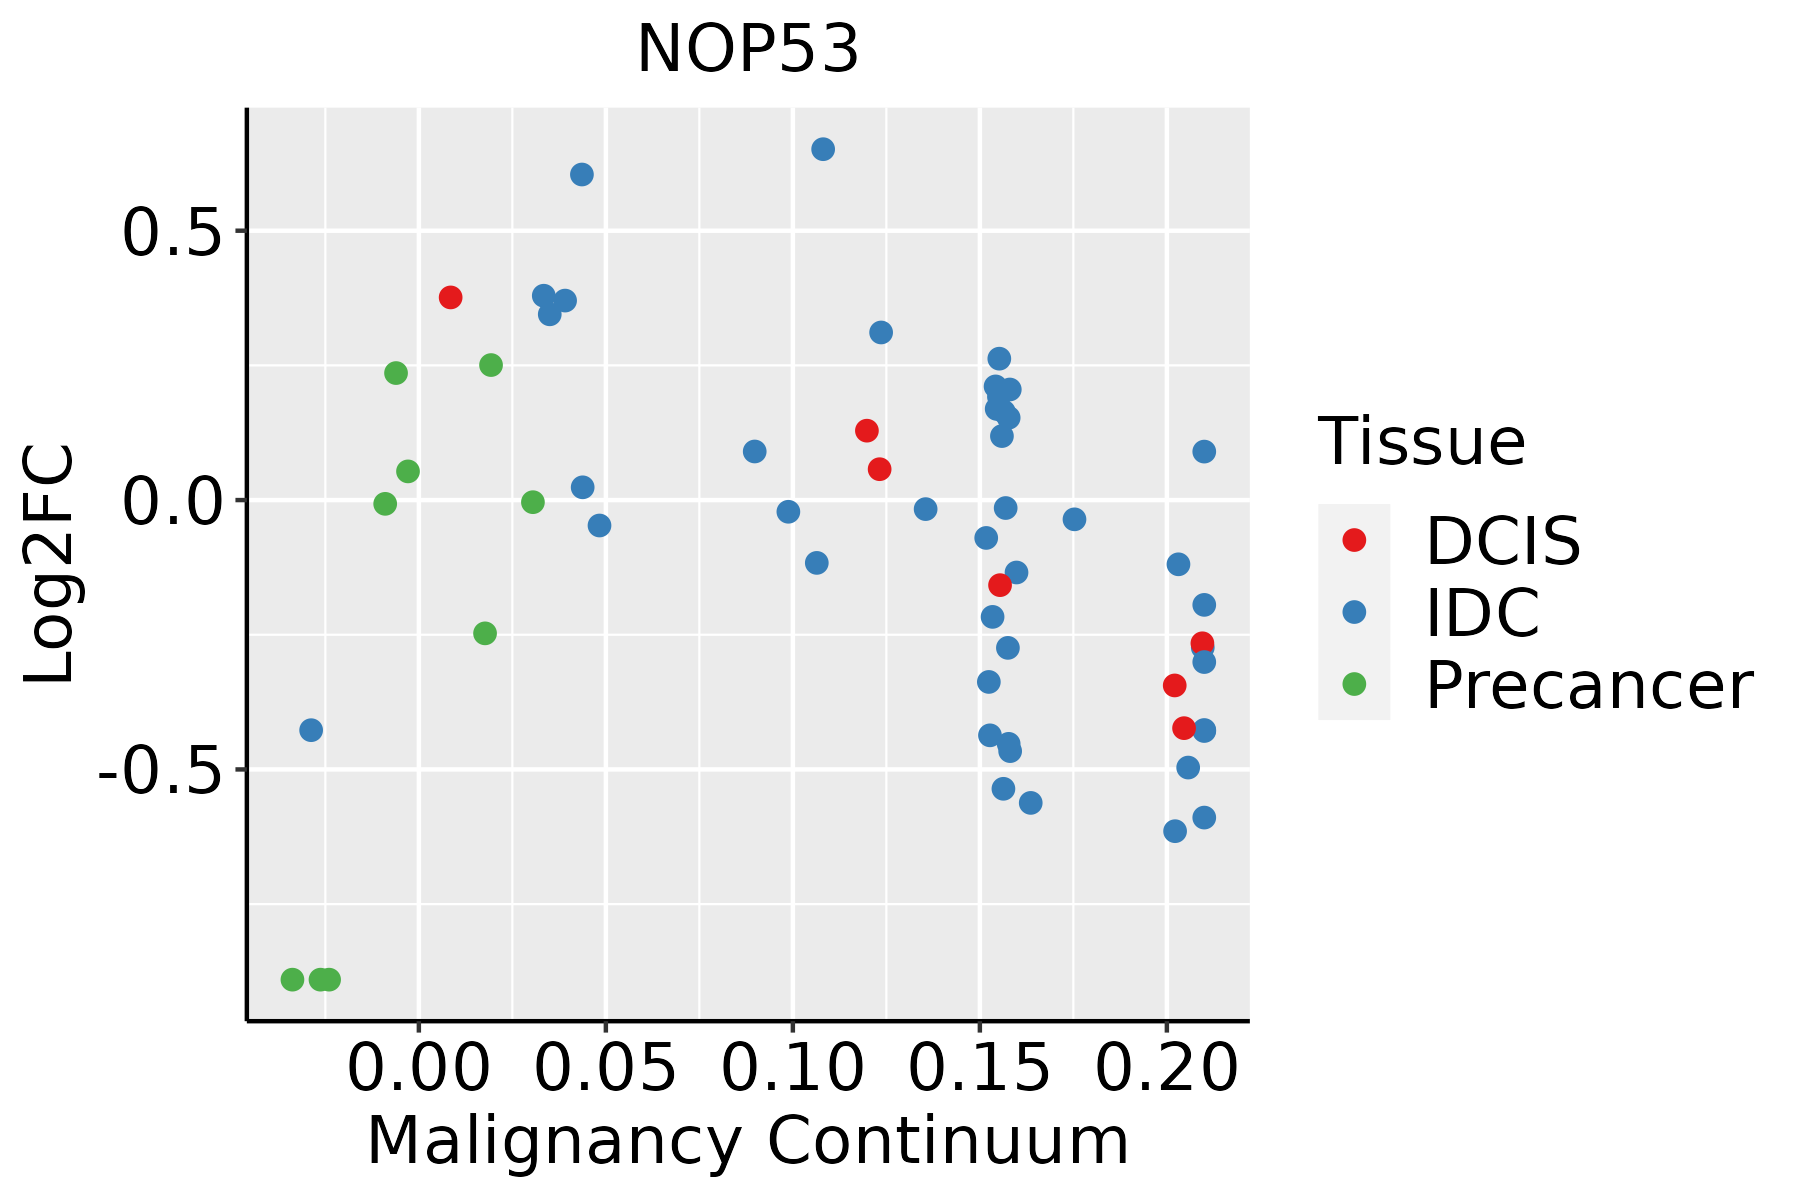 | IDC: Invasive ductal carcinoma |
| DCIS: Ductal carcinoma in situ | ||
| Precancer(BRCA1-mut): Precancerous lesion from BRCA1 mutation carriers | ||
| Cervix |  | CC: Cervix cancer |
| HSIL_HPV: HPV-infected high-grade squamous intraepithelial lesions | ||
| N_HPV: HPV-infected normal cervix | ||
| Colorectum (GSE201348) |  | FAP: Familial adenomatous polyposis |
| CRC: Colorectal cancer | ||
| Colorectum (HTA11) |  | AD: Adenomas |
| SER: Sessile serrated lesions | ||
| MSI-H: Microsatellite-high colorectal cancer | ||
| MSS: Microsatellite stable colorectal cancer | ||
| Endometrium |  | AEH: Atypical endometrial hyperplasia |
| EEC: Endometrioid Cancer | ||
| Esophagus | 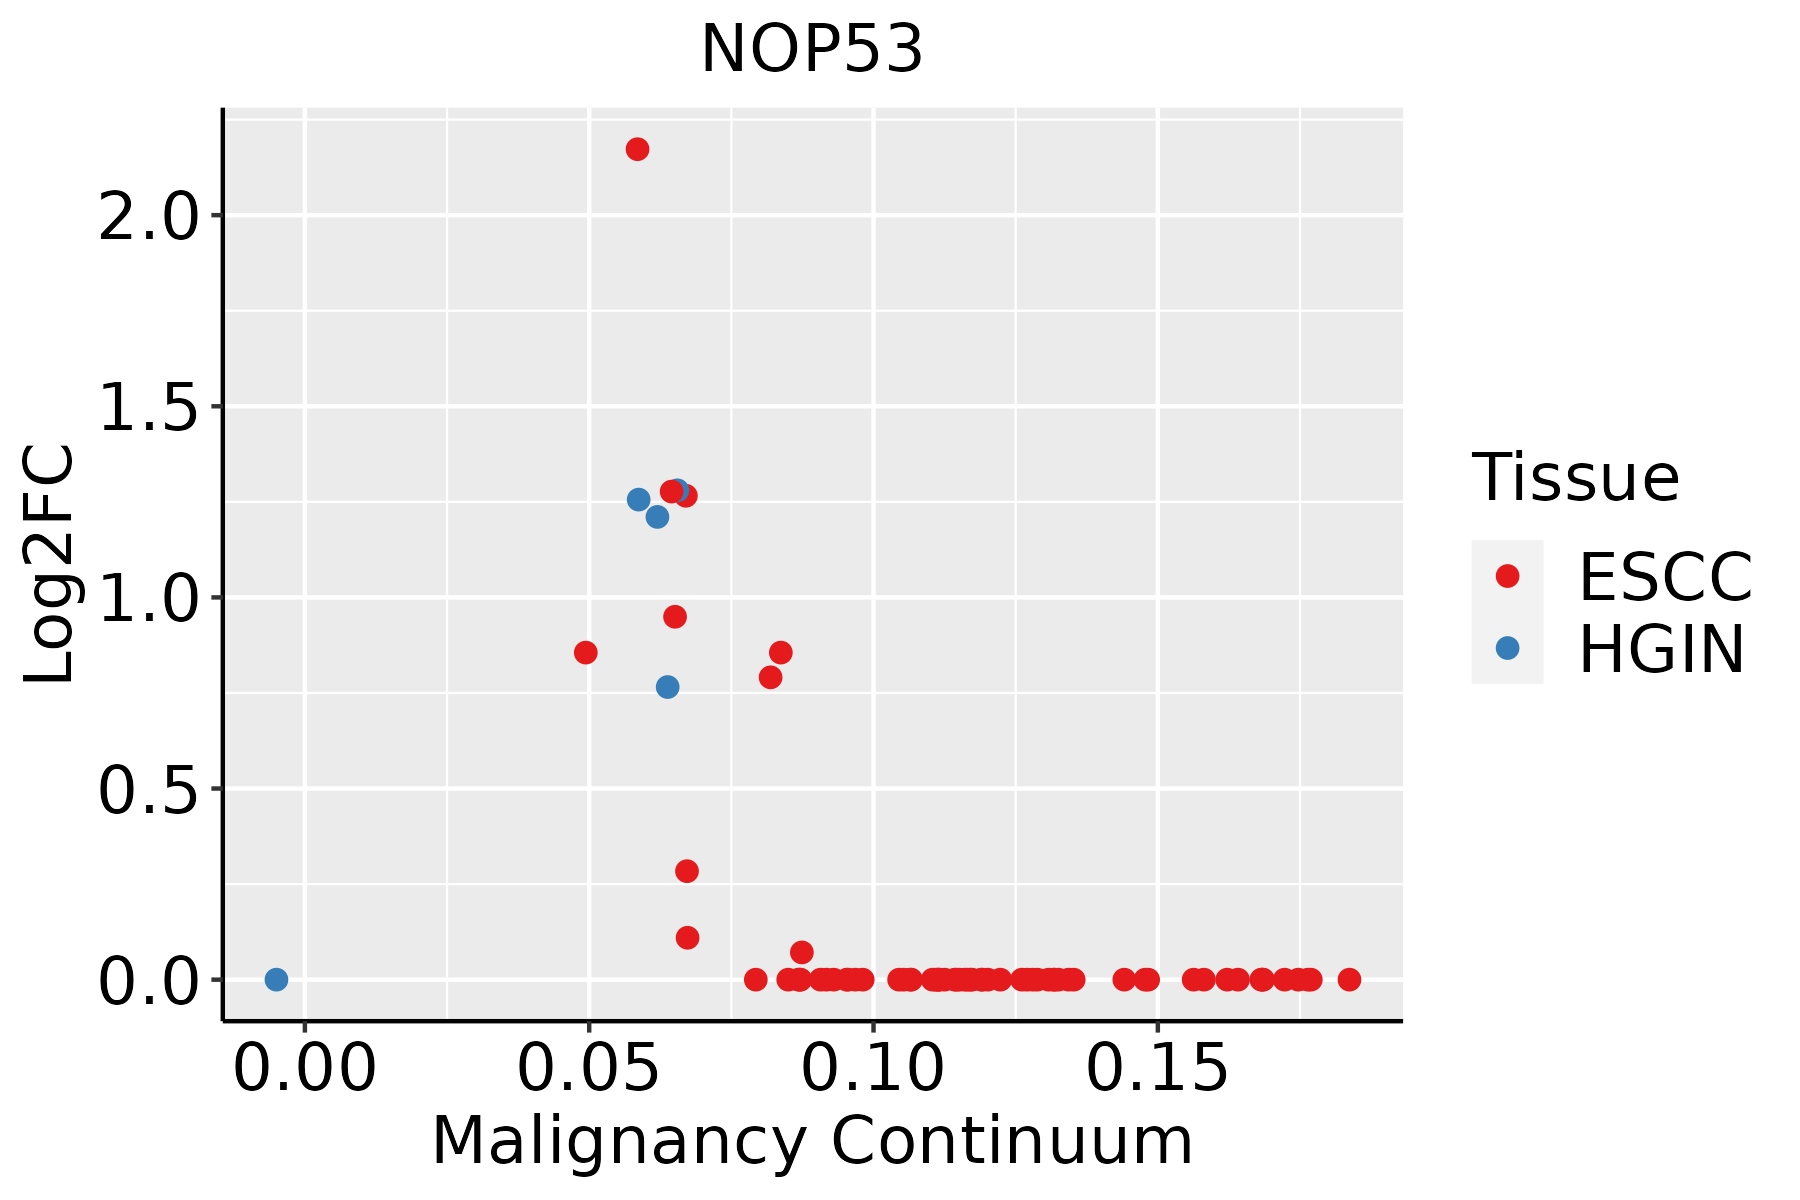 | ESCC: Esophageal squamous cell carcinoma |
| HGIN: High-grade intraepithelial neoplasias | ||
| LGIN: Low-grade intraepithelial neoplasias | ||
| GC |  | CAG: Chronic atrophic gastritis |
| CAG with IM: Chronic atrophic gastritis with intestinal metaplasia | ||
| CSG: Chronic superficial gastritis | ||
| GC: Gastric cancer | ||
| SIM: Severe intestinal metaplasia | ||
| WIM: Wild intestinal metaplasia | ||
| Liver |  | HCC: Hepatocellular carcinoma |
| NAFLD: Non-alcoholic fatty liver disease | ||
| Lung | 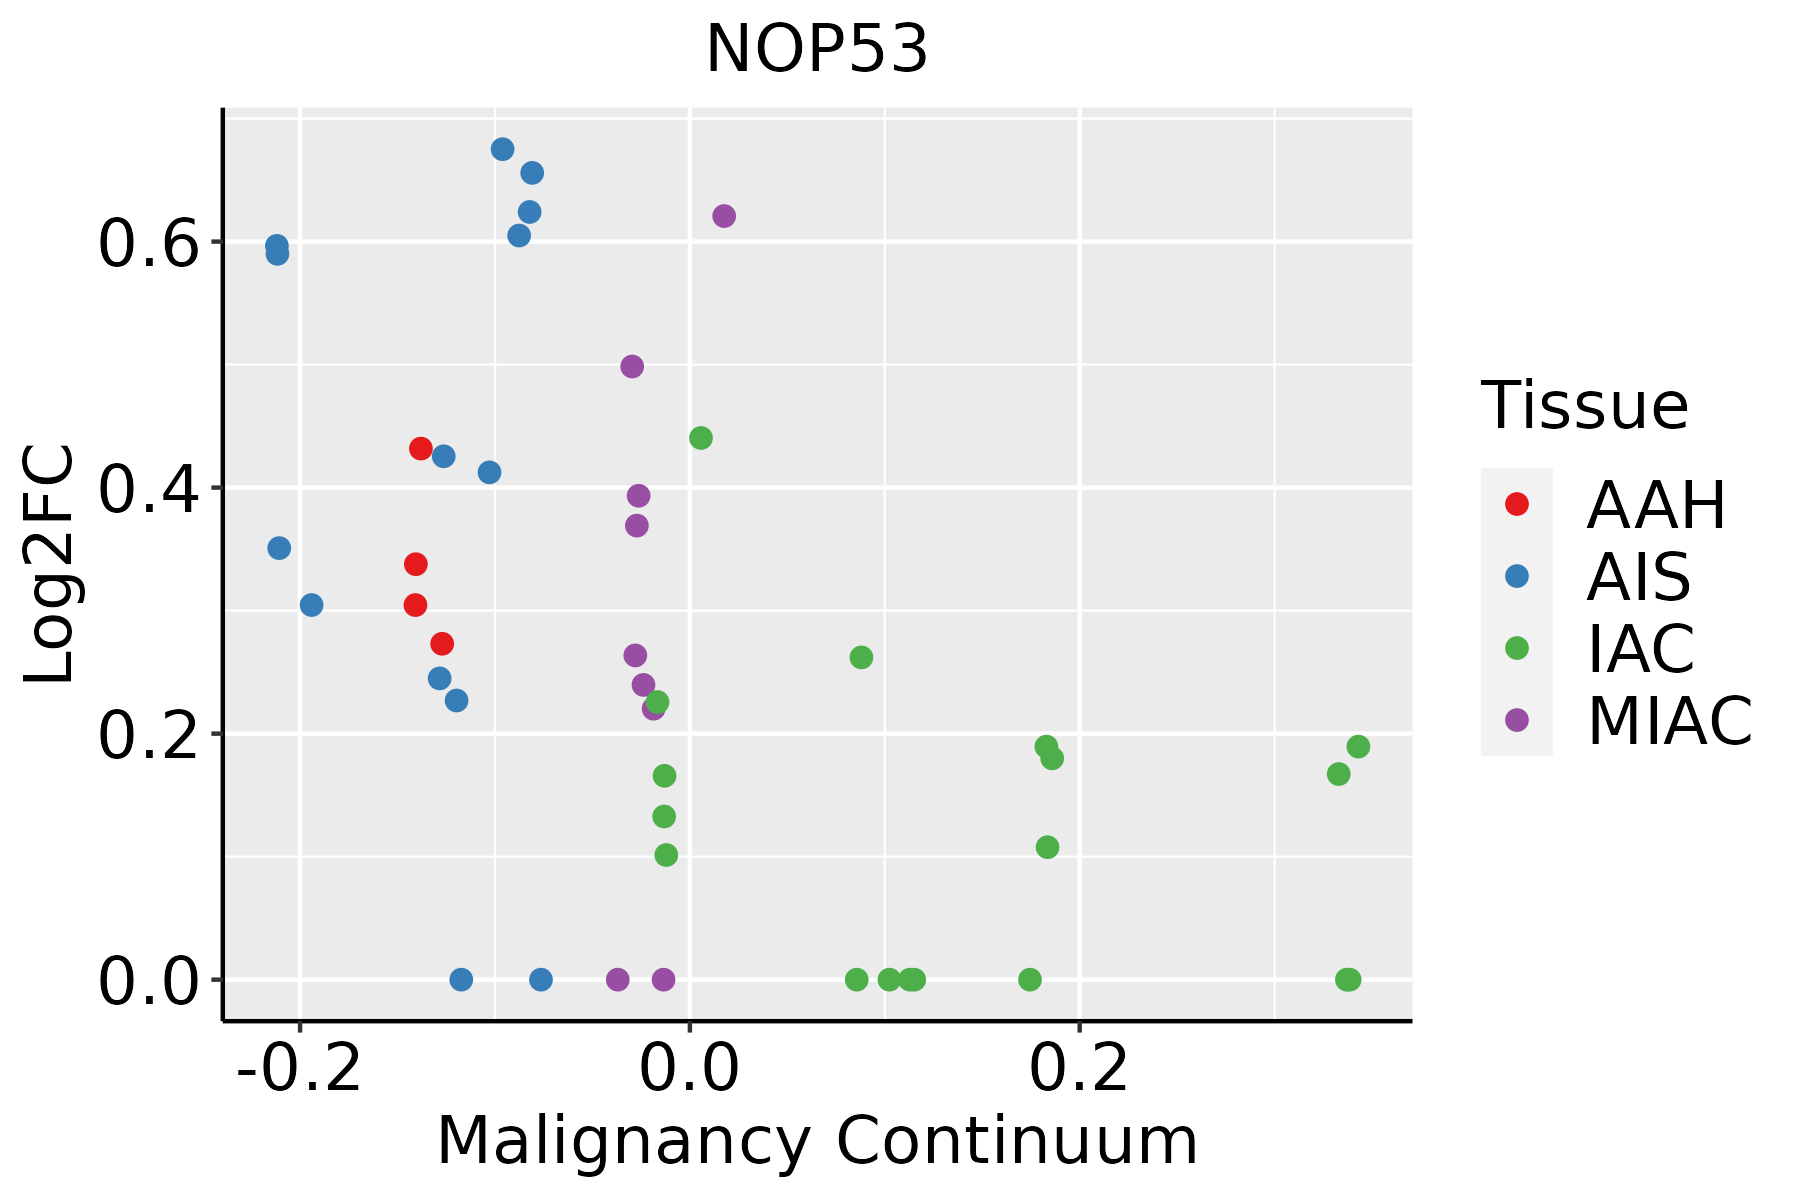 | AAH: Atypical adenomatous hyperplasia |
| AIS: Adenocarcinoma in situ | ||
| IAC: Invasive lung adenocarcinoma | ||
| MIA: Minimally invasive adenocarcinoma | ||
| Prostate |  | BPH: Benign Prostatic Hyperplasia |
| Skin | 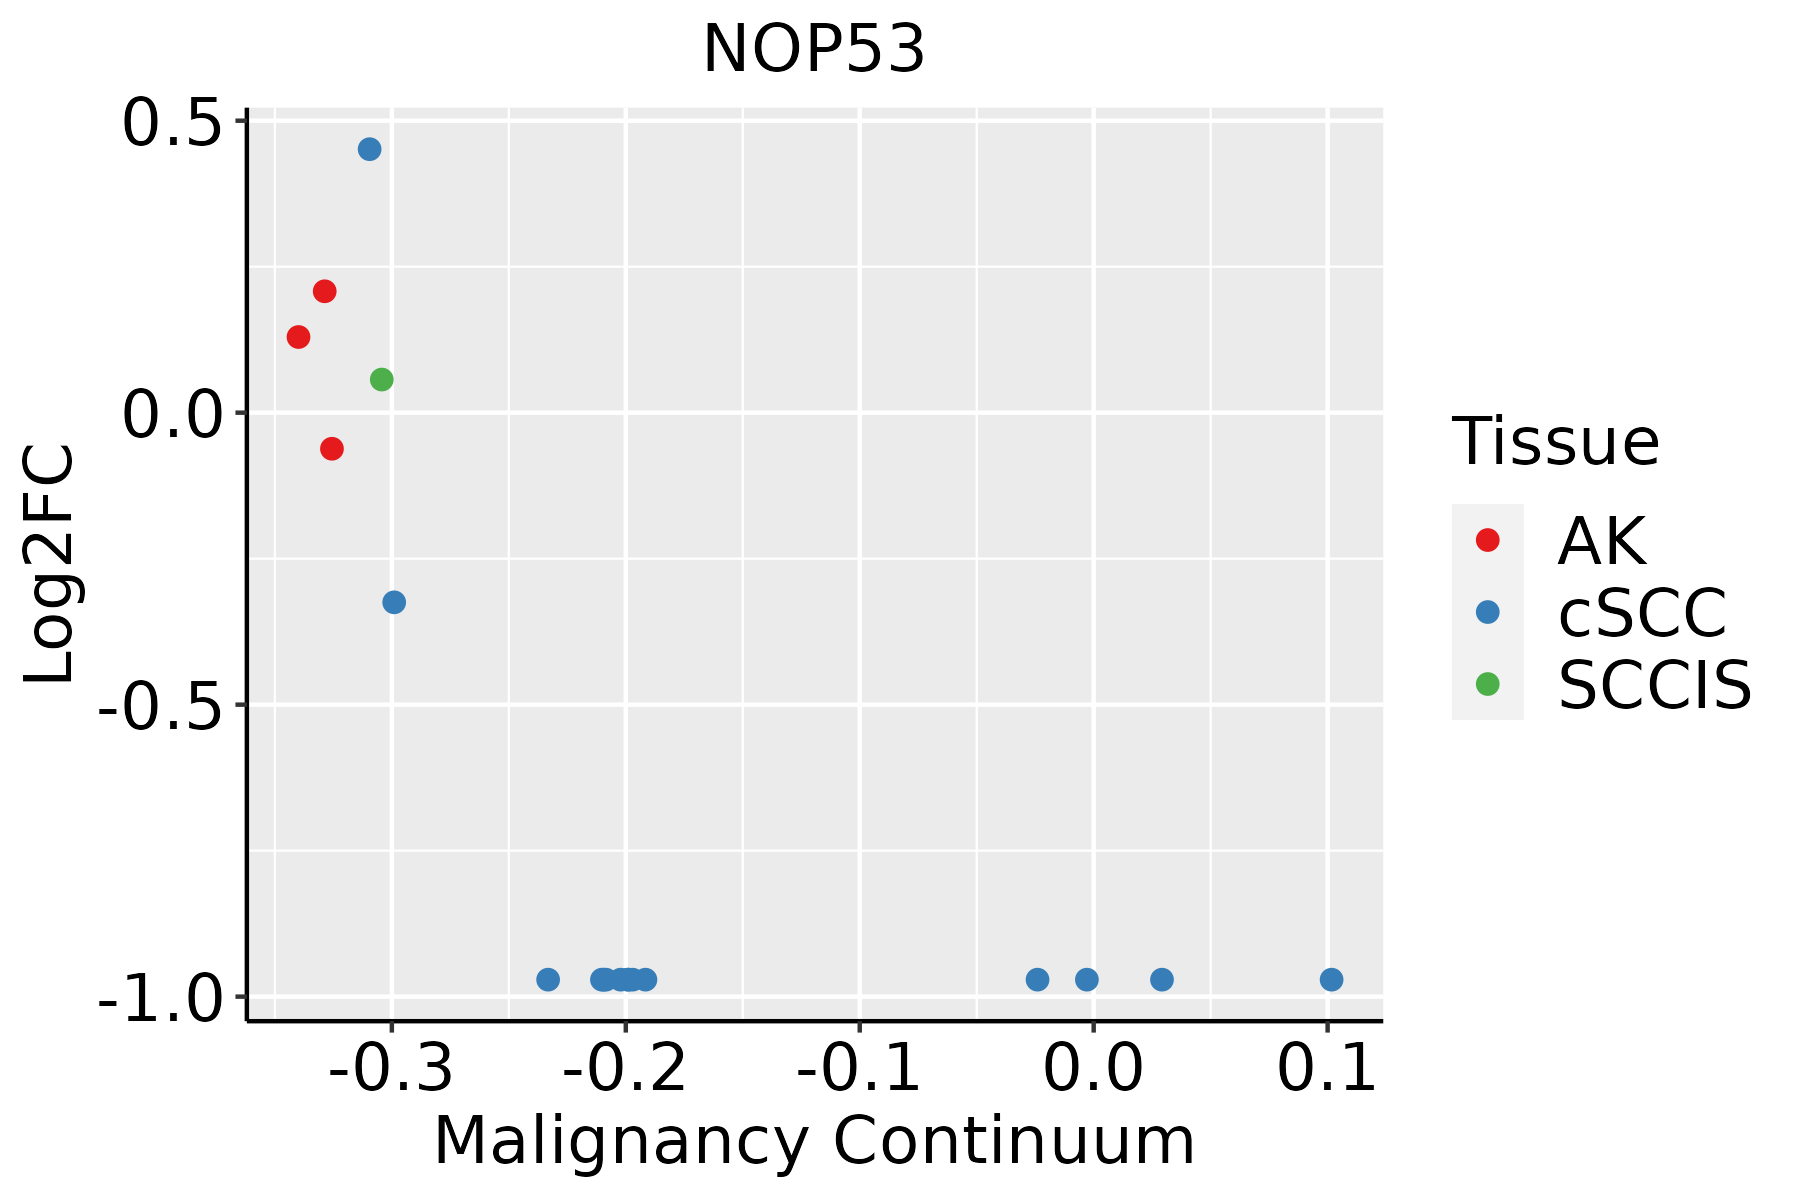 | AK: Actinic keratosis |
| cSCC: Cutaneous squamous cell carcinoma | ||
| SCCIS:squamous cell carcinoma in situ | ||
| Thyroid |  | ATC: Anaplastic thyroid cancer |
| HT: Hashimoto's thyroiditis | ||
| PTC: Papillary thyroid cancer |
| ∗log2FC in expression of this searched gene in stem-like cells from each diseased tissue sample relative to stem-like cells in normal samples in each tissue plotted against the malignancy continuum. Samples are colored based on if they are from different disease stage. |
Top |
Malignant transformation related pathway analysis |
| Find out the enriched GO biological processes and KEGG pathways involved in transition from healthy to precancer to cancer |
| Tissue | Disease Stage | Enriched GO biological Processes |
| Colorectum | AD |  |
| Colorectum | SER |  |
| Colorectum | MSS |  |
| Colorectum | MSI-H |  |
| Colorectum | FAP |  |
| ∗Top 15 enriched GO BP terms are showed in the bar plot of each disease state in each tissue. Each row represents a significant GO biological process which is colored according to the -log10(p.adjust). |
| Page: 1 2 3 4 5 6 7 8 9 |
| GO ID | Tissue | Disease Stage | Description | Gene Ratio | Bg Ratio | pvalue | p.adjust | Count |
| GO:00090608 | Breast | Precancer | aerobic respiration | 58/1080 | 189/18723 | 5.69e-27 | 7.62e-24 | 58 |
| GO:00060918 | Breast | Precancer | generation of precursor metabolites and energy | 94/1080 | 490/18723 | 1.54e-25 | 1.64e-22 | 94 |
| GO:00453338 | Breast | Precancer | cellular respiration | 59/1080 | 230/18723 | 5.97e-23 | 5.32e-20 | 59 |
| GO:00159808 | Breast | Precancer | energy derivation by oxidation of organic compounds | 70/1080 | 318/18723 | 8.33e-23 | 6.37e-20 | 70 |
| GO:00226139 | Breast | Precancer | ribonucleoprotein complex biogenesis | 79/1080 | 463/18723 | 2.11e-18 | 1.03e-15 | 79 |
| GO:00718269 | Breast | Precancer | ribonucleoprotein complex subunit organization | 48/1080 | 227/18723 | 2.68e-15 | 8.45e-13 | 48 |
| GO:00226189 | Breast | Precancer | ribonucleoprotein complex assembly | 47/1080 | 220/18723 | 3.47e-15 | 1.03e-12 | 47 |
| GO:00422549 | Breast | Precancer | ribosome biogenesis | 52/1080 | 299/18723 | 7.35e-13 | 1.51e-10 | 52 |
| GO:00362939 | Breast | Precancer | response to decreased oxygen levels | 53/1080 | 322/18723 | 4.09e-12 | 6.84e-10 | 53 |
| GO:00016669 | Breast | Precancer | response to hypoxia | 51/1080 | 307/18723 | 7.33e-12 | 1.11e-09 | 51 |
| GO:00704829 | Breast | Precancer | response to oxygen levels | 55/1080 | 347/18723 | 7.47e-12 | 1.11e-09 | 55 |
| GO:00422559 | Breast | Precancer | ribosome assembly | 21/1080 | 61/18723 | 1.06e-11 | 1.53e-09 | 21 |
| GO:00422739 | Breast | Precancer | ribosomal large subunit biogenesis | 22/1080 | 72/18723 | 5.03e-11 | 5.61e-09 | 22 |
| GO:00362948 | Breast | Precancer | cellular response to decreased oxygen levels | 31/1080 | 161/18723 | 2.61e-09 | 2.11e-07 | 31 |
| GO:00458619 | Breast | Precancer | negative regulation of proteolysis | 50/1080 | 351/18723 | 2.99e-09 | 2.39e-07 | 50 |
| GO:00714538 | Breast | Precancer | cellular response to oxygen levels | 32/1080 | 177/18723 | 7.32e-09 | 5.52e-07 | 32 |
| GO:00458629 | Breast | Precancer | positive regulation of proteolysis | 51/1080 | 372/18723 | 7.77e-09 | 5.70e-07 | 51 |
| GO:00714565 | Breast | Precancer | cellular response to hypoxia | 29/1080 | 151/18723 | 8.98e-09 | 6.50e-07 | 29 |
| GO:19033209 | Breast | Precancer | regulation of protein modification by small protein conjugation or removal | 38/1080 | 242/18723 | 1.71e-08 | 1.17e-06 | 38 |
| GO:00063646 | Breast | Precancer | rRNA processing | 35/1080 | 225/18723 | 7.90e-08 | 4.60e-06 | 35 |
| Page: 1 2 3 4 5 6 7 8 9 10 11 12 13 14 15 16 17 18 19 20 21 22 23 24 25 26 27 28 29 30 31 32 33 34 35 36 37 38 39 40 41 42 43 44 45 46 47 48 49 50 51 52 53 54 55 56 57 58 59 60 61 62 63 64 65 66 67 68 69 70 71 72 73 74 75 76 77 78 79 80 81 82 83 84 85 86 87 88 89 |
| Pathway ID | Tissue | Disease Stage | Description | Gene Ratio | Bg Ratio | pvalue | p.adjust | qvalue | Count |
| Page: 1 |
Top |
Cell-cell communication analysis |
| Identification of potential cell-cell interactions between two cell types and their ligand-receptor pairs for different disease states |
| Ligand | Receptor | LRpair | Pathway | Tissue | Disease Stage |
| Page: 1 |
Top |
Single-cell gene regulatory network inference analysis |
| Find out the significant the regulons (TFs) and the target genes of each regulon across cell types for different disease states |
| TF | Cell Type | Tissue | Disease Stage | Target Gene | RSS | Regulon Activity |
| ∗The dot plots of a searched regulon are shown for all cell subpopulations in each disease state of each tissue based on the regulon specific score inferred using pySCENIC and by calculating the average expression. |
| Page: 1 |
Top |
Somatic mutation of malignant transformation related genes |
| Annotation of somatic variants for genes involved in malignant transformation |
| Hugo Symbol | Variant Class | Variant Classification | dbSNP RS | HGVSc | HGVSp | HGVSp Short | SWISSPROT | BIOTYPE | SIFT | PolyPhen | Tumor Sample Barcode | Tissue | Histology | Sex | Age | Stage | Therapy Types | Drugs | Outcome |
| Page: 1 |
Top |
Related drugs of malignant transformation related genes |
| Identification of chemicals and drugs interact with genes involved in malignant transfromation |
| (DGIdb 4.0) |
| Entrez ID | Symbol | Category | Interaction Types | Drug Claim Name | Drug Name | PMIDs |
| Page: 1 |

Copyright 2023-Present -The University of Texas Health Science Center at Houston |