
|
|||||
|
 | |
| |
| |
| |
| |
| |
|
Gene: NOP2 |
Gene summary for NOP2 |
| Gene information | Species | Human | Gene symbol | NOP2 | Gene ID | 4839 |
| Gene name | NOP2 nucleolar protein | |
| Gene Alias | NOL1 | |
| Cytomap | 12p13.31 | |
| Gene Type | protein-coding | GO ID | GO:0000027 | UniProtAcc | P46087 |
Top |
Malignant transformation analysis |
| Identification of the aberrant gene expression in precancerous and cancerous lesions by comparing the gene expression of stem-like cells in diseased tissues with normal stem cells |
| Entrez ID | Symbol | Replicates | Species | Organ | Tissue | Adj P-value | Log2FC | Malignancy |
| 4839 | NOP2 | HTA11_3410_2000001011 | Human | Colorectum | AD | 5.90e-11 | 2.19e-01 | 0.0155 |
| 4839 | NOP2 | HTA11_2487_2000001011 | Human | Colorectum | SER | 2.89e-04 | 1.85e-01 | -0.1808 |
| 4839 | NOP2 | HTA11_1938_2000001011 | Human | Colorectum | AD | 8.04e-15 | 3.98e-01 | -0.0811 |
| 4839 | NOP2 | HTA11_78_2000001011 | Human | Colorectum | AD | 2.48e-07 | 2.09e-01 | -0.1088 |
| 4839 | NOP2 | HTA11_347_2000001011 | Human | Colorectum | AD | 1.27e-08 | 1.88e-01 | -0.1954 |
| 4839 | NOP2 | HTA11_2112_2000001011 | Human | Colorectum | SER | 1.90e-02 | 2.72e-01 | -0.2196 |
| 4839 | NOP2 | HTA11_3361_2000001011 | Human | Colorectum | AD | 7.91e-05 | 1.76e-01 | -0.1207 |
| 4839 | NOP2 | HTA11_83_2000001011 | Human | Colorectum | SER | 1.47e-06 | 2.28e-01 | -0.1526 |
| 4839 | NOP2 | HTA11_696_2000001011 | Human | Colorectum | AD | 5.76e-06 | 1.83e-01 | -0.1464 |
| 4839 | NOP2 | HTA11_866_2000001011 | Human | Colorectum | AD | 3.14e-08 | 2.33e-01 | -0.1001 |
| 4839 | NOP2 | HTA11_1391_2000001011 | Human | Colorectum | AD | 1.87e-19 | 4.49e-01 | -0.059 |
| 4839 | NOP2 | HTA11_7862_2000001011 | Human | Colorectum | AD | 3.59e-09 | 3.01e-01 | -0.0179 |
| 4839 | NOP2 | HTA11_866_3004761011 | Human | Colorectum | AD | 5.30e-21 | 4.16e-01 | 0.096 |
| 4839 | NOP2 | HTA11_4255_2000001011 | Human | Colorectum | SER | 3.22e-05 | 3.05e-01 | 0.0446 |
| 4839 | NOP2 | HTA11_8622_2000001021 | Human | Colorectum | SER | 3.19e-02 | 1.58e-01 | 0.0528 |
| 4839 | NOP2 | HTA11_7663_2000001011 | Human | Colorectum | SER | 6.29e-03 | 2.01e-01 | 0.0131 |
| 4839 | NOP2 | HTA11_10623_2000001011 | Human | Colorectum | AD | 6.46e-07 | 3.32e-01 | -0.0177 |
| 4839 | NOP2 | HTA11_6801_2000001011 | Human | Colorectum | SER | 2.21e-02 | 2.03e-01 | 0.0171 |
| 4839 | NOP2 | HTA11_10711_2000001011 | Human | Colorectum | AD | 7.11e-07 | 1.99e-01 | 0.0338 |
| 4839 | NOP2 | HTA11_7696_3000711011 | Human | Colorectum | AD | 1.53e-11 | 3.32e-01 | 0.0674 |
| Page: 1 2 3 4 5 6 |
| Tissue | Expression Dynamics | Abbreviation |
| Colorectum (GSE201348) |  | FAP: Familial adenomatous polyposis |
| CRC: Colorectal cancer | ||
| Colorectum (HTA11) |  | AD: Adenomas |
| SER: Sessile serrated lesions | ||
| MSI-H: Microsatellite-high colorectal cancer | ||
| MSS: Microsatellite stable colorectal cancer | ||
| Esophagus | 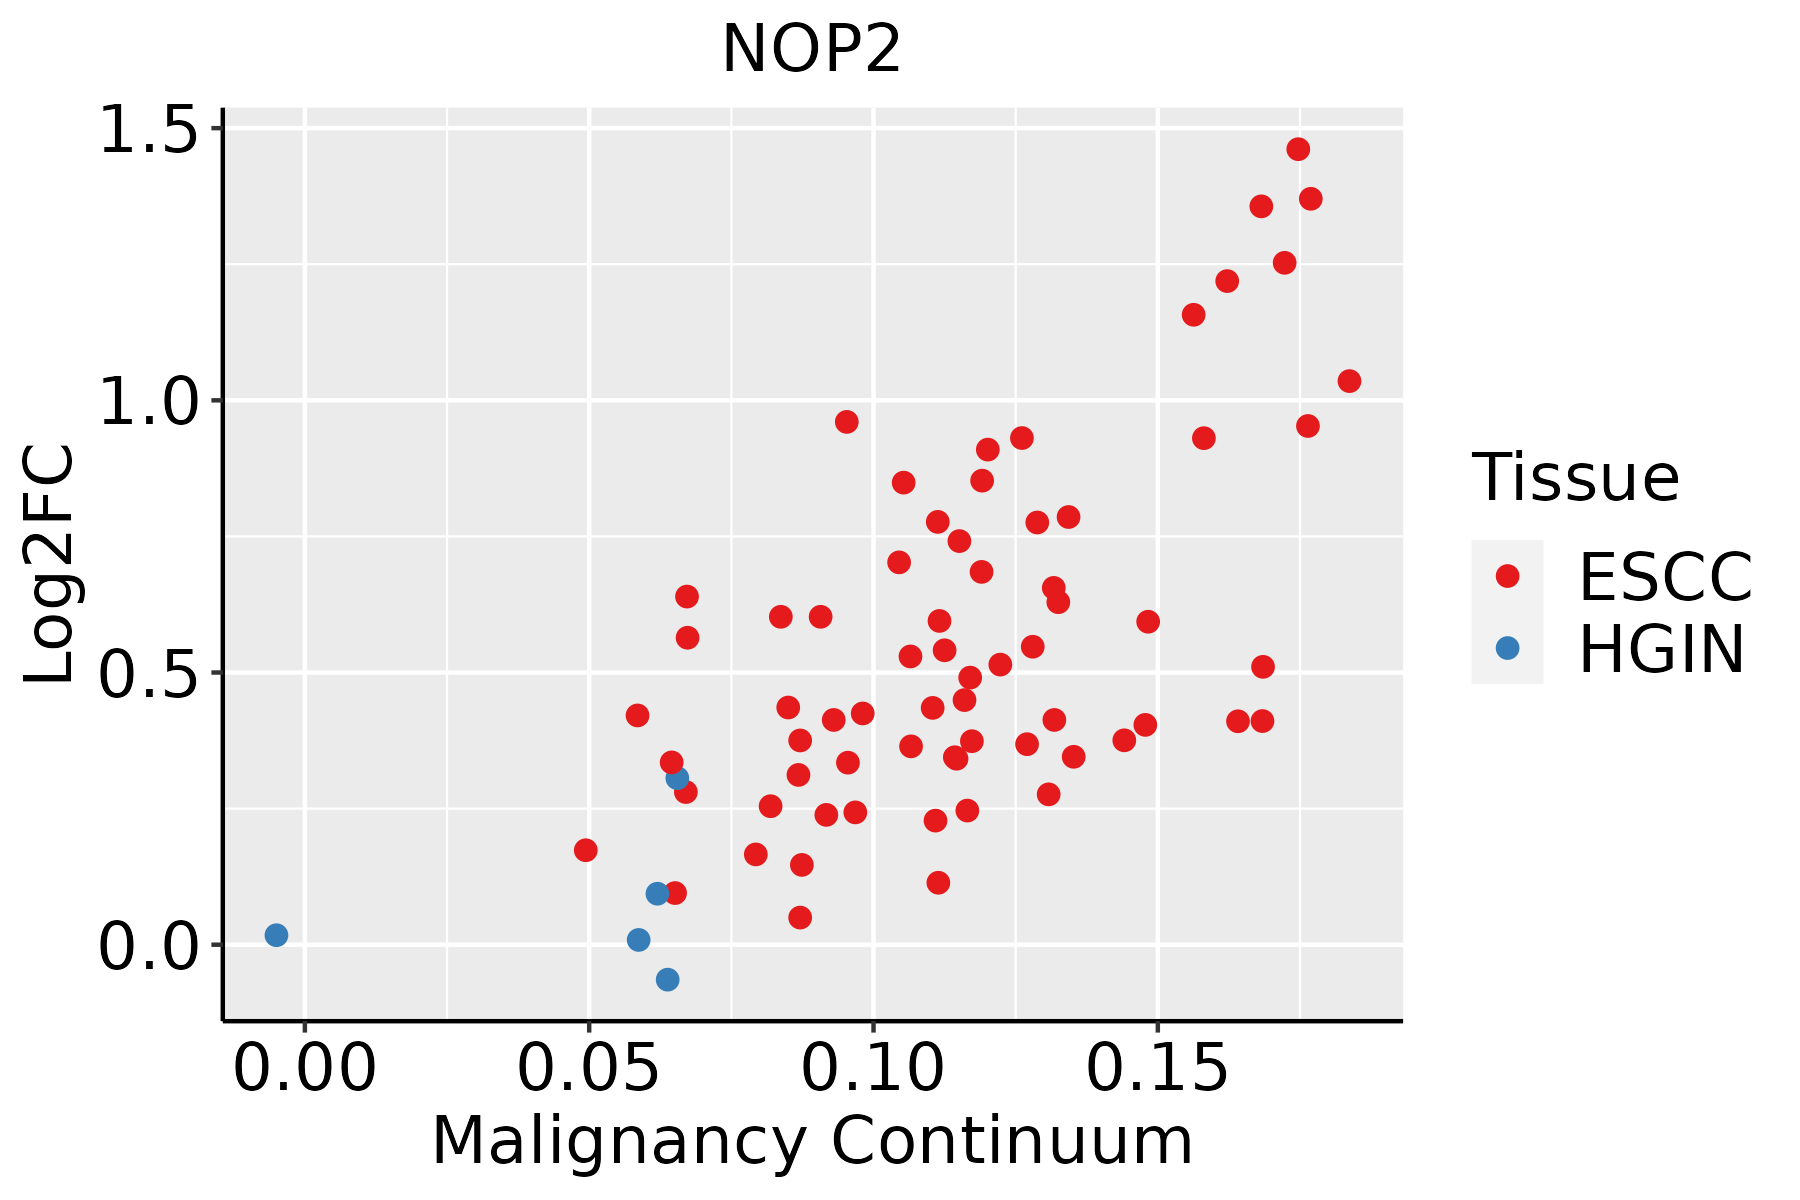 | ESCC: Esophageal squamous cell carcinoma |
| HGIN: High-grade intraepithelial neoplasias | ||
| LGIN: Low-grade intraepithelial neoplasias | ||
| Oral Cavity | 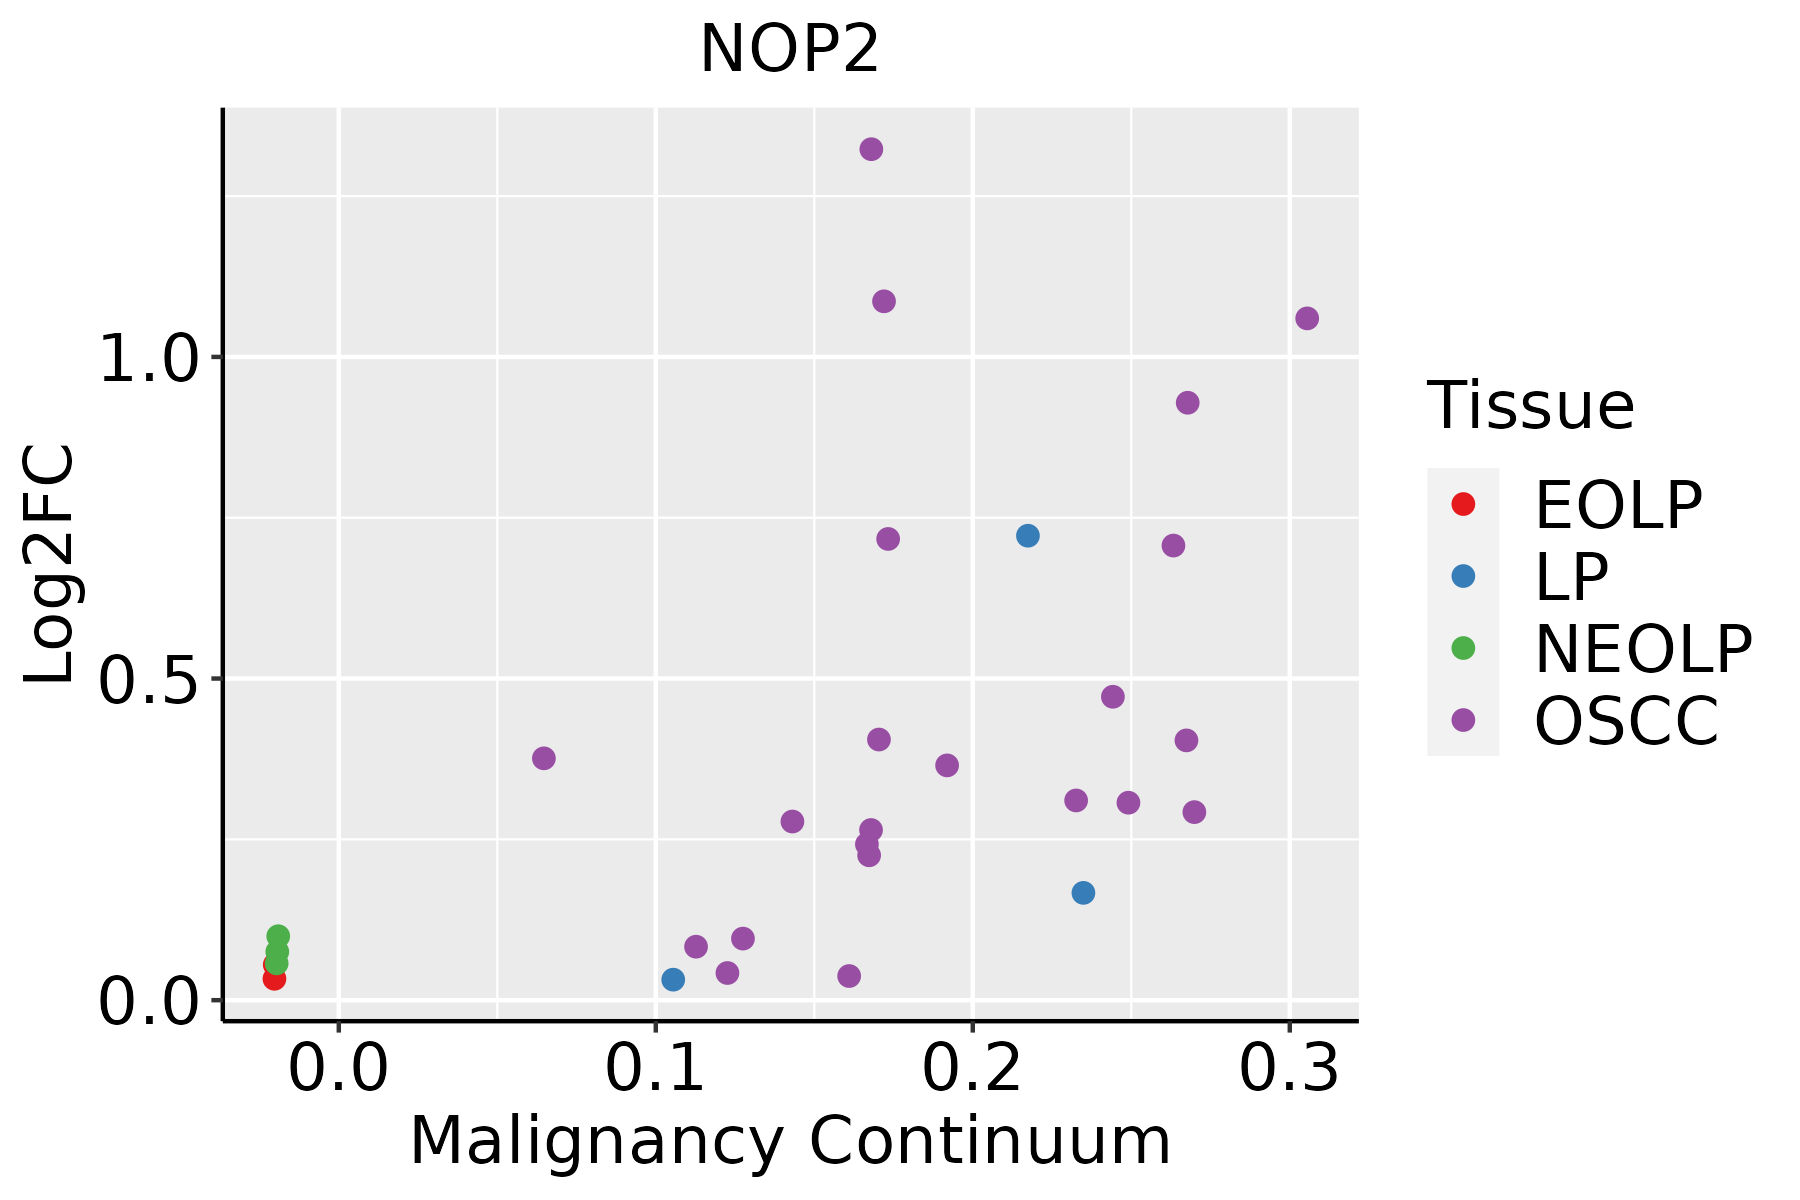 | EOLP: Erosive Oral lichen planus |
| LP: leukoplakia | ||
| NEOLP: Non-erosive oral lichen planus | ||
| OSCC: Oral squamous cell carcinoma |
| ∗log2FC in expression of this searched gene in stem-like cells from each diseased tissue sample relative to stem-like cells in normal samples in each tissue plotted against the malignancy continuum. Samples are colored based on if they are from different disease stage. |
Top |
Malignant transformation related pathway analysis |
| Find out the enriched GO biological processes and KEGG pathways involved in transition from healthy to precancer to cancer |
| Tissue | Disease Stage | Enriched GO biological Processes |
| Colorectum | AD |  |
| Colorectum | SER |  |
| Colorectum | MSS |  |
| Colorectum | MSI-H |  |
| Colorectum | FAP |  |
| ∗Top 15 enriched GO BP terms are showed in the bar plot of each disease state in each tissue. Each row represents a significant GO biological process which is colored according to the -log10(p.adjust). |
| Page: 1 2 3 4 5 6 7 8 9 |
| GO ID | Tissue | Disease Stage | Description | Gene Ratio | Bg Ratio | pvalue | p.adjust | Count |
| GO:0022618 | Colorectum | AD | ribonucleoprotein complex assembly | 92/3918 | 220/18723 | 1.49e-12 | 2.60e-10 | 92 |
| GO:0071826 | Colorectum | AD | ribonucleoprotein complex subunit organization | 94/3918 | 227/18723 | 1.70e-12 | 2.87e-10 | 94 |
| GO:0022613 | Colorectum | AD | ribonucleoprotein complex biogenesis | 151/3918 | 463/18723 | 1.96e-09 | 1.39e-07 | 151 |
| GO:0072331 | Colorectum | AD | signal transduction by p53 class mediator | 58/3918 | 163/18723 | 1.04e-05 | 2.40e-04 | 58 |
| GO:0042255 | Colorectum | AD | ribosome assembly | 28/3918 | 61/18723 | 1.08e-05 | 2.47e-04 | 28 |
| GO:1901796 | Colorectum | AD | regulation of signal transduction by p53 class mediator | 36/3918 | 93/18723 | 6.58e-05 | 1.07e-03 | 36 |
| GO:0042273 | Colorectum | AD | ribosomal large subunit biogenesis | 28/3918 | 72/18723 | 3.74e-04 | 4.31e-03 | 28 |
| GO:0042254 | Colorectum | AD | ribosome biogenesis | 84/3918 | 299/18723 | 1.82e-03 | 1.50e-02 | 84 |
| GO:0000027 | Colorectum | AD | ribosomal large subunit assembly | 12/3918 | 27/18723 | 5.07e-03 | 3.38e-02 | 12 |
| GO:00226181 | Colorectum | SER | ribonucleoprotein complex assembly | 69/2897 | 220/18723 | 2.25e-09 | 2.15e-07 | 69 |
| GO:00718261 | Colorectum | SER | ribonucleoprotein complex subunit organization | 70/2897 | 227/18723 | 3.83e-09 | 3.51e-07 | 70 |
| GO:00226131 | Colorectum | SER | ribonucleoprotein complex biogenesis | 112/2897 | 463/18723 | 5.01e-07 | 2.48e-05 | 112 |
| GO:00422551 | Colorectum | SER | ribosome assembly | 25/2897 | 61/18723 | 1.44e-06 | 6.55e-05 | 25 |
| GO:00723311 | Colorectum | SER | signal transduction by p53 class mediator | 43/2897 | 163/18723 | 2.22e-04 | 3.90e-03 | 43 |
| GO:00422731 | Colorectum | SER | ribosomal large subunit biogenesis | 23/2897 | 72/18723 | 3.60e-04 | 5.61e-03 | 23 |
| GO:19017961 | Colorectum | SER | regulation of signal transduction by p53 class mediator | 27/2897 | 93/18723 | 6.48e-04 | 8.71e-03 | 27 |
| GO:00000271 | Colorectum | SER | ribosomal large subunit assembly | 11/2897 | 27/18723 | 1.40e-03 | 1.53e-02 | 11 |
| GO:00422541 | Colorectum | SER | ribosome biogenesis | 66/2897 | 299/18723 | 1.48e-03 | 1.60e-02 | 66 |
| GO:00718262 | Colorectum | MSS | ribonucleoprotein complex subunit organization | 90/3467 | 227/18723 | 6.88e-14 | 1.78e-11 | 90 |
| GO:00226182 | Colorectum | MSS | ribonucleoprotein complex assembly | 88/3467 | 220/18723 | 7.12e-14 | 1.78e-11 | 88 |
| Page: 1 2 3 4 5 |
| Pathway ID | Tissue | Disease Stage | Description | Gene Ratio | Bg Ratio | pvalue | p.adjust | qvalue | Count |
| Page: 1 |
Top |
Cell-cell communication analysis |
| Identification of potential cell-cell interactions between two cell types and their ligand-receptor pairs for different disease states |
| Ligand | Receptor | LRpair | Pathway | Tissue | Disease Stage |
| Page: 1 |
Top |
Single-cell gene regulatory network inference analysis |
| Find out the significant the regulons (TFs) and the target genes of each regulon across cell types for different disease states |
| TF | Cell Type | Tissue | Disease Stage | Target Gene | RSS | Regulon Activity |
| ∗The dot plots of a searched regulon are shown for all cell subpopulations in each disease state of each tissue based on the regulon specific score inferred using pySCENIC and by calculating the average expression. |
| Page: 1 |
Top |
Somatic mutation of malignant transformation related genes |
| Annotation of somatic variants for genes involved in malignant transformation |
| Hugo Symbol | Variant Class | Variant Classification | dbSNP RS | HGVSc | HGVSp | HGVSp Short | SWISSPROT | BIOTYPE | SIFT | PolyPhen | Tumor Sample Barcode | Tissue | Histology | Sex | Age | Stage | Therapy Types | Drugs | Outcome |
| NOP2 | SNV | Missense_Mutation | c.745G>A | p.Glu249Lys | p.E249K | P46087 | protein_coding | tolerated(0.07) | benign(0.028) | TCGA-A8-A09X-01 | Breast | breast invasive carcinoma | Female | <65 | III/IV | Unknown | Unknown | SD | |
| NOP2 | SNV | Missense_Mutation | novel | c.2003N>C | p.Gln668Pro | p.Q668P | P46087 | protein_coding | tolerated(0.1) | benign(0.005) | TCGA-B6-A0I6-01 | Breast | breast invasive carcinoma | Female | <65 | I/II | Unknown | Unknown | PD |
| NOP2 | SNV | Missense_Mutation | rs771707726 | c.1400T>G | p.Val467Gly | p.V467G | P46087 | protein_coding | deleterious(0) | probably_damaging(0.969) | TCGA-B6-A1KN-01 | Breast | breast invasive carcinoma | Female | <65 | III/IV | Unknown | Unknown | SD |
| NOP2 | SNV | Missense_Mutation | c.1208N>A | p.Gly403Glu | p.G403E | P46087 | protein_coding | deleterious(0.01) | probably_damaging(0.966) | TCGA-C8-A131-01 | Breast | breast invasive carcinoma | Female | >=65 | III/IV | Chemotherapy | 5-fluorouracil | CR | |
| NOP2 | SNV | Missense_Mutation | c.994N>A | p.Glu332Lys | p.E332K | P46087 | protein_coding | deleterious(0) | possibly_damaging(0.621) | TCGA-D8-A1J8-01 | Breast | breast invasive carcinoma | Female | >=65 | I/II | Hormone Therapy | nolvadex | SD | |
| NOP2 | insertion | In_Frame_Ins | novel | c.1231_1232insGGC | p.Met411delinsArgLeu | p.M411delinsRL | P46087 | protein_coding | TCGA-A8-A07J-01 | Breast | breast invasive carcinoma | Female | <65 | I/II | Chemotherapy | 5-fluorouracil | CR | ||
| NOP2 | insertion | In_Frame_Ins | novel | c.1230_1231insCAAGACAGG | p.Val410_Met411insGlnAspArg | p.V410_M411insQDR | P46087 | protein_coding | TCGA-A8-A07J-01 | Breast | breast invasive carcinoma | Female | <65 | I/II | Chemotherapy | 5-fluorouracil | CR | ||
| NOP2 | insertion | In_Frame_Ins | novel | c.2000_2001insTGGGGTGGGCGTCCAGATCGACACCATCAC | p.Gln667delinsHisGlyValGlyValGlnIleAspThrIleThr | p.Q667delinsHGVGVQIDTIT | P46087 | protein_coding | TCGA-B6-A0I6-01 | Breast | breast invasive carcinoma | Female | <65 | I/II | Unknown | Unknown | PD | ||
| NOP2 | insertion | In_Frame_Ins | novel | c.2000_2001insCTCCAGCCCGGGCGACAGTGAGAC | p.Gln667delinsHisSerSerProGlyAspSerGluThr | p.Q667delinsHSSPGDSET | P46087 | protein_coding | TCGA-B6-A0RE-01 | Breast | breast invasive carcinoma | Female | <65 | I/II | Unknown | Unknown | SD | ||
| NOP2 | deletion | Frame_Shift_Del | novel | c.1517delN | p.Pro506GlnfsTer3 | p.P506Qfs*3 | P46087 | protein_coding | TCGA-EW-A2FV-01 | Breast | breast invasive carcinoma | Female | <65 | III/IV | Chemotherapy | docetaxel | SD |
| Page: 1 2 3 4 5 6 7 |
Top |
Related drugs of malignant transformation related genes |
| Identification of chemicals and drugs interact with genes involved in malignant transfromation |
| (DGIdb 4.0) |
| Entrez ID | Symbol | Category | Interaction Types | Drug Claim Name | Drug Name | PMIDs |
| Page: 1 |

Copyright 2023-Present -The University of Texas Health Science Center at Houston |