Schematic overview of the cellular and molecular mechanisms involved in the cancer progression, including the proposed cellular and molecular mechanisms in cancer cells trajectory. AT1: alveolar type 1 cells; AT2: alveolar type 2 cells; AAH: atypical adenomatous hyperplasia; AIS: adenocarcinoma in situ; MIA: minimally invasive adenocarcinoma; IA: invasive adenocarcinoma; EMT: epithelial-mesenchymal transition

Home

Download

Statistics

Help

Contact

Center for Computational Systems Medicine
leaf

Gene summary

leaf

Malignant transformation analysis

leaf

Malignant transformation related pathway analysis

leaf

Cell-cell communication analysis

leaf

Single-cell gene regulatory network inference analysis

leaf

Somatic mutation of malignant transformation related genes

leaf

Related drugs of malignant transformation related genes

Gene: NOP16

Gene summary for NOP16

check button Gene summary.

Gene informationSpeciesHuman
Gene symbol

NOP16

Gene ID

51491

Gene nameNOP16 nucleolar protein
Gene AliasHSPC111
Cytomap5q35.2
Gene Typeprotein-coding
GO ID

GO:0008150

UniProtAcc

Q9Y3C1


Top

Malignant transformation analysis

check button Identification of the aberrant gene expression in precancerous and cancerous lesions by comparing the gene expression of stem-like cells in diseased tissues with normal stem cells
check button Malignant transformation involving gene list.
Entrez IDSymbolReplicatesSpeciesOrganTissueAdj P-valueLog2FCMalignancy
51491NOP16HTA11_1938_2000001011HumanColorectumAD1.15e-104.23e-01-0.0811
51491NOP16HTA11_83_2000001011HumanColorectumSER2.14e-022.59e-01-0.1526
51491NOP16HTA11_696_2000001011HumanColorectumAD6.98e-031.95e-01-0.1464
51491NOP16HTA11_1391_2000001011HumanColorectumAD1.58e-145.88e-01-0.059
51491NOP16HTA11_7862_2000001011HumanColorectumAD7.81e-043.18e-01-0.0179
51491NOP16HTA11_866_3004761011HumanColorectumAD3.19e-206.03e-010.096
51491NOP16HTA11_8622_2000001021HumanColorectumSER2.19e-064.72e-010.0528
51491NOP16HTA11_7696_3000711011HumanColorectumAD8.77e-164.75e-010.0674
51491NOP16HTA11_99999970781_79442HumanColorectumMSS5.93e-196.46e-010.294
51491NOP16HTA11_99999965104_69814HumanColorectumMSS1.17e-033.12e-010.281
51491NOP16HTA11_99999971662_82457HumanColorectumMSS2.89e-358.68e-010.3859
51491NOP16HTA11_99999973899_84307HumanColorectumMSS2.41e-054.69e-010.2585
51491NOP16HTA11_99999974143_84620HumanColorectumMSS5.32e-072.95e-010.3005
51491NOP16LZE4THumanEsophagusESCC2.08e-07-4.53e-020.0811
51491NOP16LZE7THumanEsophagusESCC9.89e-141.99e-010.0667
51491NOP16LZE20THumanEsophagusESCC1.16e-07-1.28e-010.0662
51491NOP16LZE22D1HumanEsophagusHGIN1.10e-02-3.56e-010.0595
51491NOP16LZE24THumanEsophagusESCC1.32e-053.37e-010.0596
51491NOP16P1T-EHumanEsophagusESCC7.47e-05-2.90e-020.0875
51491NOP16P2T-EHumanEsophagusESCC3.09e-163.41e-010.1177
Page: 1 2 3 4 5 6 7 

check button Transcriptomic changes along malignancy continuum.
TissueExpression DynamicsAbbreviation
Colorectum (GSE201348)The image shows the transcriptomic changes along malignancy continuum.log2FC in expression of this searched gene in stem-like cells from each diseased tissue sample relative to stem-like cells in normal samples in each tissue plotted against the malignancy continuum. Samples are colored based on if they are from different disease stage.FAP: Familial adenomatous polyposis
CRC: Colorectal cancer
Colorectum (HTA11)The image shows the transcriptomic changes along malignancy continuum.log2FC in expression of this searched gene in stem-like cells from each diseased tissue sample relative to stem-like cells in normal samples in each tissue plotted against the malignancy continuum. Samples are colored based on if they are from different disease stage.AD: Adenomas
SER: Sessile serrated lesions
MSI-H: Microsatellite-high colorectal cancer
MSS: Microsatellite stable colorectal cancer
EsophagusThe image shows the transcriptomic changes along malignancy continuum.log2FC in expression of this searched gene in stem-like cells from each diseased tissue sample relative to stem-like cells in normal samples in each tissue plotted against the malignancy continuum. Samples are colored based on if they are from different disease stage.ESCC: Esophageal squamous cell carcinoma
HGIN: High-grade intraepithelial neoplasias
LGIN: Low-grade intraepithelial neoplasias
LiverThe image shows the transcriptomic changes along malignancy continuum.log2FC in expression of this searched gene in stem-like cells from each diseased tissue sample relative to stem-like cells in normal samples in each tissue plotted against the malignancy continuum. Samples are colored based on if they are from different disease stage.HCC: Hepatocellular carcinoma
NAFLD: Non-alcoholic fatty liver disease
Oral CavityThe image shows the transcriptomic changes along malignancy continuum.log2FC in expression of this searched gene in stem-like cells from each diseased tissue sample relative to stem-like cells in normal samples in each tissue plotted against the malignancy continuum. Samples are colored based on if they are from different disease stage.EOLP: Erosive Oral lichen planus
LP: leukoplakia
NEOLP: Non-erosive oral lichen planus
OSCC: Oral squamous cell carcinoma
ProstateThe image shows the transcriptomic changes along malignancy continuum.log2FC in expression of this searched gene in stem-like cells from each diseased tissue sample relative to stem-like cells in normal samples in each tissue plotted against the malignancy continuum. Samples are colored based on if they are from different disease stage.BPH: Benign Prostatic Hyperplasia
SkinThe image shows the transcriptomic changes along malignancy continuum.log2FC in expression of this searched gene in stem-like cells from each diseased tissue sample relative to stem-like cells in normal samples in each tissue plotted against the malignancy continuum. Samples are colored based on if they are from different disease stage.
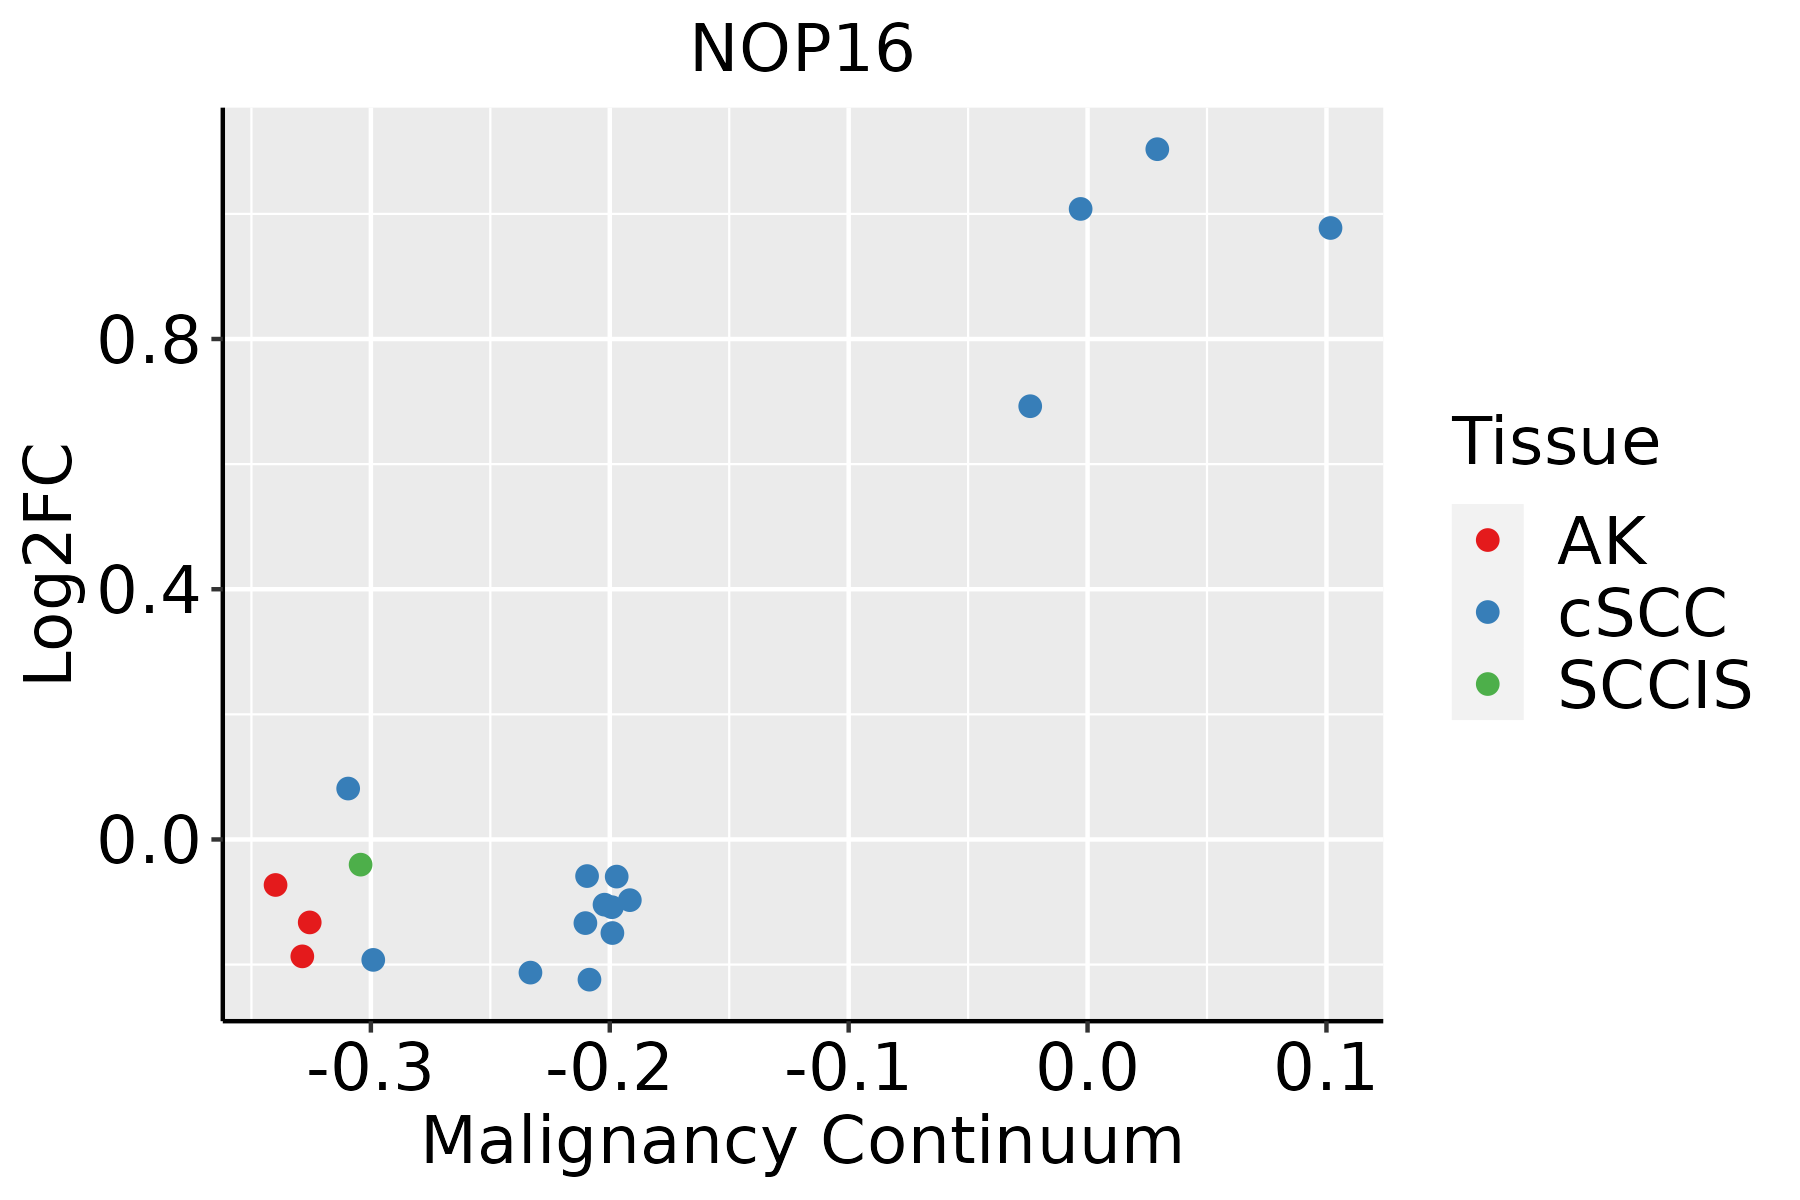
AK: Actinic keratosis
cSCC: Cutaneous squamous cell carcinoma
SCCIS:squamous cell carcinoma in situ
ThyroidThe image shows the transcriptomic changes along malignancy continuum.log2FC in expression of this searched gene in stem-like cells from each diseased tissue sample relative to stem-like cells in normal samples in each tissue plotted against the malignancy continuum. Samples are colored based on if they are from different disease stage.
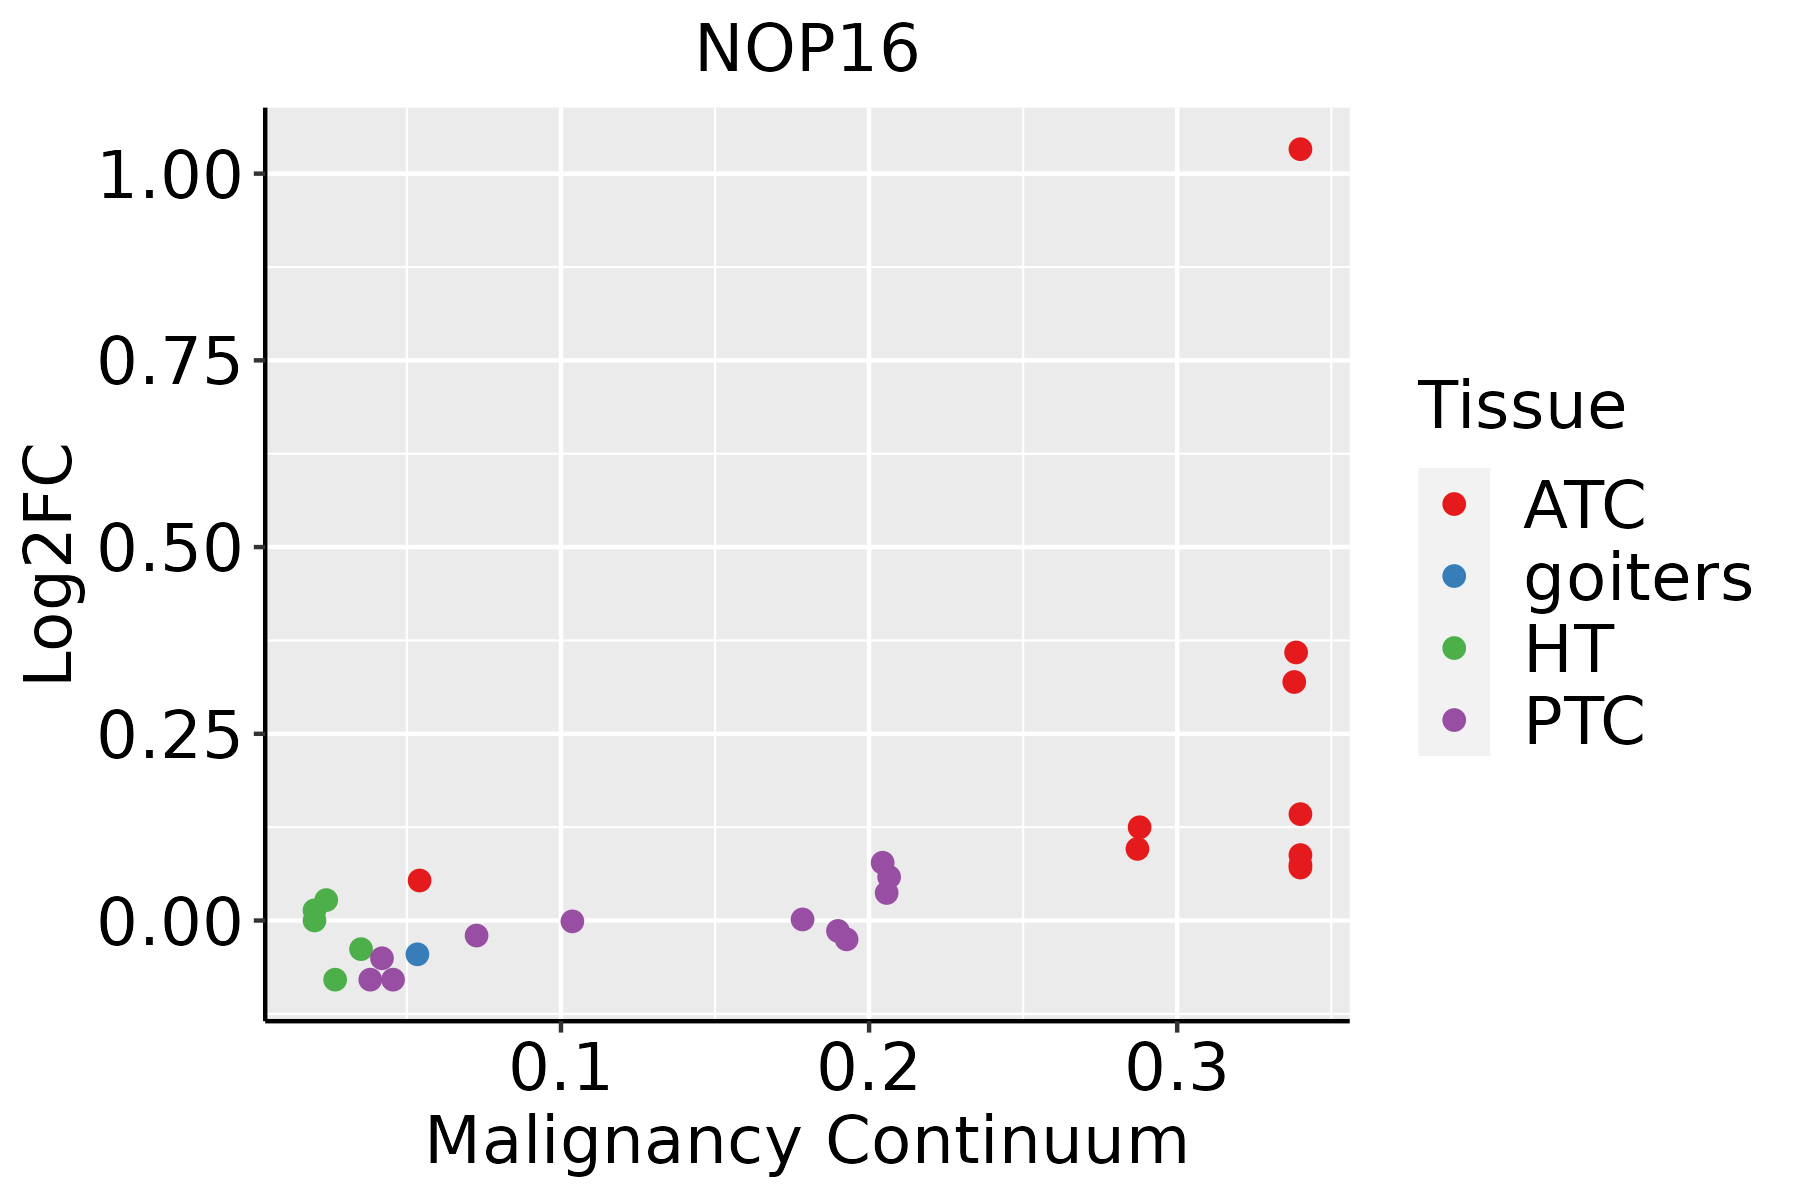
ATC: Anaplastic thyroid cancer
HT: Hashimoto's thyroiditis
PTC: Papillary thyroid cancer
∗log2FC in expression of this searched gene in stem-like cells from each diseased tissue sample relative to stem-like cells in normal samples in each tissue plotted against the malignancy continuum. Samples are colored based on if they are from different disease stage.

Top

Malignant transformation related pathway analysis

check buttonFind out the enriched GO biological processes and KEGG pathways involved in transition from healthy to precancer to cancer
check button Figure of enriched GO biological processes.
TissueDisease StageEnriched GO biological Processes
ColorectumADGO analysis - Figure of enriched GO biological processes: Top 15 enriched GO BP terms are showed in the bar plot of each disease state in each tissue. Each row represents a significant GO biological process which is colored according to the -log10(p.adjust).
ColorectumSERGO analysis - Figure of enriched GO biological processes: Top 15 enriched GO BP terms are showed in the bar plot of each disease state in each tissue. Each row represents a significant GO biological process which is colored according to the -log10(p.adjust).
ColorectumMSSGO analysis - Figure of enriched GO biological processes: Top 15 enriched GO BP terms are showed in the bar plot of each disease state in each tissue. Each row represents a significant GO biological process which is colored according to the -log10(p.adjust).
ColorectumMSI-HGO analysis - Figure of enriched GO biological processes: Top 15 enriched GO BP terms are showed in the bar plot of each disease state in each tissue. Each row represents a significant GO biological process which is colored according to the -log10(p.adjust).
ColorectumFAPGO analysis - Figure of enriched GO biological processes: Top 15 enriched GO BP terms are showed in the bar plot of each disease state in each tissue. Each row represents a significant GO biological process which is colored according to the -log10(p.adjust).
∗Top 15 enriched GO BP terms are showed in the bar plot of each disease state in each tissue. Each row represents a significant GO biological process which is colored according to the -log10(p.adjust).
Page: 1 2 3 4 5 6 7 8 9 

check button Enriched GO biological processes.
GO IDTissueDisease StageDescriptionGene RatioBg Ratiopvaluep.adjustCount
GO:0022613ColorectumADribonucleoprotein complex biogenesis151/3918463/187231.96e-091.39e-07151
GO:0042273ColorectumADribosomal large subunit biogenesis28/391872/187233.74e-044.31e-0328
GO:0042254ColorectumADribosome biogenesis84/3918299/187231.82e-031.50e-0284
GO:00226131ColorectumSERribonucleoprotein complex biogenesis112/2897463/187235.01e-072.48e-05112
GO:00422731ColorectumSERribosomal large subunit biogenesis23/289772/187233.60e-045.61e-0323
GO:00422541ColorectumSERribosome biogenesis66/2897299/187231.48e-031.60e-0266
GO:00226132ColorectumMSSribonucleoprotein complex biogenesis144/3467463/187232.76e-113.67e-09144
GO:00422732ColorectumMSSribosomal large subunit biogenesis28/346772/187234.16e-057.83e-0428
GO:00422542ColorectumMSSribosome biogenesis79/3467299/187234.32e-045.23e-0379
GO:002261327EsophagusHGINribonucleoprotein complex biogenesis158/2587463/187232.61e-295.23e-26158
GO:004225426EsophagusHGINribosome biogenesis101/2587299/187238.74e-194.03e-16101
GO:004227326EsophagusHGINribosomal large subunit biogenesis34/258772/187238.82e-121.06e-0934
GO:0022613111EsophagusESCCribonucleoprotein complex biogenesis365/8552463/187231.74e-491.11e-45365
GO:0042254111EsophagusESCCribosome biogenesis252/8552299/187233.27e-441.04e-40252
GO:0042273111EsophagusESCCribosomal large subunit biogenesis65/855272/187231.53e-159.82e-1465
GO:002261312LiverCirrhoticribonucleoprotein complex biogenesis231/4634463/187233.28e-326.86e-29231
GO:004225412LiverCirrhoticribosome biogenesis154/4634299/187231.18e-236.72e-21154
GO:004227312LiverCirrhoticribosomal large subunit biogenesis47/463472/187234.20e-133.29e-1147
GO:002261322LiverHCCribonucleoprotein complex biogenesis355/7958463/187237.76e-524.92e-48355
GO:004225422LiverHCCribosome biogenesis246/7958299/187234.99e-461.58e-42246
Page: 1 2 

check button Enriched KEGG pathways.
Pathway IDTissueDisease StageDescriptionGene RatioBg Ratiopvaluep.adjustqvalueCount
Page: 1 

Top

Cell-cell communication analysis

check buttonIdentification of potential cell-cell interactions between two cell types and their ligand-receptor pairs for different disease states
LigandReceptorLRpairPathwayTissueDisease Stage
Page: 1 

Top

Single-cell gene regulatory network inference analysis

check buttonFind out the significant the regulons (TFs) and the target genes of each regulon across cell types for different disease states
TFCell TypeTissueDisease StageTarget GeneRSSRegulon Activity
∗The dot plots of a searched regulon are shown for all cell subpopulations in each disease state of each tissue based on the regulon specific score inferred using pySCENIC and by calculating the average expression.
Page: 1 

Top

Somatic mutation of malignant transformation related genes

check buttonAnnotation of somatic variants for genes involved in malignant transformation
Hugo SymbolVariant ClassVariant ClassificationdbSNP RSHGVScHGVSpHGVSp ShortSWISSPROTBIOTYPESIFTPolyPhenTumor Sample BarcodeTissueHistologySexAgeStageTherapy TypesDrugsOutcome
NOP16SNVMissense_Mutationnovelc.544N>Cp.Glu182Glnp.E182QQ9Y3C1protein_codingdeleterious_low_confidence(0)benign(0.031)TCGA-AC-A23H-01Breastbreast invasive carcinomaFemale>=65I/IIUnknownUnknownPD
NOP16SNVMissense_Mutationc.438N>Tp.Trp146Cysp.W146CQ9Y3C1protein_codingdeleterious_low_confidence(0)probably_damaging(0.994)TCGA-B6-A0IA-01Breastbreast invasive carcinomaFemale<65I/IIUnknownUnknownSD
NOP16SNVMissense_Mutationc.329C>Tp.Thr110Ilep.T110IQ9Y3C1protein_codingtolerated(0.14)possibly_damaging(0.637)TCGA-B6-A0RL-01Breastbreast invasive carcinomaFemale<65I/IIUnknownUnknownSD
NOP16SNVMissense_Mutationc.284A>Gp.Asn95Serp.N95SQ9Y3C1protein_codingtolerated(0.1)benign(0.1)TCGA-BH-A1FU-01Breastbreast invasive carcinomaFemale<65I/IIUnknownUnknownPD
NOP16insertionNonsense_Mutationnovelc.433_434insTCCAAGGTCCCCAACCTGGCTTCTGGGACTGGTp.Arg145delinsIleGlnGlyProGlnProGlyPheTrpAspTrpTerp.R145delinsIQGPQPGFWDW*Q9Y3C1protein_codingTCGA-BH-A0H7-01Breastbreast invasive carcinomaFemale>=65III/IVChemotherapydoxorubicinSD
NOP16deletionFrame_Shift_Delnovelc.417delNp.Leu140PhefsTer27p.L140Ffs*27Q9Y3C1protein_codingTCGA-D8-A27V-01Breastbreast invasive carcinomaFemale<65I/IIHormone TherapytamoxiphenSD
NOP16SNVMissense_Mutationnovelc.694A>Gp.Met232Valp.M232VQ9Y3C1protein_codingtolerated_low_confidence(0.67)benign(0)TCGA-AA-3715-01Colorectumcolon adenocarcinomaMale>=65I/IIUnknownUnknownPD
NOP16SNVMissense_Mutationnovelc.149N>Ap.Arg50Glnp.R50QQ9Y3C1protein_codingtolerated(0.31)benign(0.05)TCGA-A5-A0G2-01Endometriumuterine corpus endometrioid carcinomaFemale<65III/IVUnknownUnknownSD
NOP16SNVMissense_Mutationnovelc.476C>Tp.Ala159Valp.A159VQ9Y3C1protein_codingtolerated_low_confidence(0.07)benign(0.003)TCGA-AJ-A3EK-01Endometriumuterine corpus endometrioid carcinomaFemale<65I/IIChemotherapycarboplatinCR
NOP16SNVMissense_Mutationrs776470859c.602N>Ap.Arg201Hisp.R201HQ9Y3C1protein_codingtolerated_low_confidence(0.25)benign(0)TCGA-AP-A1DV-01Endometriumuterine corpus endometrioid carcinomaFemale<65I/IIUnknownUnknownSD
Page: 1 2 

Top

Related drugs of malignant transformation related genes

check buttonIdentification of chemicals and drugs interact with genes involved in malignant transfromation
(DGIdb 4.0)
Entrez IDSymbolCategoryInteraction TypesDrug Claim NameDrug NamePMIDs
Page: 1