
|
|||||
|
 | |
| |
| |
| |
| |
| |
|
Gene: NOP10 |
Gene summary for NOP10 |
| Gene information | Species | Human | Gene symbol | NOP10 | Gene ID | 55505 |
| Gene name | NOP10 ribonucleoprotein | |
| Gene Alias | DKCB1 | |
| Cytomap | 15q14 | |
| Gene Type | protein-coding | GO ID | GO:0000154 | UniProtAcc | Q9NPE3 |
Top |
Malignant transformation analysis |
| Identification of the aberrant gene expression in precancerous and cancerous lesions by comparing the gene expression of stem-like cells in diseased tissues with normal stem cells |
| Entrez ID | Symbol | Replicates | Species | Organ | Tissue | Adj P-value | Log2FC | Malignancy |
| 55505 | NOP10 | CA_HPV_1 | Human | Cervix | CC | 1.82e-06 | 7.57e-04 | 0.0264 |
| 55505 | NOP10 | CA_HPV_3 | Human | Cervix | CC | 1.47e-04 | -1.66e-01 | 0.0414 |
| 55505 | NOP10 | CCI_1 | Human | Cervix | CC | 1.34e-12 | -7.89e-01 | 0.528 |
| 55505 | NOP10 | CCI_2 | Human | Cervix | CC | 3.92e-04 | -5.28e-01 | 0.5249 |
| 55505 | NOP10 | CCI_3 | Human | Cervix | CC | 1.39e-14 | -7.62e-01 | 0.516 |
| 55505 | NOP10 | CCII_1 | Human | Cervix | CC | 3.70e-24 | -7.98e-01 | 0.3249 |
| 55505 | NOP10 | Tumor | Human | Cervix | CC | 9.26e-08 | 3.88e-01 | 0.1241 |
| 55505 | NOP10 | sample3 | Human | Cervix | CC | 2.47e-07 | 3.26e-01 | 0.1387 |
| 55505 | NOP10 | H2 | Human | Cervix | HSIL_HPV | 3.68e-06 | -3.72e-01 | 0.0632 |
| 55505 | NOP10 | L1 | Human | Cervix | CC | 4.97e-04 | -1.20e-01 | 0.0802 |
| 55505 | NOP10 | T3 | Human | Cervix | CC | 1.48e-08 | 3.24e-01 | 0.1389 |
| 55505 | NOP10 | HTA11_3410_2000001011 | Human | Colorectum | AD | 4.03e-02 | 1.65e-01 | 0.0155 |
| 55505 | NOP10 | HTA11_2487_2000001011 | Human | Colorectum | SER | 4.67e-09 | 5.87e-01 | -0.1808 |
| 55505 | NOP10 | HTA11_1938_2000001011 | Human | Colorectum | AD | 2.64e-06 | 4.23e-01 | -0.0811 |
| 55505 | NOP10 | HTA11_78_2000001011 | Human | Colorectum | AD | 4.23e-02 | 9.01e-02 | -0.1088 |
| 55505 | NOP10 | HTA11_347_2000001011 | Human | Colorectum | AD | 4.17e-13 | 4.06e-01 | -0.1954 |
| 55505 | NOP10 | HTA11_411_2000001011 | Human | Colorectum | SER | 2.25e-08 | 8.81e-01 | -0.2602 |
| 55505 | NOP10 | HTA11_3361_2000001011 | Human | Colorectum | AD | 4.57e-04 | 3.02e-01 | -0.1207 |
| 55505 | NOP10 | HTA11_83_2000001011 | Human | Colorectum | SER | 4.59e-08 | 4.40e-01 | -0.1526 |
| 55505 | NOP10 | HTA11_696_2000001011 | Human | Colorectum | AD | 3.49e-13 | 4.29e-01 | -0.1464 |
| Page: 1 2 3 4 5 6 7 8 9 10 11 |
| Tissue | Expression Dynamics | Abbreviation |
| Cervix |  | CC: Cervix cancer |
| HSIL_HPV: HPV-infected high-grade squamous intraepithelial lesions | ||
| N_HPV: HPV-infected normal cervix | ||
| Colorectum (GSE201348) |  | FAP: Familial adenomatous polyposis |
| CRC: Colorectal cancer | ||
| Colorectum (HTA11) |  | AD: Adenomas |
| SER: Sessile serrated lesions | ||
| MSI-H: Microsatellite-high colorectal cancer | ||
| MSS: Microsatellite stable colorectal cancer | ||
| Endometrium | 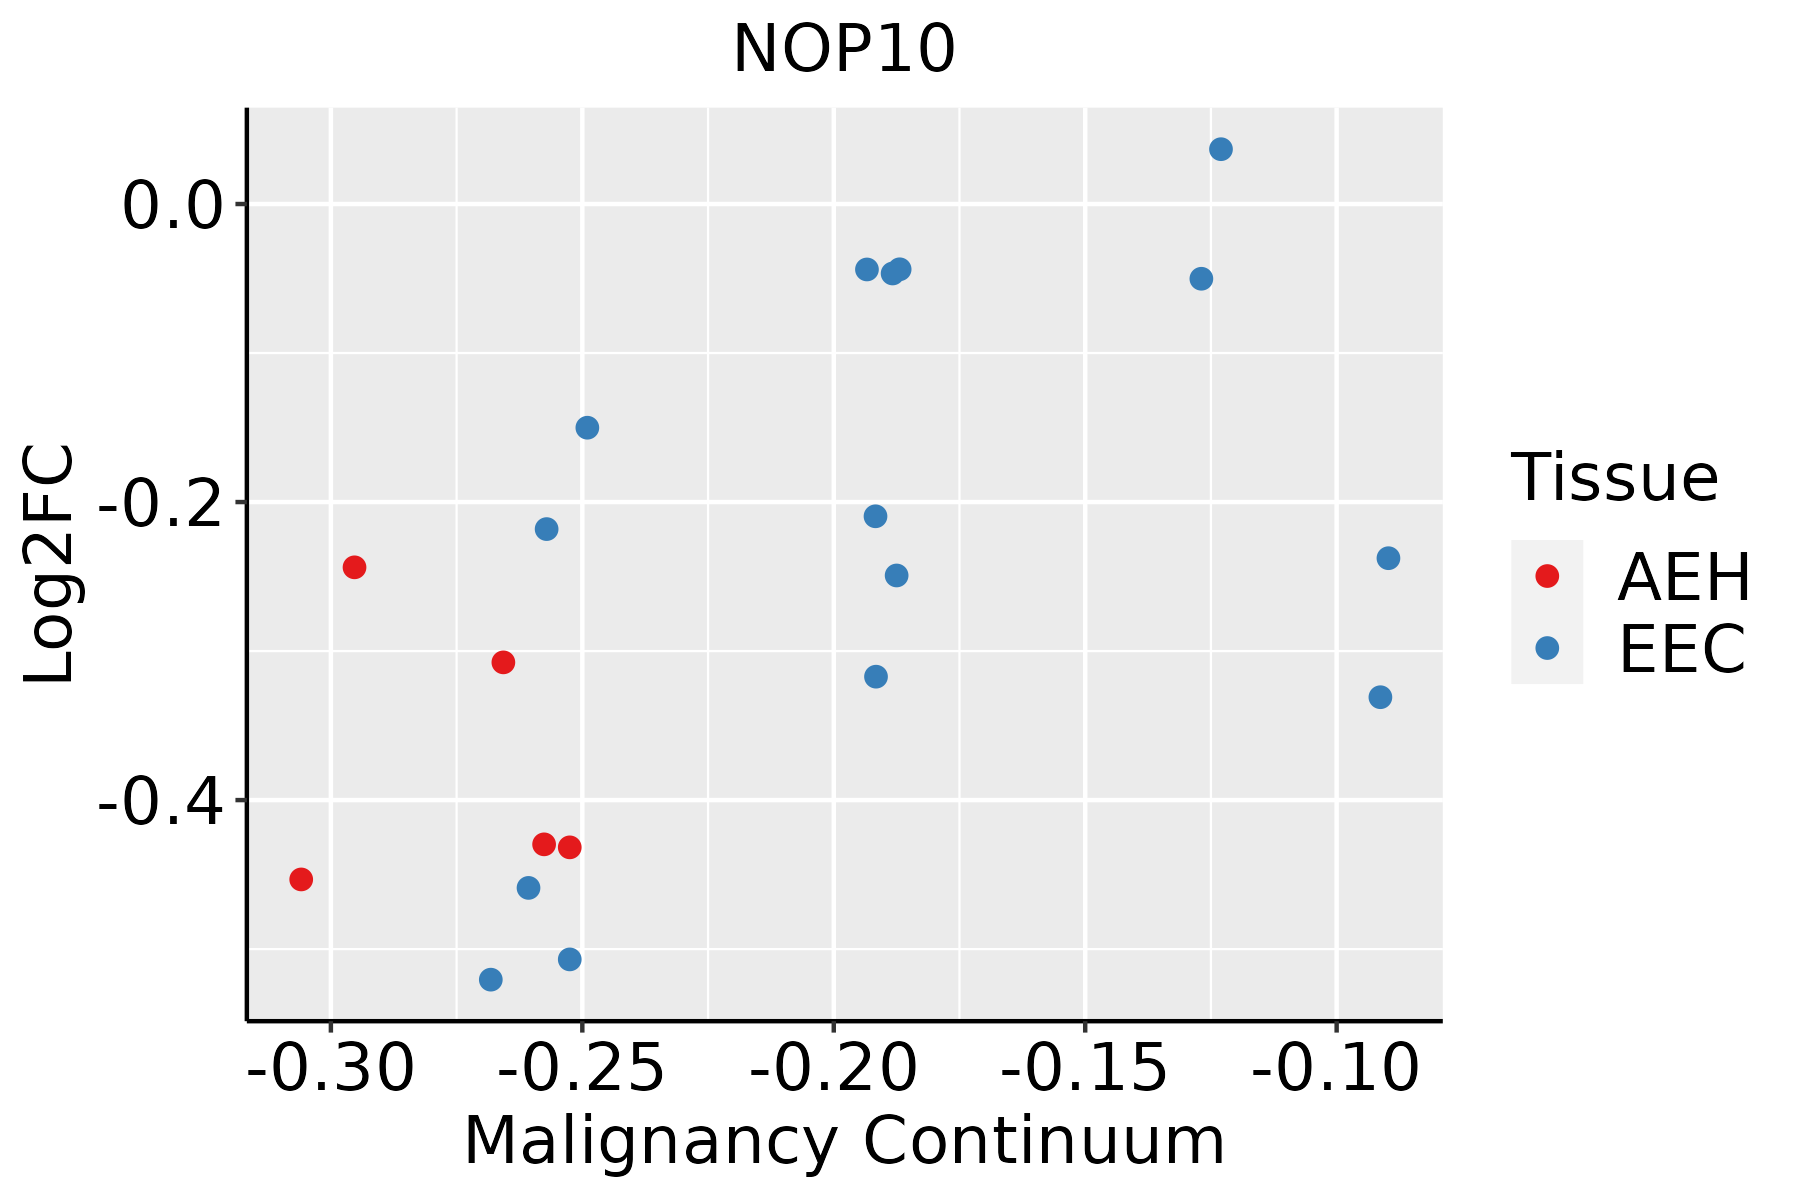 | AEH: Atypical endometrial hyperplasia |
| EEC: Endometrioid Cancer | ||
| Esophagus | 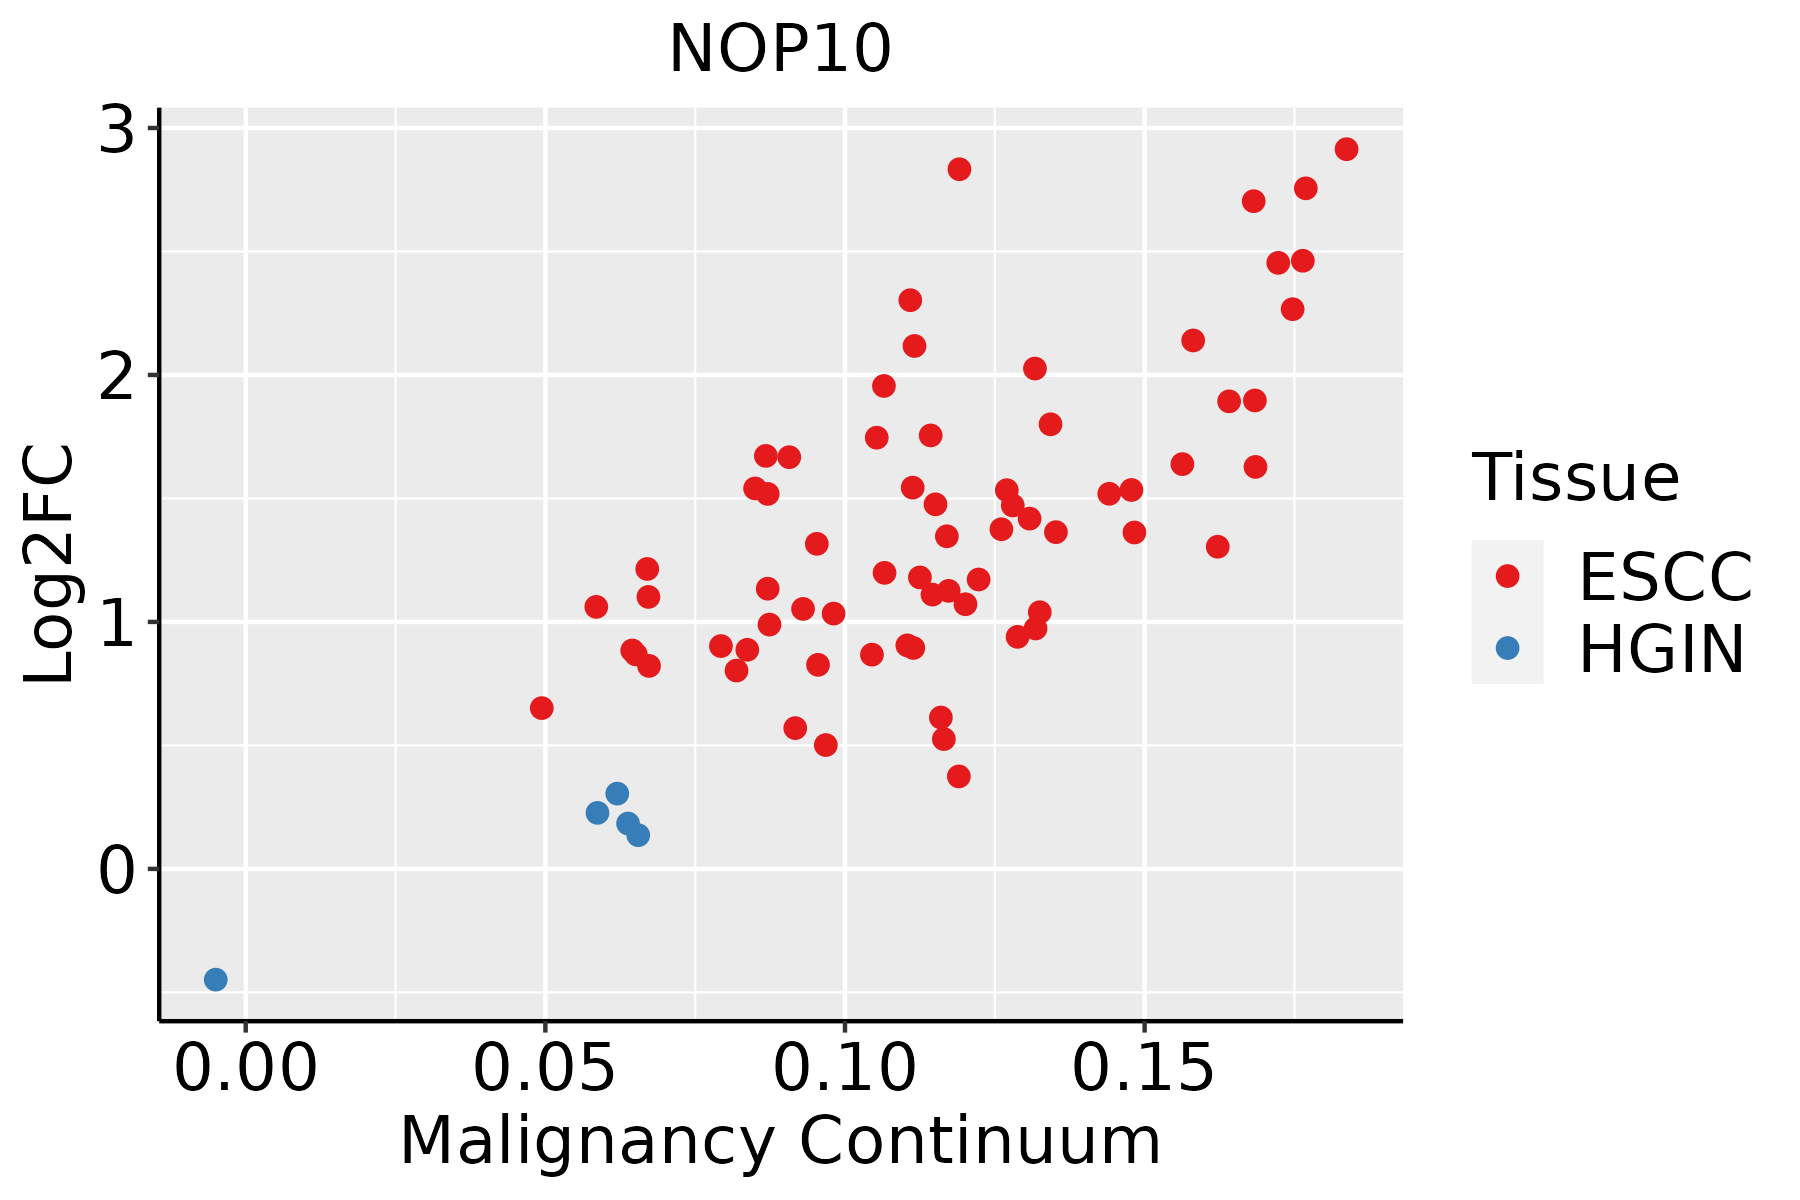 | ESCC: Esophageal squamous cell carcinoma |
| HGIN: High-grade intraepithelial neoplasias | ||
| LGIN: Low-grade intraepithelial neoplasias | ||
| Liver |  | HCC: Hepatocellular carcinoma |
| NAFLD: Non-alcoholic fatty liver disease | ||
| Oral Cavity |  | EOLP: Erosive Oral lichen planus |
| LP: leukoplakia | ||
| NEOLP: Non-erosive oral lichen planus | ||
| OSCC: Oral squamous cell carcinoma | ||
| Prostate | 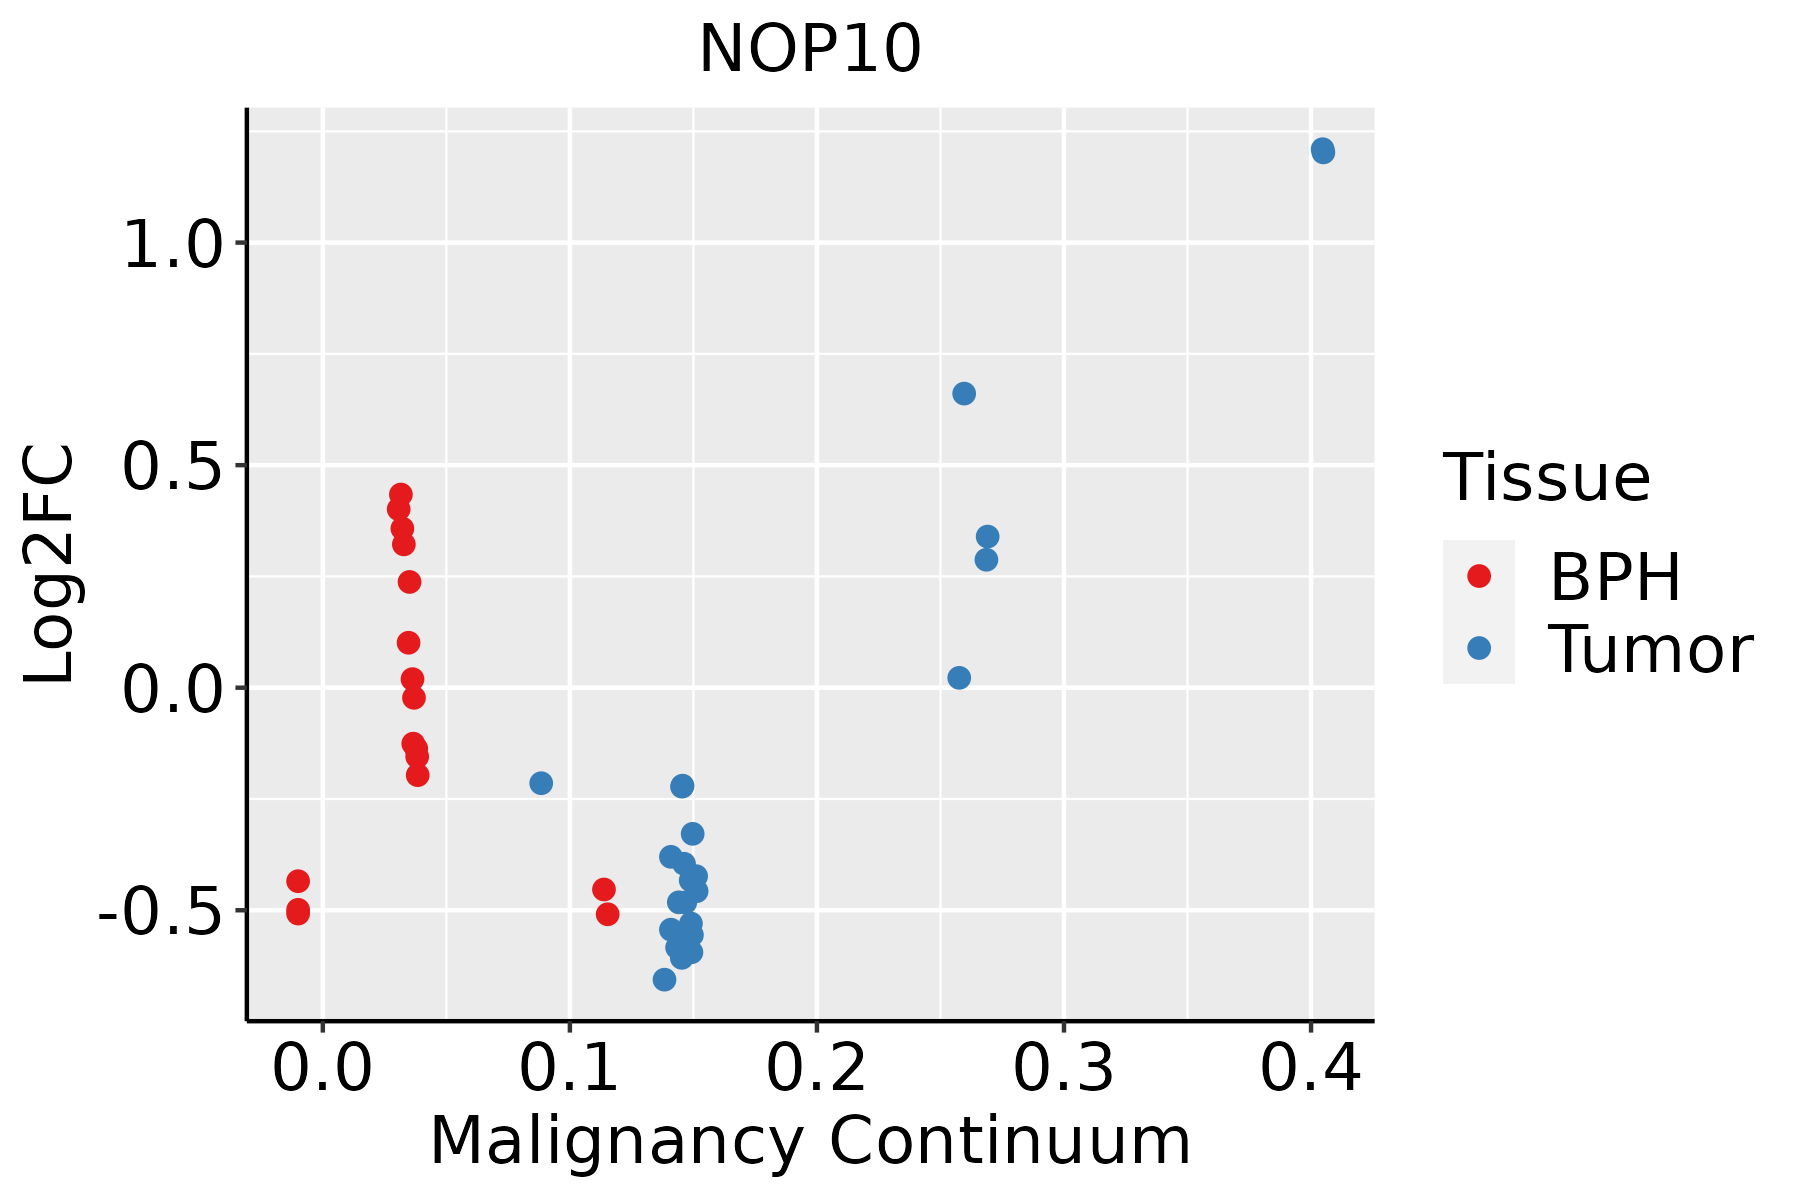 | BPH: Benign Prostatic Hyperplasia |
| Skin | 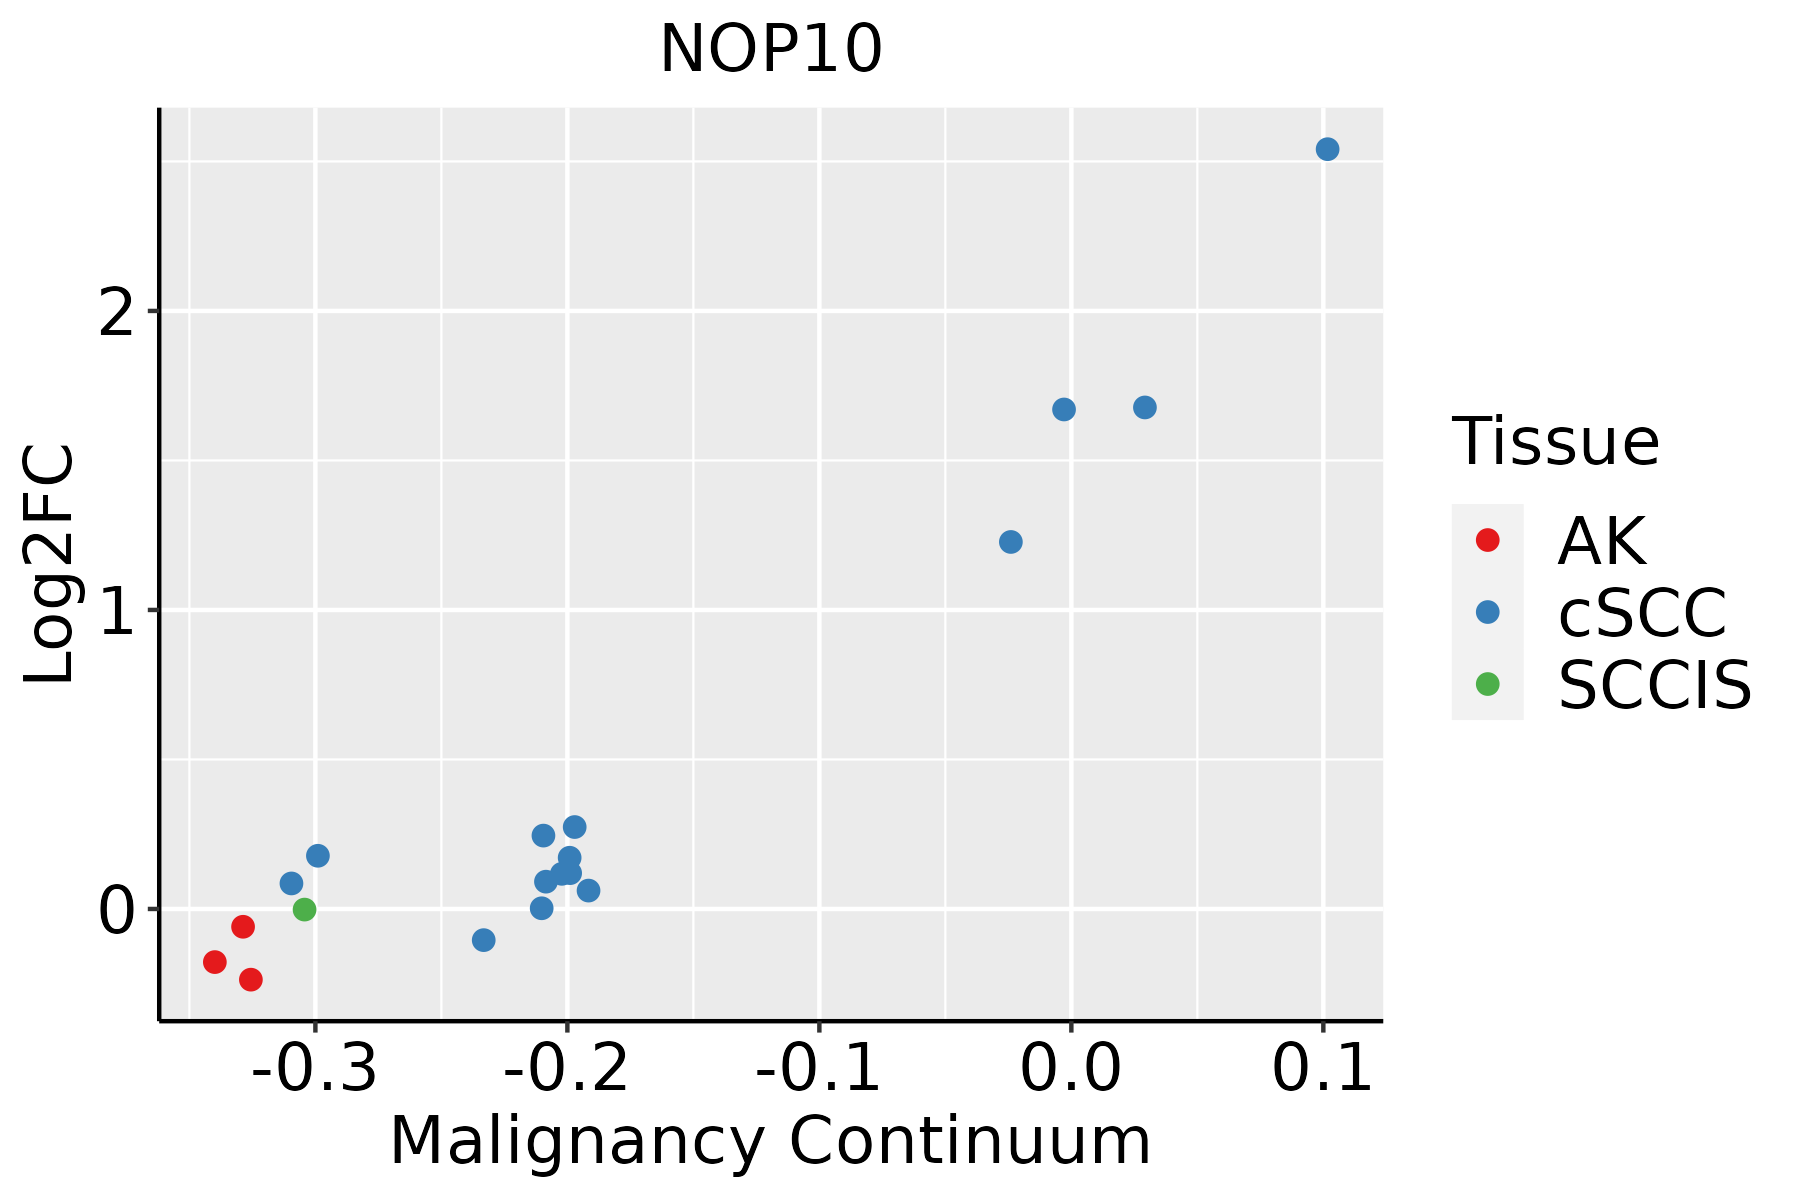 | AK: Actinic keratosis |
| cSCC: Cutaneous squamous cell carcinoma | ||
| SCCIS:squamous cell carcinoma in situ | ||
| Thyroid | 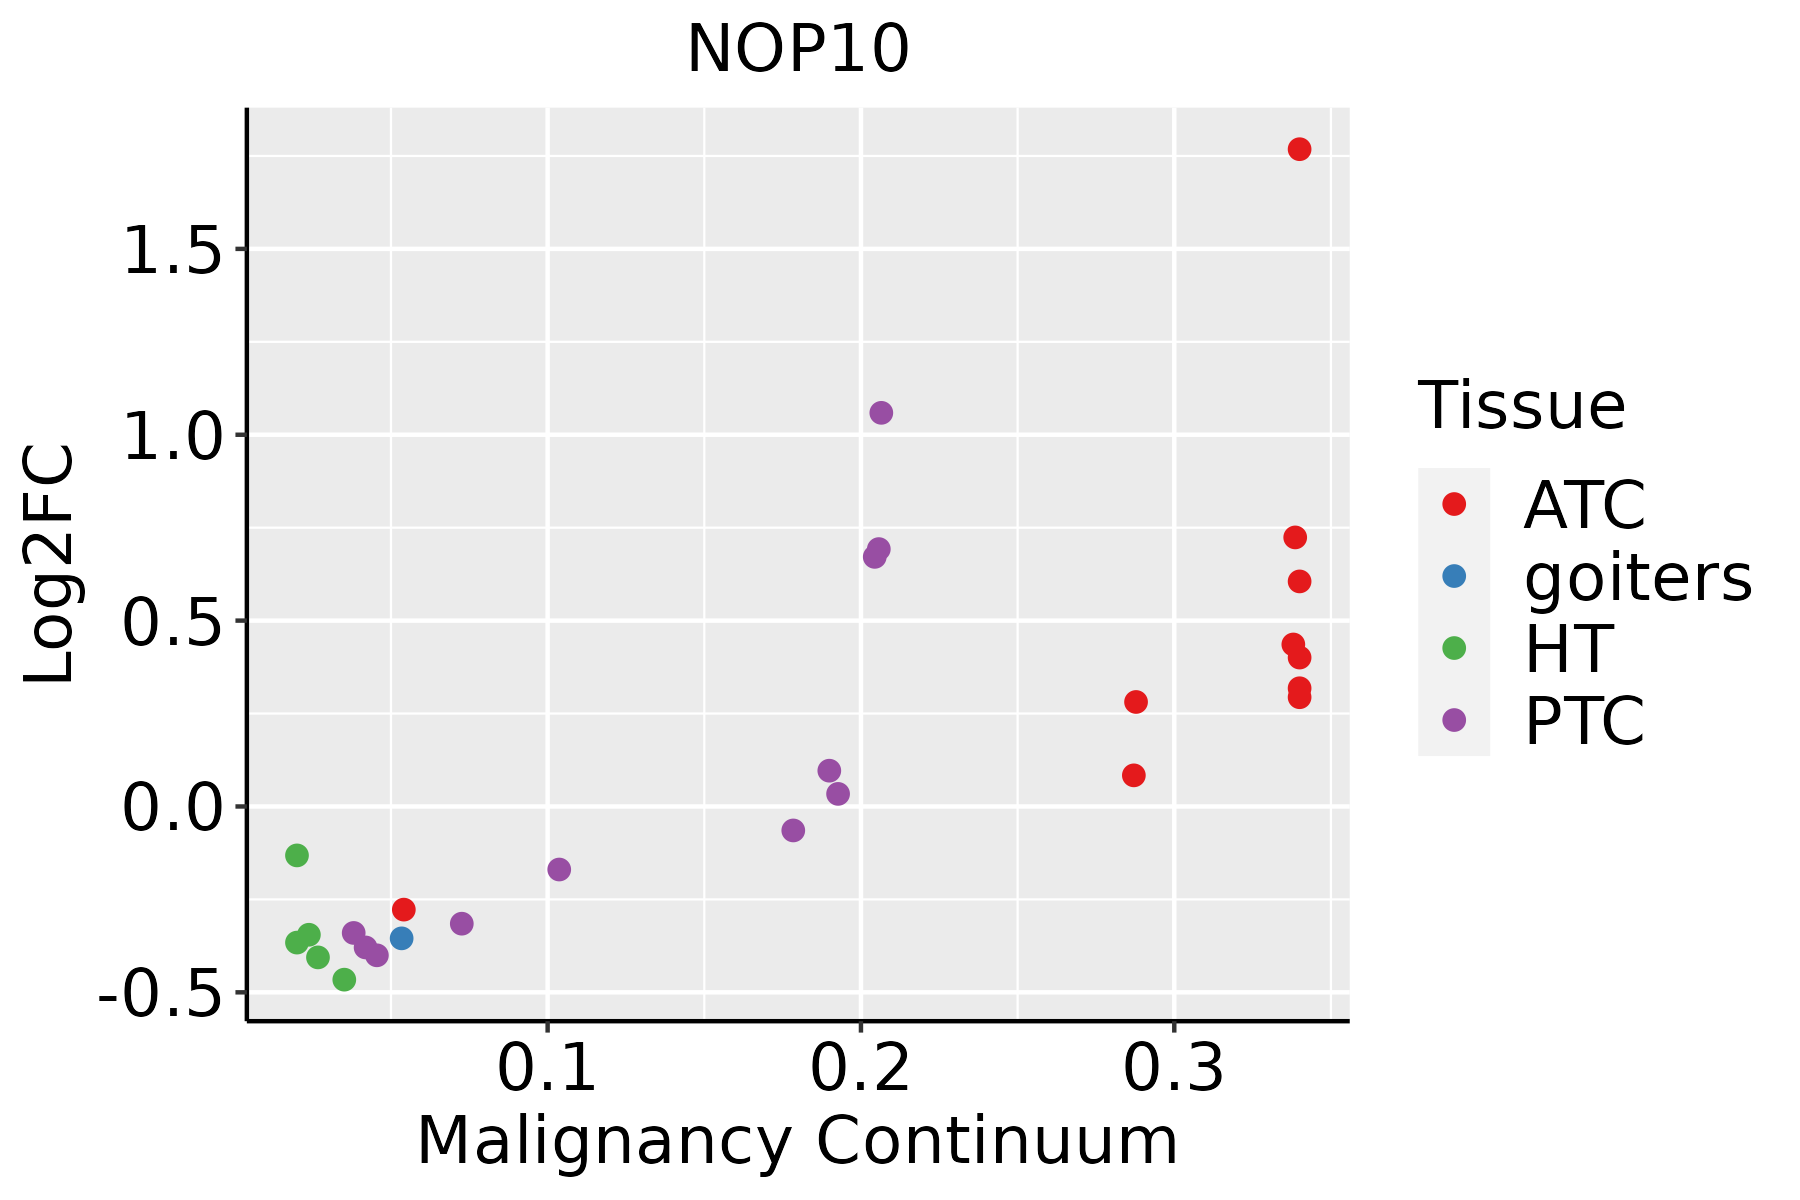 | ATC: Anaplastic thyroid cancer |
| HT: Hashimoto's thyroiditis | ||
| PTC: Papillary thyroid cancer |
| ∗log2FC in expression of this searched gene in stem-like cells from each diseased tissue sample relative to stem-like cells in normal samples in each tissue plotted against the malignancy continuum. Samples are colored based on if they are from different disease stage. |
Top |
Malignant transformation related pathway analysis |
| Find out the enriched GO biological processes and KEGG pathways involved in transition from healthy to precancer to cancer |
| Tissue | Disease Stage | Enriched GO biological Processes |
| Colorectum | AD |  |
| Colorectum | SER |  |
| Colorectum | MSS |  |
| Colorectum | MSI-H |  |
| Colorectum | FAP |  |
| ∗Top 15 enriched GO BP terms are showed in the bar plot of each disease state in each tissue. Each row represents a significant GO biological process which is colored according to the -log10(p.adjust). |
| Page: 1 2 3 4 5 6 7 8 9 |
| GO ID | Tissue | Disease Stage | Description | Gene Ratio | Bg Ratio | pvalue | p.adjust | Count |
| GO:002261310 | Cervix | CC | ribonucleoprotein complex biogenesis | 88/2311 | 463/18723 | 2.11e-05 | 3.82e-04 | 88 |
| GO:004225410 | Cervix | CC | ribosome biogenesis | 62/2311 | 299/18723 | 2.48e-05 | 4.27e-04 | 62 |
| GO:000640310 | Cervix | CC | RNA localization | 43/2311 | 201/18723 | 2.00e-04 | 2.29e-03 | 43 |
| GO:00160727 | Cervix | CC | rRNA metabolic process | 42/2311 | 236/18723 | 9.12e-03 | 4.60e-02 | 42 |
| GO:00007239 | Cervix | CC | telomere maintenance | 26/2311 | 131/18723 | 9.33e-03 | 4.66e-02 | 26 |
| GO:002261315 | Cervix | HSIL_HPV | ribonucleoprotein complex biogenesis | 52/737 | 463/18723 | 9.85e-12 | 6.81e-09 | 52 |
| GO:004225415 | Cervix | HSIL_HPV | ribosome biogenesis | 40/737 | 299/18723 | 1.25e-11 | 6.81e-09 | 40 |
| GO:00063647 | Cervix | HSIL_HPV | rRNA processing | 27/737 | 225/18723 | 2.67e-07 | 1.55e-05 | 27 |
| GO:001607215 | Cervix | HSIL_HPV | rRNA metabolic process | 27/737 | 236/18723 | 6.96e-07 | 3.57e-05 | 27 |
| GO:00344706 | Cervix | HSIL_HPV | ncRNA processing | 27/737 | 395/18723 | 4.01e-03 | 3.45e-02 | 27 |
| GO:0022613 | Colorectum | AD | ribonucleoprotein complex biogenesis | 151/3918 | 463/18723 | 1.96e-09 | 1.39e-07 | 151 |
| GO:0006403 | Colorectum | AD | RNA localization | 71/3918 | 201/18723 | 1.54e-06 | 4.76e-05 | 71 |
| GO:0000723 | Colorectum | AD | telomere maintenance | 43/3918 | 131/18723 | 9.77e-04 | 9.20e-03 | 43 |
| GO:0010833 | Colorectum | AD | telomere maintenance via telomere lengthening | 29/3918 | 81/18723 | 1.42e-03 | 1.22e-02 | 29 |
| GO:0071897 | Colorectum | AD | DNA biosynthetic process | 55/3918 | 180/18723 | 1.46e-03 | 1.24e-02 | 55 |
| GO:0042254 | Colorectum | AD | ribosome biogenesis | 84/3918 | 299/18723 | 1.82e-03 | 1.50e-02 | 84 |
| GO:0007004 | Colorectum | AD | telomere maintenance via telomerase | 25/3918 | 69/18723 | 2.43e-03 | 1.88e-02 | 25 |
| GO:0006278 | Colorectum | AD | RNA-dependent DNA biosynthetic process | 25/3918 | 75/18723 | 8.36e-03 | 4.89e-02 | 25 |
| GO:00226131 | Colorectum | SER | ribonucleoprotein complex biogenesis | 112/2897 | 463/18723 | 5.01e-07 | 2.48e-05 | 112 |
| GO:00064031 | Colorectum | SER | RNA localization | 53/2897 | 201/18723 | 4.51e-05 | 1.13e-03 | 53 |
| Page: 1 2 3 4 5 6 7 8 9 10 11 12 13 14 15 16 17 |
| Pathway ID | Tissue | Disease Stage | Description | Gene Ratio | Bg Ratio | pvalue | p.adjust | qvalue | Count |
| Page: 1 |
Top |
Cell-cell communication analysis |
| Identification of potential cell-cell interactions between two cell types and their ligand-receptor pairs for different disease states |
| Ligand | Receptor | LRpair | Pathway | Tissue | Disease Stage |
| Page: 1 |
Top |
Single-cell gene regulatory network inference analysis |
| Find out the significant the regulons (TFs) and the target genes of each regulon across cell types for different disease states |
| TF | Cell Type | Tissue | Disease Stage | Target Gene | RSS | Regulon Activity |
| ∗The dot plots of a searched regulon are shown for all cell subpopulations in each disease state of each tissue based on the regulon specific score inferred using pySCENIC and by calculating the average expression. |
| Page: 1 |
Top |
Somatic mutation of malignant transformation related genes |
| Annotation of somatic variants for genes involved in malignant transformation |
| Hugo Symbol | Variant Class | Variant Classification | dbSNP RS | HGVSc | HGVSp | HGVSp Short | SWISSPROT | BIOTYPE | SIFT | PolyPhen | Tumor Sample Barcode | Tissue | Histology | Sex | Age | Stage | Therapy Types | Drugs | Outcome |
| NOP10 | SNV | Missense_Mutation | c.24N>G | p.Asn8Lys | p.N8K | Q9NPE3 | protein_coding | tolerated(0.08) | benign(0.158) | TCGA-AR-A24H-01 | Breast | breast invasive carcinoma | Female | >=65 | I/II | Hormone Therapy | tamoxiphen | SD | |
| NOP10 | SNV | Missense_Mutation | c.157A>G | p.Lys53Glu | p.K53E | Q9NPE3 | protein_coding | deleterious(0.01) | benign(0.067) | TCGA-DD-AACY-01 | Liver | liver hepatocellular carcinoma | Male | <65 | I/II | Unknown | Unknown | PD | |
| NOP10 | SNV | Missense_Mutation | novel | c.12N>T | p.Gln4His | p.Q4H | Q9NPE3 | protein_coding | deleterious(0.04) | benign(0.001) | TCGA-DD-AAW3-01 | Liver | liver hepatocellular carcinoma | Male | >=65 | I/II | Unknown | Unknown | SD |
| NOP10 | SNV | Missense_Mutation | novel | c.173A>T | p.Gln58Leu | p.Q58L | Q9NPE3 | protein_coding | deleterious(0) | probably_damaging(0.987) | TCGA-MN-A4N4-01 | Lung | lung adenocarcinoma | Male | <65 | I/II | Unknown | Unknown | SD |
| NOP10 | SNV | Missense_Mutation | c.152N>C | p.Arg51Pro | p.R51P | Q9NPE3 | protein_coding | deleterious(0.02) | possibly_damaging(0.726) | TCGA-34-5232-01 | Lung | lung squamous cell carcinoma | Female | >=65 | I/II | Unknown | Unknown | SD |
| Page: 1 |
Top |
Related drugs of malignant transformation related genes |
| Identification of chemicals and drugs interact with genes involved in malignant transfromation |
| (DGIdb 4.0) |
| Entrez ID | Symbol | Category | Interaction Types | Drug Claim Name | Drug Name | PMIDs |
| Page: 1 |

Copyright 2023-Present -The University of Texas Health Science Center at Houston |