
|
|||||
|
 | |
| |
| |
| |
| |
| |
|
Gene: NOM1 |
Gene summary for NOM1 |
| Gene information | Species | Human | Gene symbol | NOM1 | Gene ID | 64434 |
| Gene name | nucleolar protein with MIF4G domain 1 | |
| Gene Alias | C7orf3 | |
| Cytomap | 7q36.3 | |
| Gene Type | protein-coding | GO ID | GO:0001942 | UniProtAcc | Q5C9Z4 |
Top |
Malignant transformation analysis |
| Identification of the aberrant gene expression in precancerous and cancerous lesions by comparing the gene expression of stem-like cells in diseased tissues with normal stem cells |
| Entrez ID | Symbol | Replicates | Species | Organ | Tissue | Adj P-value | Log2FC | Malignancy |
| 64434 | NOM1 | LZE7T | Human | Esophagus | ESCC | 3.28e-07 | 2.56e-01 | 0.0667 |
| 64434 | NOM1 | LZE22T | Human | Esophagus | ESCC | 7.56e-03 | 1.44e-01 | 0.068 |
| 64434 | NOM1 | LZE24T | Human | Esophagus | ESCC | 1.97e-09 | 1.27e-01 | 0.0596 |
| 64434 | NOM1 | LZE21T | Human | Esophagus | ESCC | 1.70e-05 | 1.75e-01 | 0.0655 |
| 64434 | NOM1 | P1T-E | Human | Esophagus | ESCC | 1.15e-05 | 2.35e-01 | 0.0875 |
| 64434 | NOM1 | P2T-E | Human | Esophagus | ESCC | 2.45e-08 | 2.47e-01 | 0.1177 |
| 64434 | NOM1 | P4T-E | Human | Esophagus | ESCC | 4.68e-18 | 3.92e-01 | 0.1323 |
| 64434 | NOM1 | P5T-E | Human | Esophagus | ESCC | 5.60e-26 | 5.38e-01 | 0.1327 |
| 64434 | NOM1 | P8T-E | Human | Esophagus | ESCC | 8.50e-10 | 9.41e-02 | 0.0889 |
| 64434 | NOM1 | P9T-E | Human | Esophagus | ESCC | 2.18e-12 | 1.49e-01 | 0.1131 |
| 64434 | NOM1 | P10T-E | Human | Esophagus | ESCC | 2.45e-13 | 3.41e-01 | 0.116 |
| 64434 | NOM1 | P11T-E | Human | Esophagus | ESCC | 3.62e-04 | 8.37e-02 | 0.1426 |
| 64434 | NOM1 | P12T-E | Human | Esophagus | ESCC | 3.40e-19 | 2.05e-01 | 0.1122 |
| 64434 | NOM1 | P15T-E | Human | Esophagus | ESCC | 3.57e-29 | 4.87e-01 | 0.1149 |
| 64434 | NOM1 | P16T-E | Human | Esophagus | ESCC | 5.46e-16 | 2.22e-01 | 0.1153 |
| 64434 | NOM1 | P20T-E | Human | Esophagus | ESCC | 8.85e-12 | 9.91e-02 | 0.1124 |
| 64434 | NOM1 | P21T-E | Human | Esophagus | ESCC | 1.04e-09 | 1.40e-01 | 0.1617 |
| 64434 | NOM1 | P22T-E | Human | Esophagus | ESCC | 8.45e-03 | 3.23e-02 | 0.1236 |
| 64434 | NOM1 | P23T-E | Human | Esophagus | ESCC | 2.36e-09 | 2.05e-01 | 0.108 |
| 64434 | NOM1 | P24T-E | Human | Esophagus | ESCC | 1.52e-15 | 2.97e-01 | 0.1287 |
| Page: 1 2 3 4 5 |
| Tissue | Expression Dynamics | Abbreviation |
| Esophagus | 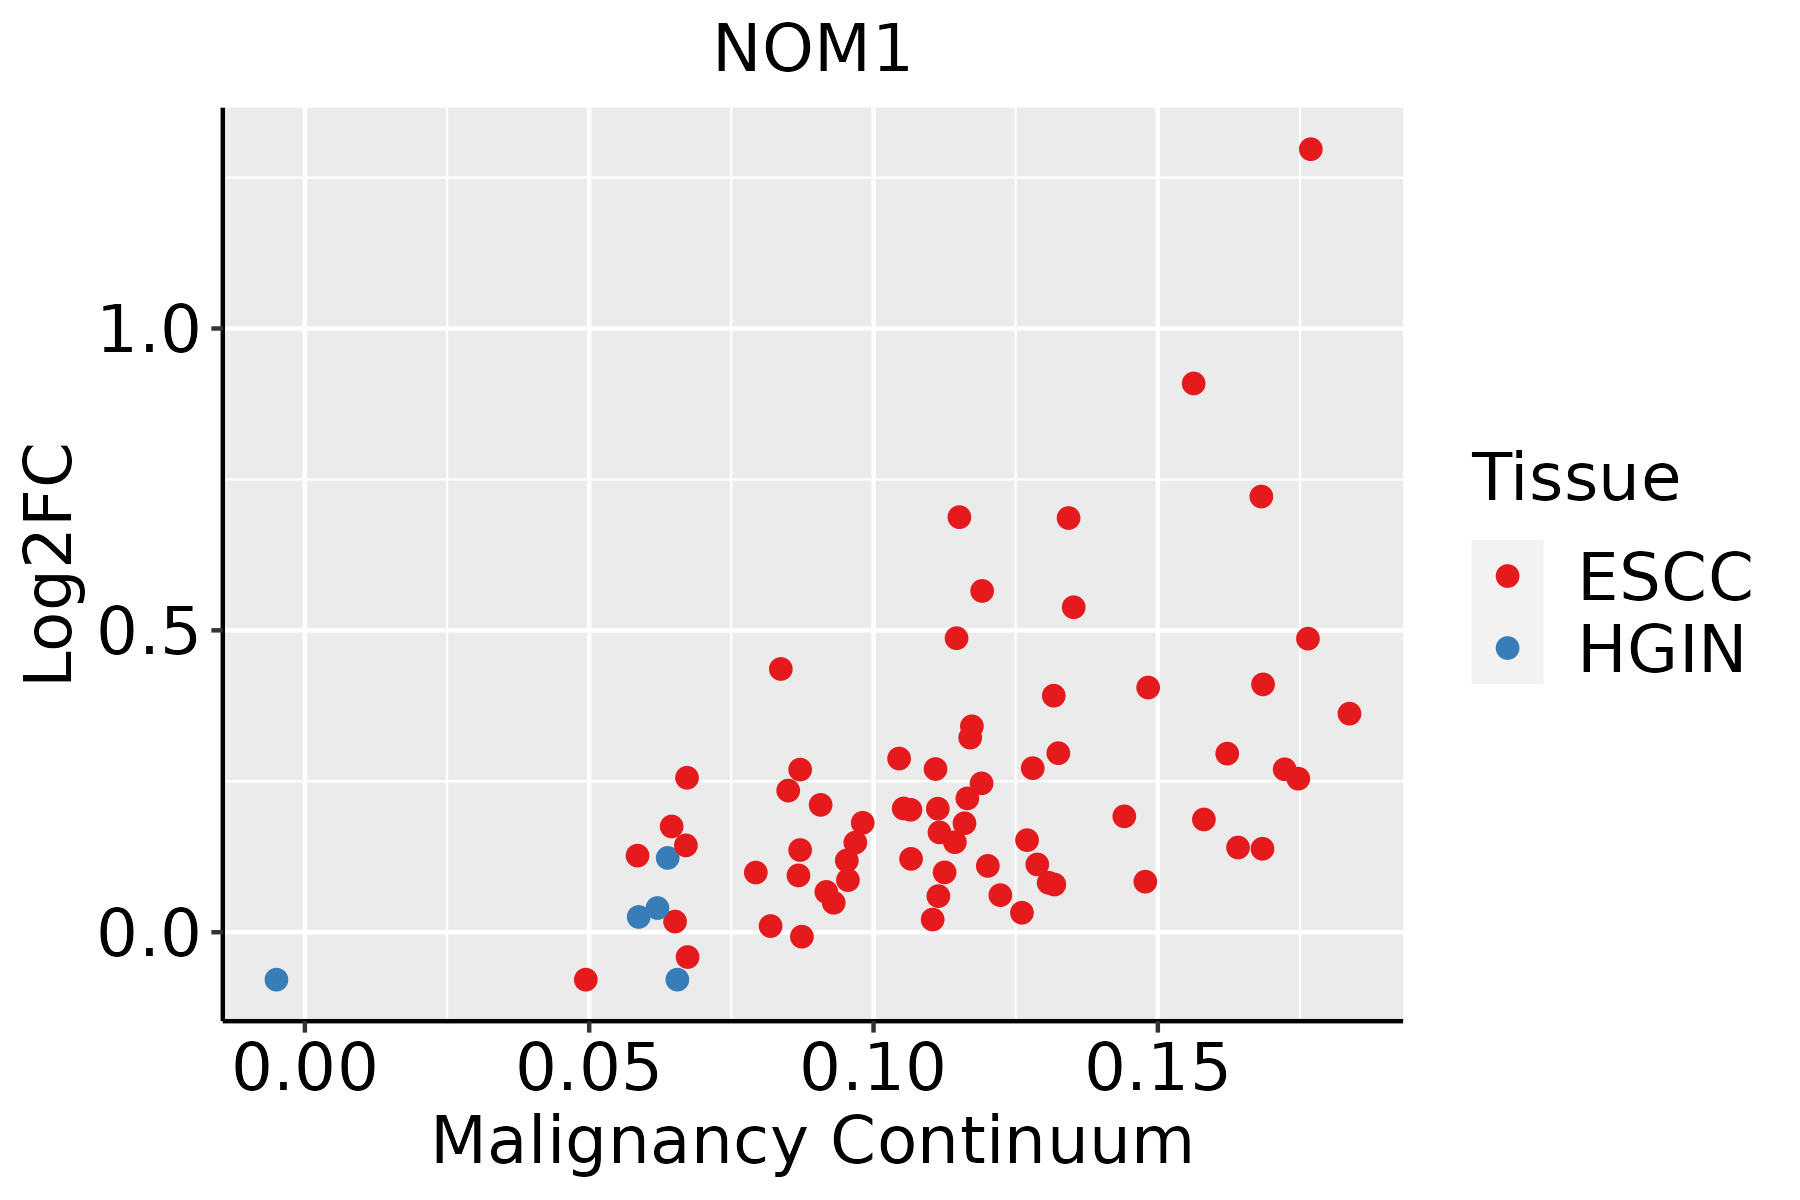 | ESCC: Esophageal squamous cell carcinoma |
| HGIN: High-grade intraepithelial neoplasias | ||
| LGIN: Low-grade intraepithelial neoplasias | ||
| Liver | 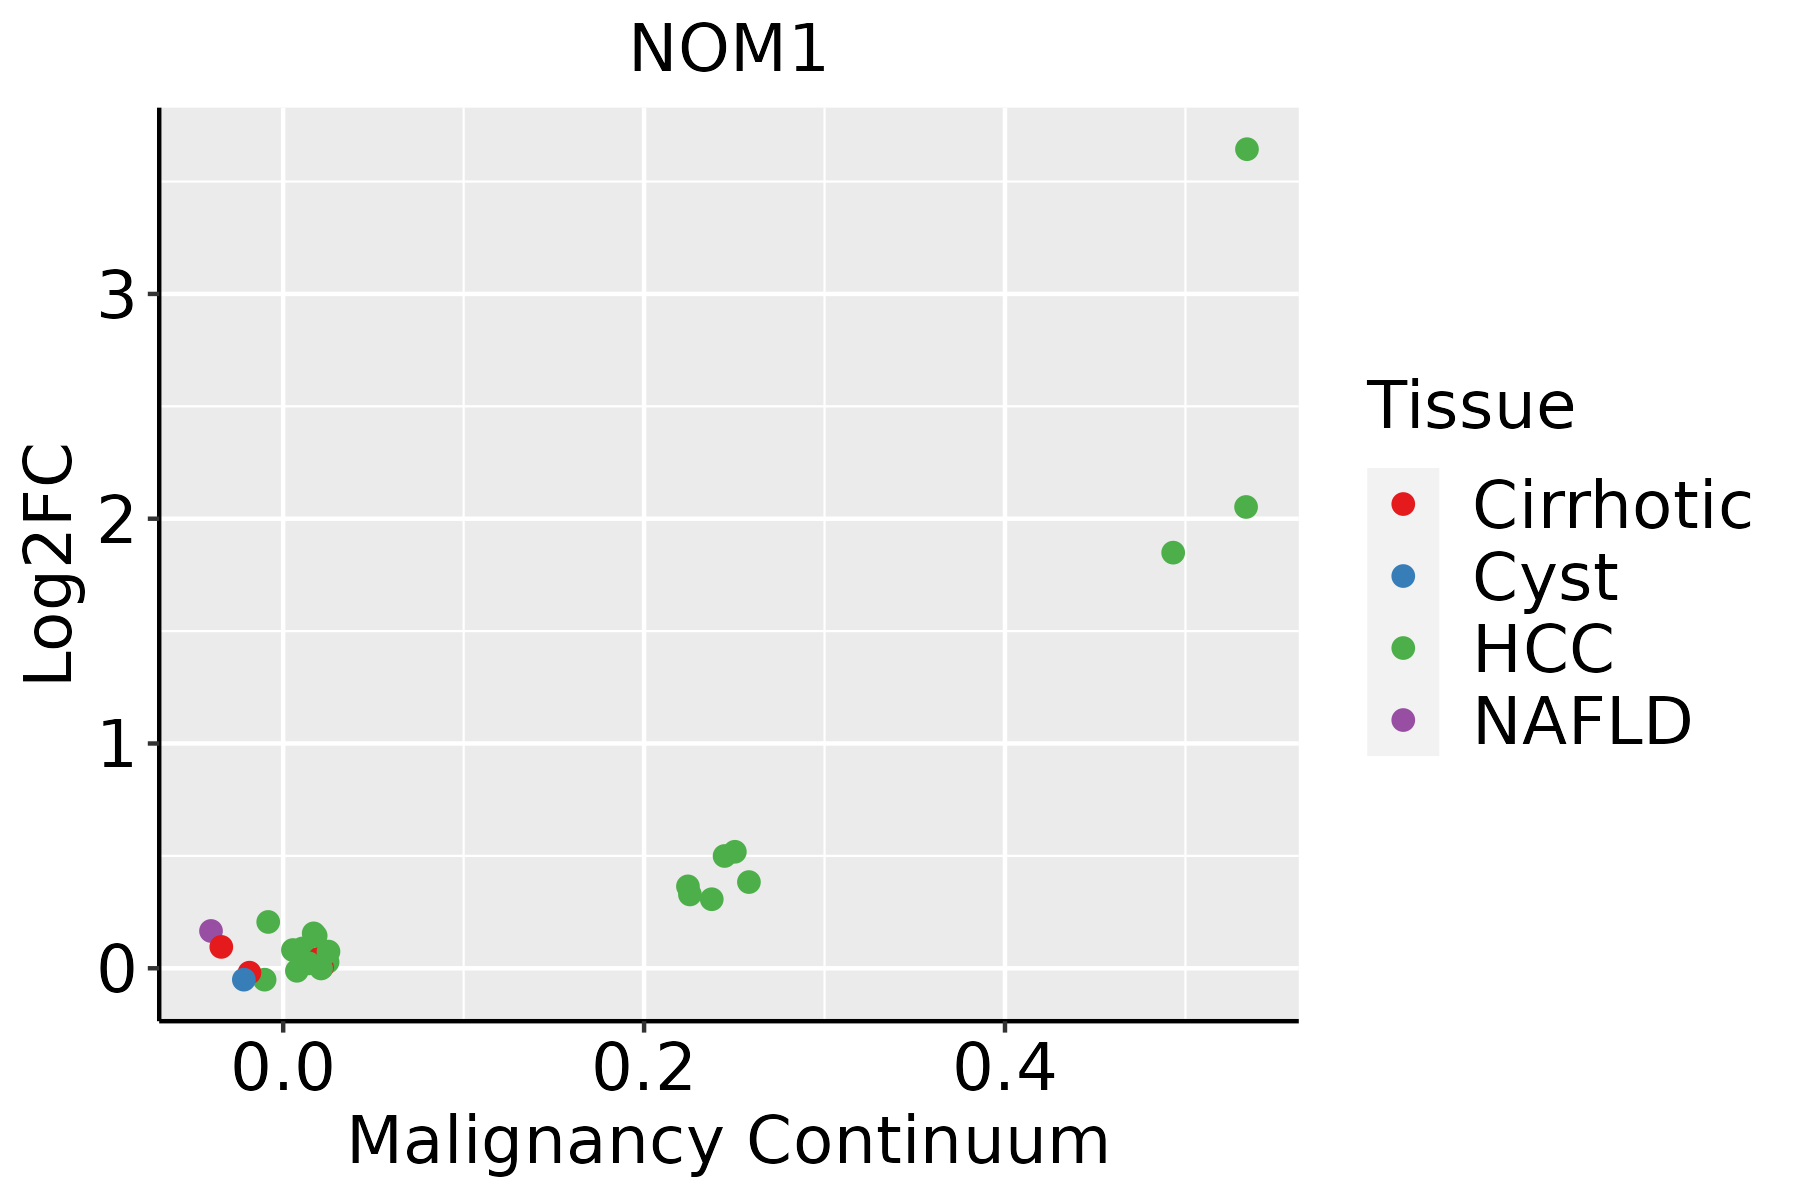 | HCC: Hepatocellular carcinoma |
| NAFLD: Non-alcoholic fatty liver disease | ||
| Oral Cavity |  | EOLP: Erosive Oral lichen planus |
| LP: leukoplakia | ||
| NEOLP: Non-erosive oral lichen planus | ||
| OSCC: Oral squamous cell carcinoma | ||
| Thyroid |  | ATC: Anaplastic thyroid cancer |
| HT: Hashimoto's thyroiditis | ||
| PTC: Papillary thyroid cancer |
| ∗log2FC in expression of this searched gene in stem-like cells from each diseased tissue sample relative to stem-like cells in normal samples in each tissue plotted against the malignancy continuum. Samples are colored based on if they are from different disease stage. |
Top |
Malignant transformation related pathway analysis |
| Find out the enriched GO biological processes and KEGG pathways involved in transition from healthy to precancer to cancer |
| Tissue | Disease Stage | Enriched GO biological Processes |
| Colorectum | AD |  |
| Colorectum | SER |  |
| Colorectum | MSS |  |
| Colorectum | MSI-H |  |
| Colorectum | FAP |  |
| ∗Top 15 enriched GO BP terms are showed in the bar plot of each disease state in each tissue. Each row represents a significant GO biological process which is colored according to the -log10(p.adjust). |
| Page: 1 2 3 4 5 6 7 8 9 |
| GO ID | Tissue | Disease Stage | Description | Gene Ratio | Bg Ratio | pvalue | p.adjust | Count |
| GO:0022613111 | Esophagus | ESCC | ribonucleoprotein complex biogenesis | 365/8552 | 463/18723 | 1.74e-49 | 1.11e-45 | 365 |
| GO:0042254111 | Esophagus | ESCC | ribosome biogenesis | 252/8552 | 299/18723 | 3.27e-44 | 1.04e-40 | 252 |
| GO:0042274111 | Esophagus | ESCC | ribosomal small subunit biogenesis | 67/8552 | 73/18723 | 6.62e-17 | 5.38e-15 | 67 |
| GO:00435888 | Esophagus | ESCC | skin development | 163/8552 | 263/18723 | 6.48e-08 | 1.14e-06 | 163 |
| GO:000854410 | Esophagus | ESCC | epidermis development | 193/8552 | 324/18723 | 2.87e-07 | 4.19e-06 | 193 |
| GO:00224043 | Esophagus | ESCC | molting cycle process | 53/8552 | 84/18723 | 9.62e-04 | 4.88e-03 | 53 |
| GO:00224053 | Esophagus | ESCC | hair cycle process | 53/8552 | 84/18723 | 9.62e-04 | 4.88e-03 | 53 |
| GO:0001942 | Esophagus | ESCC | hair follicle development | 51/8552 | 81/18723 | 1.27e-03 | 6.14e-03 | 51 |
| GO:0098773 | Esophagus | ESCC | skin epidermis development | 53/8552 | 85/18723 | 1.43e-03 | 6.77e-03 | 53 |
| GO:00423033 | Esophagus | ESCC | molting cycle | 64/8552 | 107/18723 | 2.24e-03 | 9.85e-03 | 64 |
| GO:00426333 | Esophagus | ESCC | hair cycle | 64/8552 | 107/18723 | 2.24e-03 | 9.85e-03 | 64 |
| GO:00488201 | Esophagus | ESCC | hair follicle maturation | 11/8552 | 13/18723 | 4.76e-03 | 1.85e-02 | 11 |
| GO:002261322 | Liver | HCC | ribonucleoprotein complex biogenesis | 355/7958 | 463/18723 | 7.76e-52 | 4.92e-48 | 355 |
| GO:004225422 | Liver | HCC | ribosome biogenesis | 246/7958 | 299/18723 | 4.99e-46 | 1.58e-42 | 246 |
| GO:004227422 | Liver | HCC | ribosomal small subunit biogenesis | 65/7958 | 73/18723 | 1.09e-16 | 9.92e-15 | 65 |
| GO:002261320 | Oral cavity | OSCC | ribonucleoprotein complex biogenesis | 333/7305 | 463/18723 | 8.28e-48 | 5.24e-44 | 333 |
| GO:004225420 | Oral cavity | OSCC | ribosome biogenesis | 230/7305 | 299/18723 | 3.22e-41 | 6.80e-38 | 230 |
| GO:004227420 | Oral cavity | OSCC | ribosomal small subunit biogenesis | 63/7305 | 73/18723 | 7.61e-17 | 6.34e-15 | 63 |
| GO:00435887 | Oral cavity | OSCC | skin development | 143/7305 | 263/18723 | 2.77e-07 | 4.27e-06 | 143 |
| GO:00085449 | Oral cavity | OSCC | epidermis development | 171/7305 | 324/18723 | 2.89e-07 | 4.43e-06 | 171 |
| Page: 1 2 |
| Pathway ID | Tissue | Disease Stage | Description | Gene Ratio | Bg Ratio | pvalue | p.adjust | qvalue | Count |
| Page: 1 |
Top |
Cell-cell communication analysis |
| Identification of potential cell-cell interactions between two cell types and their ligand-receptor pairs for different disease states |
| Ligand | Receptor | LRpair | Pathway | Tissue | Disease Stage |
| Page: 1 |
Top |
Single-cell gene regulatory network inference analysis |
| Find out the significant the regulons (TFs) and the target genes of each regulon across cell types for different disease states |
| TF | Cell Type | Tissue | Disease Stage | Target Gene | RSS | Regulon Activity |
| ∗The dot plots of a searched regulon are shown for all cell subpopulations in each disease state of each tissue based on the regulon specific score inferred using pySCENIC and by calculating the average expression. |
| Page: 1 |
Top |
Somatic mutation of malignant transformation related genes |
| Annotation of somatic variants for genes involved in malignant transformation |
| Hugo Symbol | Variant Class | Variant Classification | dbSNP RS | HGVSc | HGVSp | HGVSp Short | SWISSPROT | BIOTYPE | SIFT | PolyPhen | Tumor Sample Barcode | Tissue | Histology | Sex | Age | Stage | Therapy Types | Drugs | Outcome |
| NOM1 | SNV | Missense_Mutation | novel | c.539A>G | p.Glu180Gly | p.E180G | Q5C9Z4 | protein_coding | deleterious(0.02) | probably_damaging(0.973) | TCGA-BH-A0HF-01 | Breast | breast invasive carcinoma | Female | >=65 | I/II | Hormone Therapy | arimidex | SD |
| NOM1 | SNV | Missense_Mutation | rs371030013 | c.2047G>A | p.Asp683Asn | p.D683N | Q5C9Z4 | protein_coding | tolerated(0.2) | benign(0.268) | TCGA-BH-A0HF-01 | Breast | breast invasive carcinoma | Female | >=65 | I/II | Hormone Therapy | arimidex | SD |
| NOM1 | insertion | Frame_Shift_Ins | novel | c.1240_1241insAGTGCTGGGATTACCGACATGAGCCACCG | p.Met414LysfsTer15 | p.M414Kfs*15 | Q5C9Z4 | protein_coding | TCGA-A2-A0CP-01 | Breast | breast invasive carcinoma | Female | <65 | I/II | Chemotherapy | cytoxan | SD | ||
| NOM1 | insertion | Frame_Shift_Ins | novel | c.1133_1134insG | p.Ser379PhefsTer20 | p.S379Ffs*20 | Q5C9Z4 | protein_coding | TCGA-BH-A0B1-01 | Breast | breast invasive carcinoma | Female | >=65 | I/II | Chemotherapy | adriamycin | SD | ||
| NOM1 | insertion | In_Frame_Ins | novel | c.1134_1135insGGAATTGCCTGCATTTCCTTC | p.Ala378_Ser379insGlyIleAlaCysIleSerPhe | p.A378_S379insGIACISF | Q5C9Z4 | protein_coding | TCGA-BH-A0B1-01 | Breast | breast invasive carcinoma | Female | >=65 | I/II | Chemotherapy | adriamycin | SD | ||
| NOM1 | SNV | Missense_Mutation | c.1899N>C | p.Gln633His | p.Q633H | Q5C9Z4 | protein_coding | tolerated(0.16) | benign(0.022) | TCGA-DS-A1OC-01 | Cervix | cervical & endocervical cancer | Female | <65 | I/II | Chemotherapy | gemcitabine | SD | |
| NOM1 | SNV | Missense_Mutation | c.1815G>C | p.Gln605His | p.Q605H | Q5C9Z4 | protein_coding | deleterious(0.03) | benign(0.009) | TCGA-Q1-A73O-01 | Cervix | cervical & endocervical cancer | Female | <65 | I/II | Chemotherapy | cisplatin | CR | |
| NOM1 | SNV | Missense_Mutation | c.2157G>C | p.Arg719Ser | p.R719S | Q5C9Z4 | protein_coding | deleterious(0) | probably_damaging(1) | TCGA-Q1-A73O-01 | Cervix | cervical & endocervical cancer | Female | <65 | I/II | Chemotherapy | cisplatin | CR | |
| NOM1 | insertion | Nonsense_Mutation | novel | c.1726_1727insCAGCCTTTAGGT | p.Lys576delinsThrAlaPheArgTer | p.K576delinsTAFR* | Q5C9Z4 | protein_coding | TCGA-DS-A1OD-01 | Cervix | cervical & endocervical cancer | Female | <65 | I/II | Chemotherapy | cisplatin | SD | ||
| NOM1 | SNV | Missense_Mutation | c.2116N>C | p.Phe706Leu | p.F706L | Q5C9Z4 | protein_coding | deleterious(0.02) | benign(0.194) | TCGA-A6-2672-01 | Colorectum | colon adenocarcinoma | Female | >=65 | III/IV | Unknown | Unknown | SD |
| Page: 1 2 3 4 5 6 7 8 9 |
Top |
Related drugs of malignant transformation related genes |
| Identification of chemicals and drugs interact with genes involved in malignant transfromation |
| (DGIdb 4.0) |
| Entrez ID | Symbol | Category | Interaction Types | Drug Claim Name | Drug Name | PMIDs |
| Page: 1 |

Copyright 2023-Present -The University of Texas Health Science Center at Houston |