Schematic overview of the cellular and molecular mechanisms involved in the cancer progression, including the proposed cellular and molecular mechanisms in cancer cells trajectory. AT1: alveolar type 1 cells; AT2: alveolar type 2 cells; AAH: atypical adenomatous hyperplasia; AIS: adenocarcinoma in situ; MIA: minimally invasive adenocarcinoma; IA: invasive adenocarcinoma; EMT: epithelial-mesenchymal transition

Home

Download

Statistics

Help

Contact

Center for Computational Systems Medicine
leaf

Gene summary

leaf

Malignant transformation analysis

leaf

Malignant transformation related pathway analysis

leaf

Cell-cell communication analysis

leaf

Single-cell gene regulatory network inference analysis

leaf

Somatic mutation of malignant transformation related genes

leaf

Related drugs of malignant transformation related genes

Gene: NOLC1

Gene summary for NOLC1

check button Gene summary.

Gene informationSpeciesHuman
Gene symbol

NOLC1

Gene ID

9221

Gene namenucleolar and coiled-body phosphoprotein 1
Gene AliasNOPP130
Cytomap10q24.32
Gene Typeprotein-coding
GO ID

GO:0000278

UniProtAcc

B2RAU8


Top

Malignant transformation analysis

check button Identification of the aberrant gene expression in precancerous and cancerous lesions by comparing the gene expression of stem-like cells in diseased tissues with normal stem cells
check button Malignant transformation involving gene list.
Entrez IDSymbolReplicatesSpeciesOrganTissueAdj P-valueLog2FCMalignancy
9221NOLC1HTA11_3410_2000001011HumanColorectumAD1.97e-032.45e-010.0155
9221NOLC1HTA11_1938_2000001011HumanColorectumAD7.23e-065.40e-01-0.0811
9221NOLC1HTA11_347_2000001011HumanColorectumAD1.37e-052.91e-01-0.1954
9221NOLC1HTA11_1391_2000001011HumanColorectumAD5.76e-095.92e-01-0.059
9221NOLC1HTA11_866_3004761011HumanColorectumAD3.84e-095.06e-010.096
9221NOLC1HTA11_10623_2000001011HumanColorectumAD8.90e-032.52e-01-0.0177
9221NOLC1HTA11_7696_3000711011HumanColorectumAD1.88e-033.47e-010.0674
9221NOLC1HTA11_99999970781_79442HumanColorectumMSS1.60e-217.21e-010.294
9221NOLC1HTA11_99999965104_69814HumanColorectumMSS2.80e-064.54e-010.281
9221NOLC1HTA11_99999971662_82457HumanColorectumMSS5.18e-238.30e-010.3859
9221NOLC1HTA11_99999973899_84307HumanColorectumMSS9.29e-034.84e-010.2585
9221NOLC1HTA11_99999974143_84620HumanColorectumMSS1.07e-033.29e-010.3005
9221NOLC1LZE2DHumanEsophagusHGIN1.63e-03-3.18e-010.0642
9221NOLC1LZE2THumanEsophagusESCC4.03e-022.90e-010.082
9221NOLC1LZE4THumanEsophagusESCC3.93e-076.95e-020.0811
9221NOLC1LZE20THumanEsophagusESCC2.02e-03-2.50e-010.0662
9221NOLC1LZE22D1HumanEsophagusHGIN2.54e-03-5.36e-010.0595
9221NOLC1LZE22THumanEsophagusESCC6.52e-051.23e-020.068
9221NOLC1LZE24THumanEsophagusESCC5.92e-117.81e-010.0596
9221NOLC1LZE6THumanEsophagusESCC3.72e-11-2.71e-010.0845
Page: 1 2 3 4 5 6 

check button Transcriptomic changes along malignancy continuum.
TissueExpression DynamicsAbbreviation
Colorectum (GSE201348)The image shows the transcriptomic changes along malignancy continuum.log2FC in expression of this searched gene in stem-like cells from each diseased tissue sample relative to stem-like cells in normal samples in each tissue plotted against the malignancy continuum. Samples are colored based on if they are from different disease stage.FAP: Familial adenomatous polyposis
CRC: Colorectal cancer
Colorectum (HTA11)The image shows the transcriptomic changes along malignancy continuum.log2FC in expression of this searched gene in stem-like cells from each diseased tissue sample relative to stem-like cells in normal samples in each tissue plotted against the malignancy continuum. Samples are colored based on if they are from different disease stage.AD: Adenomas
SER: Sessile serrated lesions
MSI-H: Microsatellite-high colorectal cancer
MSS: Microsatellite stable colorectal cancer
EsophagusThe image shows the transcriptomic changes along malignancy continuum.log2FC in expression of this searched gene in stem-like cells from each diseased tissue sample relative to stem-like cells in normal samples in each tissue plotted against the malignancy continuum. Samples are colored based on if they are from different disease stage.ESCC: Esophageal squamous cell carcinoma
HGIN: High-grade intraepithelial neoplasias
LGIN: Low-grade intraepithelial neoplasias
LiverThe image shows the transcriptomic changes along malignancy continuum.log2FC in expression of this searched gene in stem-like cells from each diseased tissue sample relative to stem-like cells in normal samples in each tissue plotted against the malignancy continuum. Samples are colored based on if they are from different disease stage.HCC: Hepatocellular carcinoma
NAFLD: Non-alcoholic fatty liver disease
Oral CavityThe image shows the transcriptomic changes along malignancy continuum.log2FC in expression of this searched gene in stem-like cells from each diseased tissue sample relative to stem-like cells in normal samples in each tissue plotted against the malignancy continuum. Samples are colored based on if they are from different disease stage.
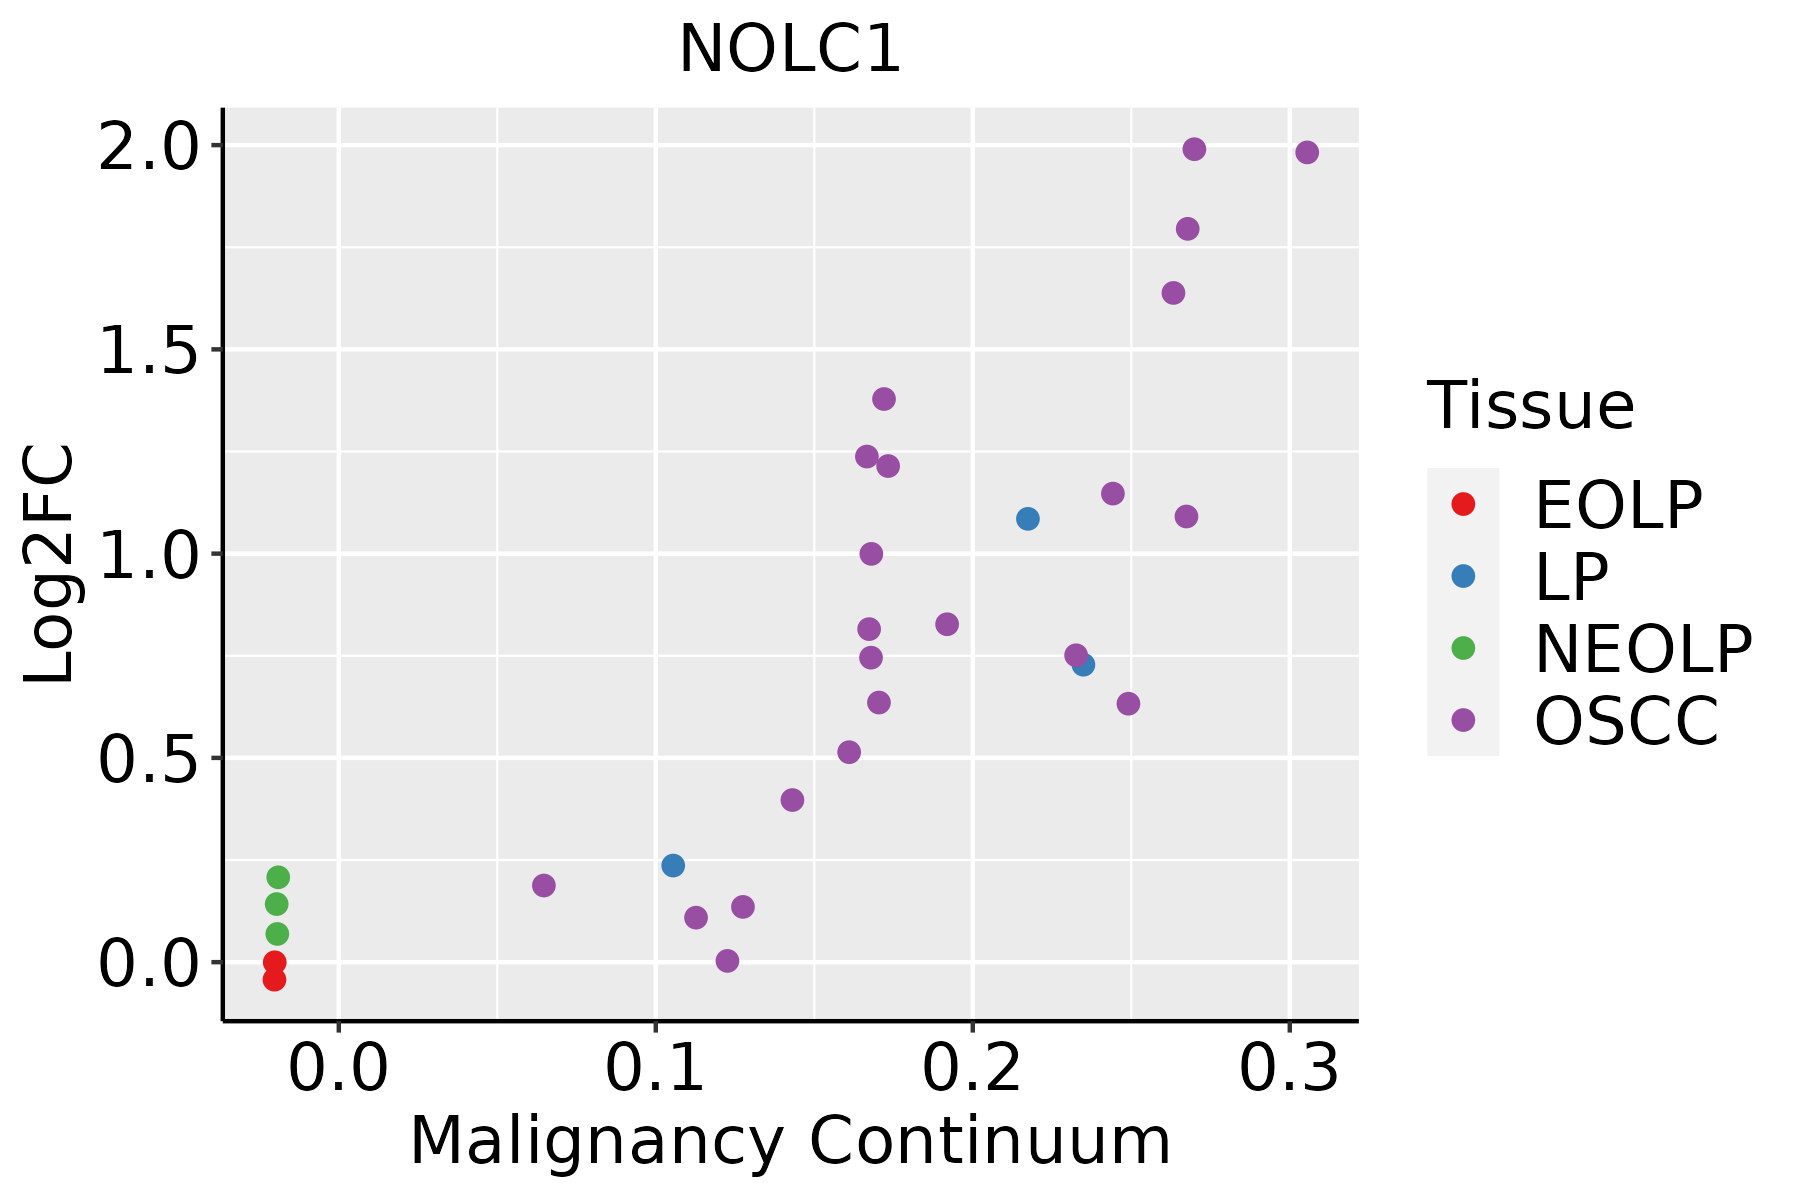
EOLP: Erosive Oral lichen planus
LP: leukoplakia
NEOLP: Non-erosive oral lichen planus
OSCC: Oral squamous cell carcinoma
ProstateThe image shows the transcriptomic changes along malignancy continuum.log2FC in expression of this searched gene in stem-like cells from each diseased tissue sample relative to stem-like cells in normal samples in each tissue plotted against the malignancy continuum. Samples are colored based on if they are from different disease stage.BPH: Benign Prostatic Hyperplasia
SkinThe image shows the transcriptomic changes along malignancy continuum.log2FC in expression of this searched gene in stem-like cells from each diseased tissue sample relative to stem-like cells in normal samples in each tissue plotted against the malignancy continuum. Samples are colored based on if they are from different disease stage.
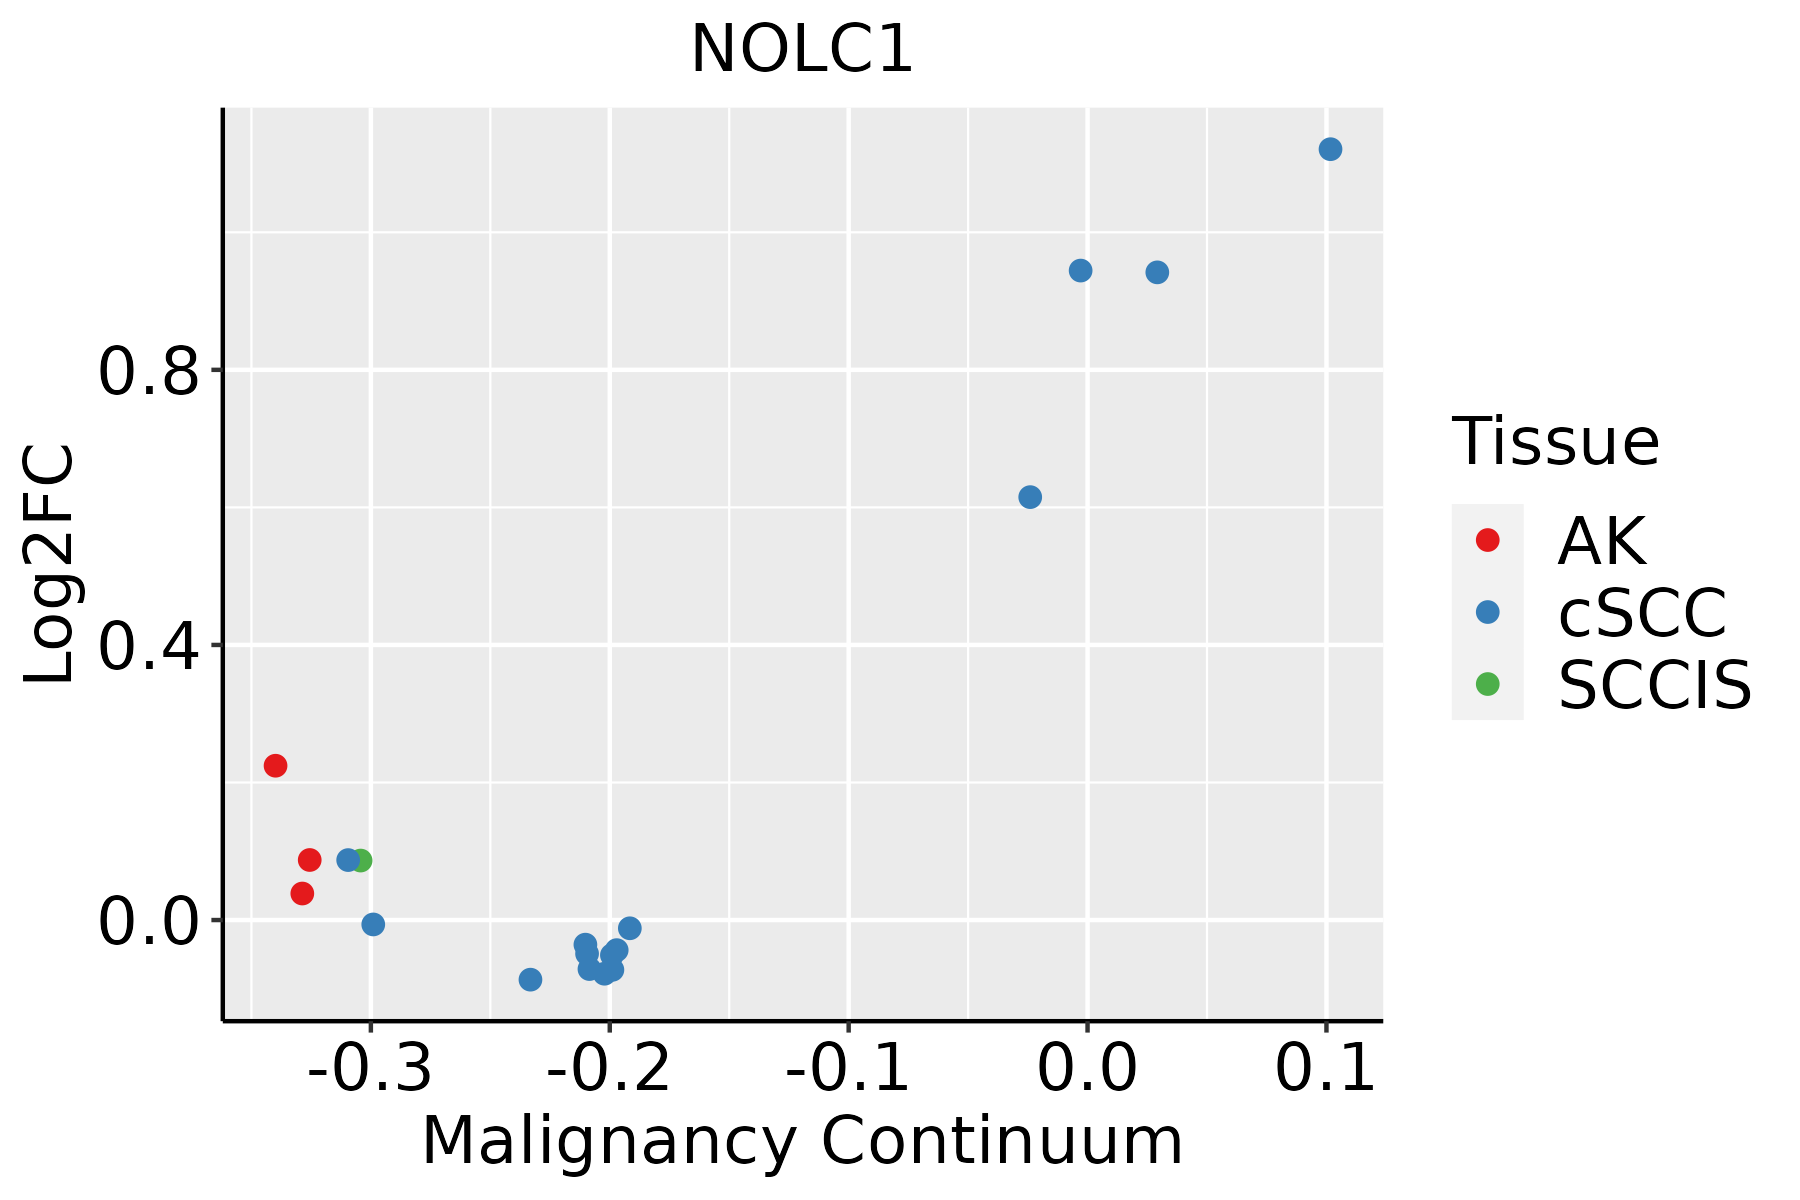
AK: Actinic keratosis
cSCC: Cutaneous squamous cell carcinoma
SCCIS:squamous cell carcinoma in situ
∗log2FC in expression of this searched gene in stem-like cells from each diseased tissue sample relative to stem-like cells in normal samples in each tissue plotted against the malignancy continuum. Samples are colored based on if they are from different disease stage.

Top

Malignant transformation related pathway analysis

check buttonFind out the enriched GO biological processes and KEGG pathways involved in transition from healthy to precancer to cancer
check button Figure of enriched GO biological processes.
TissueDisease StageEnriched GO biological Processes
ColorectumADGO analysis - Figure of enriched GO biological processes: Top 15 enriched GO BP terms are showed in the bar plot of each disease state in each tissue. Each row represents a significant GO biological process which is colored according to the -log10(p.adjust).
ColorectumSERGO analysis - Figure of enriched GO biological processes: Top 15 enriched GO BP terms are showed in the bar plot of each disease state in each tissue. Each row represents a significant GO biological process which is colored according to the -log10(p.adjust).
ColorectumMSSGO analysis - Figure of enriched GO biological processes: Top 15 enriched GO BP terms are showed in the bar plot of each disease state in each tissue. Each row represents a significant GO biological process which is colored according to the -log10(p.adjust).
ColorectumMSI-HGO analysis - Figure of enriched GO biological processes: Top 15 enriched GO BP terms are showed in the bar plot of each disease state in each tissue. Each row represents a significant GO biological process which is colored according to the -log10(p.adjust).
ColorectumFAPGO analysis - Figure of enriched GO biological processes: Top 15 enriched GO BP terms are showed in the bar plot of each disease state in each tissue. Each row represents a significant GO biological process which is colored according to the -log10(p.adjust).
∗Top 15 enriched GO BP terms are showed in the bar plot of each disease state in each tissue. Each row represents a significant GO biological process which is colored according to the -log10(p.adjust).
Page: 1 2 3 4 5 6 7 8 9 

check button Enriched GO biological processes.
GO IDTissueDisease StageDescriptionGene RatioBg Ratiopvaluep.adjustCount
GO:0072594ColorectumADestablishment of protein localization to organelle148/3918422/187237.95e-121.04e-09148
GO:0022613ColorectumADribonucleoprotein complex biogenesis151/3918463/187231.96e-091.39e-07151
GO:0006913ColorectumADnucleocytoplasmic transport102/3918301/187231.00e-074.85e-06102
GO:0051169ColorectumADnuclear transport102/3918301/187231.00e-074.85e-06102
GO:1900180ColorectumADregulation of protein localization to nucleus55/3918136/187231.70e-077.34e-0655
GO:0032386ColorectumADregulation of intracellular transport109/3918337/187235.33e-071.95e-05109
GO:0033157ColorectumADregulation of intracellular protein transport80/3918229/187235.81e-072.09e-0580
GO:0006417ColorectumADregulation of translation141/3918468/187231.32e-064.22e-05141
GO:0034504ColorectumADprotein localization to nucleus94/3918290/187232.83e-068.09e-0594
GO:0046822ColorectumADregulation of nucleocytoplasmic transport41/3918106/187232.17e-054.33e-0441
GO:0017038ColorectumADprotein import67/3918206/187236.34e-051.05e-0367
GO:0051170ColorectumADimport into nucleus53/3918159/187231.76e-042.38e-0353
GO:0006606ColorectumADprotein import into nucleus51/3918155/187233.29e-043.86e-0351
GO:1904589ColorectumADregulation of protein import25/391863/187235.30e-045.71e-0325
GO:0042254ColorectumADribosome biogenesis84/3918299/187231.82e-031.50e-0284
GO:0042306ColorectumADregulation of protein import into nucleus22/391860/187233.64e-032.60e-0222
GO:00725942ColorectumMSSestablishment of protein localization to organelle139/3467422/187235.75e-131.12e-10139
GO:00226132ColorectumMSSribonucleoprotein complex biogenesis144/3467463/187232.76e-113.67e-09144
GO:00069132ColorectumMSSnucleocytoplasmic transport99/3467301/187231.35e-091.03e-0799
GO:00511692ColorectumMSSnuclear transport99/3467301/187231.35e-091.03e-0799
Page: 1 2 3 4 5 6 7 8 9 10 11 12 

check button Enriched KEGG pathways.
Pathway IDTissueDisease StageDescriptionGene RatioBg Ratiopvaluep.adjustqvalueCount
Page: 1 

Top

Cell-cell communication analysis

check buttonIdentification of potential cell-cell interactions between two cell types and their ligand-receptor pairs for different disease states
LigandReceptorLRpairPathwayTissueDisease Stage
Page: 1 

Top

Single-cell gene regulatory network inference analysis

check buttonFind out the significant the regulons (TFs) and the target genes of each regulon across cell types for different disease states
TFCell TypeTissueDisease StageTarget GeneRSSRegulon Activity
∗The dot plots of a searched regulon are shown for all cell subpopulations in each disease state of each tissue based on the regulon specific score inferred using pySCENIC and by calculating the average expression.
Page: 1 

Top

Somatic mutation of malignant transformation related genes

check buttonAnnotation of somatic variants for genes involved in malignant transformation
Hugo SymbolVariant ClassVariant ClassificationdbSNP RSHGVScHGVSpHGVSp ShortSWISSPROTBIOTYPESIFTPolyPhenTumor Sample BarcodeTissueHistologySexAgeStageTherapy TypesDrugsOutcome
NOLC1SNVMissense_Mutationrs747818823c.1108N>Cp.Glu370Glnp.E370QQ14978protein_codingdeleterious_low_confidence(0.02)probably_damaging(0.943)TCGA-A2-A0YD-01Breastbreast invasive carcinomaFemale<65I/IIChemotherapycytoxanSD
NOLC1SNVMissense_Mutationc.1604N>Tp.Ser535Phep.S535FQ14978protein_codingdeleterious_low_confidence(0)probably_damaging(0.999)TCGA-C8-A1HL-01Breastbreast invasive carcinomaFemale<65III/IVUnknownUnknownSD
NOLC1insertionIn_Frame_Insnovelc.648_649insAGCAGCp.Ser226_Ser227dupp.S226_S227dupQ14978protein_codingTCGA-A2-A0D2-01Breastbreast invasive carcinomaFemale<65I/IIChemotherapyadriamycinSD
NOLC1insertionNonsense_Mutationnovelc.1669_1670insGTTAGAACTGAGTCATTGATTCTGGCCCATACTCp.Asn557SerfsTer2p.N557Sfs*2Q14978protein_codingTCGA-A2-A0EY-01Breastbreast invasive carcinomaFemale<65I/IIChemotherapyadriamycinSD
NOLC1insertionFrame_Shift_Insnovelc.1729_1730insTGCATGAGCGTCCTCATGACp.Glu577ValfsTer17p.E577Vfs*17Q14978protein_codingTCGA-A8-A06T-01Breastbreast invasive carcinomaFemale>=65III/IVHormone TherapyanastrozoleSD
NOLC1SNVMissense_Mutationc.154G>Cp.Asp52Hisp.D52HQ14978protein_codingdeleterious_low_confidence(0)probably_damaging(0.987)TCGA-DR-A0ZM-01Cervixcervical & endocervical cancerFemale<65III/IVUnspecificCisplatinSD
NOLC1SNVMissense_Mutationrs766745577c.1185N>Tp.Lys395Asnp.K395NQ14978protein_codingtolerated_low_confidence(0.1)probably_damaging(0.923)TCGA-FU-A3HZ-01Cervixcervical & endocervical cancerFemale<65I/IIChemotherapycisplatinCR
NOLC1SNVMissense_Mutationc.116G>Tp.Gly39Valp.G39VQ14978protein_codingdeleterious_low_confidence(0)probably_damaging(0.986)TCGA-A6-6781-01Colorectumcolon adenocarcinomaMale<65III/IVChemotherapyoxaliplatinSD
NOLC1SNVMissense_Mutationc.1283C>Tp.Thr428Metp.T428MQ14978protein_codingtolerated_low_confidence(0.12)benign(0.014)TCGA-AA-3672-01Colorectumcolon adenocarcinomaFemale>=65III/IVUnknownUnknownSD
NOLC1SNVMissense_Mutationc.491N>Ap.Ala164Aspp.A164DQ14978protein_codingdeleterious_low_confidence(0)possibly_damaging(0.714)TCGA-AA-3715-01Colorectumcolon adenocarcinomaMale>=65I/IIUnknownUnknownPD
Page: 1 2 3 4 5 6 7 8 9 

Top

Related drugs of malignant transformation related genes

check buttonIdentification of chemicals and drugs interact with genes involved in malignant transfromation
(DGIdb 4.0)
Entrez IDSymbolCategoryInteraction TypesDrug Claim NameDrug NamePMIDs
Page: 1